UNITED STATES
SECURITIES AND EXCHANGE COMMISSION
Washington, D.C. 20549
FORM
ANNUAL REPORT PURSUANT TO SECTION 13 OR 15(d) OF THE SECURITIES EXCHANGE ACT OF 1934 |
For the fiscal year ended
OR
TRANSITION REPORT PURSUANT TO SECTION 13 OR 15(d) OF THE SECURITIES EXCHANGE ACT OF 1934 |
For the transition period from to
Commission file number
(Exact name of registrant as specified in its charter)
| ||
(State or Other Jurisdiction of Incorporation or Organization) | (I.R.S. Employer Identification No.) | |
(Address of Principal Executive Offices) | (Zip Code) |
Registrant’s telephone number, including area code (
Securities registered pursuant to Section 12(b) of the Act:
Title of each class | Trading Symbol(s) | Name of each exchange on which registered |
Securities registered pursuant to Section 12(g) of the Act:
NONE
Indicate by check mark if the registrant is a well-known seasoned issuer, as defined in Rule 405 of the Securities Act.
No ☐ |
Indicate by check mark if the registrant is not required to file reports pursuant to Section 13 or Section 15(d) of the Act.
Yes ☐ |
Indicate by check mark whether the registrant (1) has filed all reports required to be filed by Section 13 or 15(d) of the Securities Exchange Act of 1934 during the preceding 12 months (or for such shorter period that registrant was required to file such reports), and (2) has been subject to such filing requirements for the past 90 days.
No ☐ |
Indicate by check mark whether the registrant has submitted electronically every Interactive Data File required to be submitted pursuant to Rule 405 of Regulation S-T (§232.405 of this chapter) during the preceding 12 months (or for such shorter period that the registrant was required to submit such files).
No ☐ |
Indicate by check mark whether the registrant is a large accelerated filer, an accelerated filer, a non-accelerated filer, a smaller reporting company, or an emerging growth company. See the definitions of “large accelerated filer,” “accelerated filer,” “smaller reporting company,” and “emerging growth company” in Rule 12b-2 of the Exchange Act.
☒ | Accelerated filer | ☐ | |
Non-accelerated filer | ☐ | Smaller reporting company | |
Emerging growth company |
If an emerging growth company, indicate by check mark if the registrant has elected not to use the extended transition period for complying with any new or revised financial accounting standards provided pursuant to Section 13(a) of the Exchange Act. ☐
Indicate by check mark whether the registrant is a shell company (as defined in Rule 12b-2 of the Exchange Act). Yes
The aggregate market value of the Registrant’s Common Stock held by non-affiliates as of June 27, 2019, based on the closing sale price per share as reported by the New York Stock Exchange on such date, was $
Documents Incorporated by Reference:
Portions of the Registrant’s proxy statement for the Annual Meeting of Shareholders to be filed pursuant to Regulation 14A of the Exchange Act on or before April 24, 2020, are incorporated by reference into Part III of this Form 10-K. Except as expressly incorporated by reference, the Registrant’s proxy statement shall not be deemed to be part of this report.
TABLE OF CONTENTS
PART I | ||
3 | ||
Item 1 | 5 | |
Item 1A | 19 | |
Item 1B | 41 | |
Item 2 | 42 | |
Item 3 | 42 | |
Item 4 | 43 | |
PART II | ||
Item 5 | 44 | |
Item 6 | 46 | |
Item 7 | Management’s Discussion and Analysis of Financial Condition and Results of Operations | 49 |
Item 7A | 65 | |
Item 8 | 66 | |
Item 9 | Changes in and Disagreements with Accountants on Accounting and Financial Disclosure | 99 |
Item 9A | 99 | |
Item 9B | 100 | |
PART III | ||
Item 10 | 102 | |
Item 11 | 102 | |
Item 12 | Security Ownership of Certain Beneficial Owners and Management and Related Stockholder Matters | 102 |
Item 13 | Certain Relationships and Related Transactions, and Director Independence | 102 |
Item 14 | 102 | |
PART IV | ||
Item 15 | 103 | |
Item 16 | 106 | |
107 |
2
PART I
FORWARD LOOKING STATEMENTS.
The discussion in this Annual Report on Form 10-K (this “Annual Report”), including under Item 1A, “Risk Factors” of Part I and Item 7, “Management’s Discussion and Analysis of Financial Condition and Results of Operations” of Part II, contains forward-looking statements. All statements other than statements of historical fact contained in this Annual Report, including statements regarding our future operating results and financial position, business strategy and plans and objectives of management for future operations, are forward-looking statements. These statements involve known and unknown risks, uncertainties and other important factors that may cause our actual results, performance or achievements to be materially different from any future results, performance or achievements expressed or implied by the forward-looking statements. Forward-looking statements are based on management’s current expectations and assumptions regarding the Company’s business, the economy and other future conditions, including the impact of natural disasters on sales. In some cases, you can identify forward-looking statements by terms such as “may,” “will,” “should,” “expects,” “plans,” “anticipates,” “could,” “seeks,” “intends,” “target,” “projects,” “contemplates,” “believes,” “estimates,” “predicts,” “budget,” “potential” or “continue” or the negative of these terms or other similar expressions.
The forward-looking statements contained in this Annual Report are only predictions. Although we believe that the expectations reflected in the forward-looking statements in this Annual Report are reasonable, we cannot guarantee future events, results, performance or achievements. A number of important factors could cause actual results to differ materially from those indicated by the forward-looking statements in this Annual Report, including, without limitation, those factors described in Item 1A, “Risk Factors” of Part I of this Annual Report, Item 7, “Management’s Discussion and Analysis of Financial Condition and Results of Operations” of Part II of this Annual Report, and elsewhere in the Company’s filings with the Securities and Exchange Commission (the “SEC”). Some of the key factors that could cause actual results to differ from our expectations include the following:
● | an overall decline in the health of the economy, the hard surface flooring industry, consumer spending and the housing market; |
● | our failure to successfully anticipate consumer preferences and demand; |
● | our inability to manage our growth; |
● | our inability to manage costs and risks relating to new store openings; |
● | suppliers may sell similar or identical products to our competitors; |
● | competition from other stores and internet-based competition; |
● | any disruption in our distribution capabilities, including from difficulties operating our distribution centers; |
● | fluctuations in material and energy costs; |
● | our failure to execute our business strategy effectively and deliver value to our customers; |
● | our inability to manage our inventory obsolescence, shrinkage and damage; |
● | our inability to find available locations for our stores on terms acceptable to us; |
● | our inability to maintain sufficient levels of cash flow to meet growth expectations; |
● | our dependence on foreign imports for the products we sell, which may include the impact of tariffs; |
● | violations of laws and regulations applicable to us or our suppliers; |
● | our inability to obtain merchandise on a timely basis at prices acceptable to us; |
● | our failure to adequately protect against security breaches involving our information technology systems and customer information; |
● | our vulnerability to natural disasters and other unexpected events; |
● | our inability to find, train and retain key personnel; and |
3
● | restrictions imposed by our indebtedness on our current and future operations. |
Because forward-looking statements are inherently subject to risks and uncertainties, some of which cannot be predicted or quantified, you should not rely on these forward-looking statements as predictions of future events. The forward-looking statements contained in this Annual Report speak only as of the date hereof. New risks and uncertainties arise over time, and it is not possible for us to predict those events or how they may affect us. If a change to the events and circumstances reflected in our forward-looking statements occurs, our business, financial condition, and operating results may vary materially from those expressed in our forward-looking statements. Except as required by applicable law, we do not plan to publicly update or revise any forward-looking statements contained herein, whether as a result of any new information, future events or otherwise.
4
ITEM 1. BUSINESS.
Except where the context suggests otherwise, the terms “Floor & Decor Holdings, Inc.,” “Floor & Decor,” the “Company,” “we,” “us,” and “our” refer to Floor & Decor Holdings, Inc., a Delaware corporation, together with its consolidated subsidiaries.
Our fiscal year is the 52 or 53 week period ending on the Thursday preceding December 31. The following discussion contains references to fiscal 2015, fiscal 2016, fiscal 2017, fiscal 2018, fiscal 2019, and fiscal 2020, which represent our fiscal years ended or ending, as applicable, December 29, 2016, December 28, 2017, December 27, 2018, and December 26, 2019, all of which are 52 week periods, and our fiscal years ended December 31, 2015, and December 31, 2020, which are 53 week periods.
Our Company
Founded in 2000, Floor & Decor is a high-growth, differentiated, multi-channel specialty retailer of hard surface flooring and related accessories with 120 warehouse-format stores across 30 states. We believe that we offer the industry’s broadest in-stock assortment of tile, wood, laminate, vinyl, and natural stone flooring along with decorative and installation accessories at everyday low prices positioning us as the one-stop destination for our customers’ entire hard surface flooring needs. We appeal to a variety of customers, including general contractors, professional installers and other commercial businesses (“Pro”), Do It Yourself customers (“DIY”) and customers who buy the products for professional installation (“Buy it Yourself” or “BIY”). Our Pro customers are loyal, shop often and help promote our brand. The combination of our category and product breadth, low prices, in-stock inventory in project-ready quantities, proprietary credit offerings, free storage options and dedicated customer service positions us to gain share in the attractive Pro customer segment. We believe our DIY customers spend significant time planning their projects while conducting extensive research in advance. We provide our customers with the education and inspiration they need before making a purchase through our differentiated online and in-store experience.
Our warehouse-format stores, which average approximately 76,000 square feet, are typically larger than any of our specialty retail flooring competitors’ stores. Other large format home improvement retailers only allocate a small percentage of their floor space to hard surface flooring and accessories. When our customers walk into a Floor & Decor store for the first time, we believe they are amazed by our visual presentation, our store size, our everyday low prices and the breadth and depth of our merchandise. We believe that our inspiring design centers, creative and informative visual merchandising, and accessible price points greatly enhance our customers’ experience. Our stores are easy to navigate and designed to interactively showcase the wide array of designs and product styles a customer can create with our flooring and decorative accessories. We engage our customers both through our trained store associates and designers who can assist in narrowing choices and making the process of home renovation easier, as well as our staff dedicated to serving Pro customers. By carrying a deep level of in-stock hard surface flooring inventory and wide range of tools and accessories, we seek to offer our customers immediate availability on everything they need to complete their entire flooring or remodeling project. In addition to our stores, our website FloorandDecor.com showcases our products, offers informational training and design ideas and has our products available for sale, which a customer can pick up in-store or have delivered. Our ability to purchase directly from manufacturers through our direct sourcing model enables us to be fast to market with a balanced assortment of bestseller and unique, hard to find items that are the latest trend-right products. We believe these factors create a differentiated value proposition for Floor & Decor and drive customer loyalty with our Pro, DIY and BIY hard surface flooring customers in our markets, as evidenced by our track record of consistent comparable store sales growth, which has averaged 12.5% over the last five years. Based on these characteristics, we believe Floor & Decor is redefining and expanding the addressable market size of the hard surface flooring category and that we have an opportunity to significantly expand our store base to approximately 400 stores nationwide within the next 10-12 years, as described in more detail below.
Our Company was founded in 2000 by our Vice Chairman Vincent West, who opened the first Floor & Decor store in Atlanta, Georgia, with the vision of being the low-price leader for hard surface flooring. As we have grown, we have implemented a customer-focused and decentralized approach to managing our business. We provide our store leadership and regional operating teams with regular training and sophisticated information technology systems. We also train and incentivize our store associates to deliver a superior experience to our customers. Taken together, these elements create a customer-centric culture that helps us achieve our operational and financial goals.
Over the last several years, we have invested significant resources across our business and infrastructure to support innovation and growth. We believe that these investments will continue to strengthen our customer value proposition and further differentiate Floor & Decor from our competition, positioning us for continued market share gains. We have made significant investments in product innovation across all categories, improving our assortment and seeking to provide more value to our Pro, DIY
5
and BIY customers. We have also invested in technology and personnel to support our stores. We believe that our investments in our business will continue to improve our customer value proposition, differentiating us and strengthening our competitive advantage.
We believe our strong financial results are a reflection of our consistent and disciplined culture of innovation and reinvestment, creating a differentiated business model in the hard surface flooring category, as evidenced by the following:
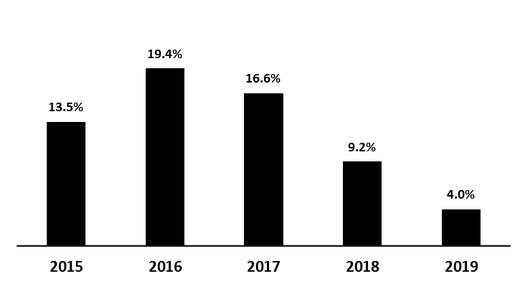
• | eleven years of comparable store sales growth averaging 13.8% per year (and averaging 12.5% per year for fiscal 2015 to fiscal 2019) with a 4.0% increase in fiscal 2019 compared to 9.2% for fiscal 2018; |
• | store base expansion from 57 warehouse-format stores at the end of fiscal 2015 to 120 warehouse-format stores at the end of fiscal 2019, representing a compound annual growth rate (“CAGR”) of 20.5%; we added 20 warehouse-format stores during fiscal 2019, which was a 20.0% growth in units compared to fiscal 2018; |
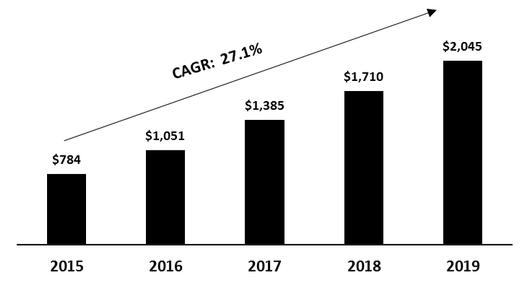
• | total net sales growth from $784.0 million to $2.05 billion from fiscal 2015 to fiscal 2019, representing a CAGR of 27.1%; |
• | net income growth from $26.8 million to $150.6 million from fiscal 2015 to fiscal 2019, representing a CAGR of 54.0%; |
• | Adjusted EBITDA growth from $72.9 million to $242.6 million from fiscal 2015 to fiscal 2019, representing a CAGR of 35.1%, which includes significant investments in our sourcing and distribution network, integrated IT systems, and corporate overhead to support our future growth. Adjusted EBITDA was $242.6 million for fiscal 2019, an increase of 26.4% over fiscal 2018. Adjusted EBITDA is a non-GAAP (as defined below) financial measure. For a reconciliation of net income to Adjusted EBITDA, see Item 6 “Selected Financial Data.” |
Net Sales (in millions) | Comparable Store Sales Growth |
Our Competitive Strengths
We believe our strengths, described below, set us apart from our competitors and are the key drivers of our success.
Unparalleled Customer Value Proposition. Our customer value proposition is a critical driver of our business. The key components include:
● | Differentiated Assortment Across a Wide Variety of Hard Surface Flooring Categories. Our stores are generally larger than those of our specialty retail flooring competitors, and we allocate substantially more square footage to hard surface flooring and accessories than other large format home improvement retailers. We believe we have the most comprehensive in-stock, trend-right product assortment in the industry within our categories with on average approximately 3,800 stock keeping units (“SKUs”) in each store which, based on our market experience, is a far greater in-stock offering than any other flooring retailer. Additionally, we customize our product assortment at the store level for the regional preferences of each market. We have an ongoing product line review process across all categories that |
6
allows us to identify and interpret emerging trends in hard surface flooring. We work with our suppliers to quickly introduce new products and styles in our stores. We appeal to a wide range of customers through our “good/better/best” merchandise selection, as well as through our broad range of product styles from classic to modern, as well as new trend-right products. We consistently innovate with proprietary brands and products that appeal to certain customers with over 60 proprietary brands, including AquaGuard®, DuraLux® , and NuCore®. |
● | Low Prices. We provide everyday low prices in the retail hard surface flooring market. Our merchandising and individual store teams competitively shop each market so that we can offer our flooring products and related accessories at low prices. We also work with our vendors to identify and create new, affordable products in categories traditionally considered high-end to further democratize hard surface flooring by providing a greater number of options to a larger customer base. We believe we are unique in our industry in employing an “everyday low price” strategy, where we strive to offer our products at consistently everyday low prices throughout the year instead of engaging in frequent promotional activities. Our ability to provide these low prices is supported by our direct-sourcing model, which strives to eliminate third-party intermediaries and shortens time to market. We believe this strategy creates trust with our Pro, DIY and BIY customers because they consistently receive low prices at Floor & Decor without having to wait for a sale or negotiate to obtain the lowest price. |
● | One-Stop Project Destination with Immediate Availability. We carry an extensive range of products, including flooring and decorative accessories, as well as installation accessories such as thin set, underlayment, grout and tools, to fulfill a customer’s entire flooring project. Our large in-stock assortment, including decorative and installation accessories, differentiates us from our competitors. Our stores stock job-size quantities to immediately fulfill a customer’s entire flooring project. In the instance where a product is not available in the store, our four regional distribution centers and neighboring stores can quickly ship the product to meet a customer’s needs. On average, each warehouse-format store carries approximately 3,800 SKUs, which equates to 1.3 million square feet of flooring products or $2.5 million of inventory at cost. Customers also have access to all of our inventory for in-store pick up or delivery through FloorandDecor.com. |
Unique and Inspiring Shopping Environment. Our stores average approximately 76,000 square feet and are typically designed with warehouse features including high ceilings, clear signage, bright lighting and industrial racking and are staffed with knowledgeable store associates. We offer an easy-to-navigate store layout with clear lines of sight and departments organized by our major product categories of tile, wood, laminate, vinyl, natural stone, decorative accessories and installation accessories. We believe our unique signage, which clearly displays individual product features and benefits, improves the ease of shopping and facilitates customer decision making. We use merchandise displays and point of sale marketing throughout our stores to highlight product features, benefits and design elements. These features educate and enable customers to visualize how the product would look in their homes or businesses. Furthermore, we encourage customers to interact with our merchandise, to experiment with potential designs and to see the actual product they will purchase, an experience that is not possible in flooring stores that do not carry in-stock inventory in project-ready quantities. The majority of our stores have design centers that showcase project ideas to further inspire our customers, and we employ experienced designers in all of our stores to provide free design consulting. Additionally, we provide a robust online experience for potential customers on FloorandDecor.com. For our DIY customers, we also offer weekly “how-to” installation classes on Saturdays. We believe inspiring and educating customers within our stores and on our website provides us with a significant competitive advantage in serving our customers.
Extensive Service Offerings to Enhance the Pro Customer Experience. Our focus on meeting the unique needs of the Pro customer, and by extension the BIY customer, drives our estimated sales mix of approximately 60% Pro and BIY customers, which we believe represents a higher percentage than our competitors. We provide an efficient one-stop shopping experience for our Pro customers, offering low prices on a broad selection of high-quality flooring products, deep inventory levels to support immediate availability of our products, financial credit, free storage for purchased inventory, the convenience of early store hours and, in most stores, separate entrances for merchandise pick-up. Additionally, each store has a dedicated Pro sales force with technology to service our Pro customer more efficiently, and we have Pro Zones, which are areas offering a variety of services to Pro customers, in a majority of our stores. We have a Pro loyalty rewards program, which provides business-building tools and awards points based on purchases. We believe rewarding our Pro customers through this program improves their loyalty to Floor & Decor, and by serving the needs of Pro customers, we drive repeat and high-ticket purchases, customer referrals, and brand awareness from this attractive and loyal customer segment.
7
Decentralized Culture with an Experienced Store-Level Team and Emphasis on Training. We have a decentralized culture that empowers managers at the store and regional levels to make key decisions to maximize the customer experience. Our store managers, who carry the title Chief Executive Merchant (“CEM”), have significant flexibility to customize product mix, pricing, marketing, merchandising, visual displays and other elements in consultation with their regional leaders. We tailor the merchandising assortment for each of our stores for local market preferences, which we believe differentiates us from our national competitors that tend to have standard assortments across markets. Throughout the year, we train all of our employees on a variety of topics, including product knowledge, sales strategies, leadership and store operations. Our store managers and store department managers are an integral part of our company, and many have over 15 years of relevant industry experience in retail. We have made important investments in the training and development of our people, including the creation of a full time training department. Approximately 70% of our new store management positions are filled through internal promotions, including 94% of our CEMs. We also have incentive compensation programs and an employee stock purchase plan for all employees, regardless of position or title. We train prospective store managers at our CEM Leadership Workshop, which is part of an extensive training program. Once a year, we hold a four day training session with our senior management, regional directors and store managers, where we focus on the upcoming year’s strategic priorities to keep our entire business aligned. We believe our decentralized culture and coordinated training foster an organization aligned around providing a superior customer experience, ultimately contributing to higher net sales and profitability.
Sophisticated, Global Supply Chain. Our merchandising team has developed direct sourcing relationships with manufacturers and quarries in over 20 countries. Through these relationships, we believe we understand the best places to procure our various product categories. We currently source our products from more than 225 vendors worldwide and have developed long-term relationships with many of them. We often collaborate with our vendors to design and manufacture products for us to address emerging customer preferences that we observe in our stores and markets. We procure the majority of our products directly from the manufacturers, which eliminates additional costs from exporters, importers, wholesalers and distributors. We believe direct sourcing is a key competitive advantage, as many of our specialty retail flooring competitors are too small to have the scale or the resources to work directly with suppliers. We have established a Global Sourcing and Compliance Department to, among other things, enhance our policies and procedures with respect to addressing compliance with appropriate regulatory bodies, including compliance with the requirements of the Lacey Act of 1900 (as amended, the “Lacey Act”), the California Air Resources Board (“CARB”) and the Environmental Protection Agency (“EPA”). We also utilize third-party consultants for audits, testing and surveillance to ensure product safety and compliance. Additionally, we have invested in technology and personnel to collaborate throughout the entire supply chain process to support our direct sourcing model, which has improved our ability to find, manage and source trend-right merchandise quickly and at lower costs, allowing us to offer products at low prices while maintaining attractive gross margins.
Highly Experienced Management Team with a Proven Track Record. Led by our Chief Executive Officer, Tom Taylor, our management team brings substantial expertise from leading retailers and other companies across various core functions, including store operations, merchandising, marketing, real estate, e-commerce, supply chain management, finance, legal and information technology. Tom Taylor, who joined us in 2012, spent 23 years at The Home Depot, where he served as Executive Vice President of Merchandising and Marketing with responsibility for all stores in the United States and Mexico. Over the course of his career at The Home Depot, Tom Taylor helped expand the store base from fewer than 15 stores to over 2,000 stores. Our President, Lisa Laube, has over 30 years of merchandising and leadership experience with leading specialty retailers, including as President of Party City. Our Executive Vice President and Chief Financial Officer, Trevor Lang, brings more than 25 years of accounting and finance experience, including 19 years of Chief Financial Officer and Vice President of Finance experience at public companies, including the Chief Financial Officer and Chief Administrative Officer of Zumiez Inc. Our entire management team drives our organization with a focus on strong merchandising, superior customer experience, expanding our store footprint, and fostering a strong, decentralized culture. We believe our management team is an integral component of our achieving strong financial results.
Our Growth Strategy
We expect to continue to drive our strong net sales and profit growth through the following strategies:
Open Stores in New and Existing Markets. We believe there is an opportunity to significantly expand our store base in the United States from 120 warehouse-format stores currently to approximately 400 stores nationwide over the next 10-12 years based on our internal research with respect to housing density, demographic data, competitor concentration and other variables in both new and existing markets. We plan to target new store openings in both new and existing, adjacent and underserved markets. We have a disciplined approach to new store development, based on an analytical, research-driven site selection method and a rigorous real estate approval process. We believe our new store model delivers strong financial results and returns on investment, targeting net sales on average of $12 million to $15 million and positive four-wall adjusted EBITDA in the first year, pre-tax payback in approximately two
8
years and cash-on-cash returns of greater than 50% in the third year. Over the past several years, we have made significant investments in personnel, information technology, supply chain, warehouse infrastructure, and connected customer strategies to support our current growth and the expansion of our stores. We intend to grow our store base by approximately 20% annually for the next several years. The performance of our new stores opened over the last three years, the performance of our older stores over that same time frame, our disciplined real estate strategy, and the track record of our management team in successfully opening retail stores support our belief in the significant store expansion opportunity.
Increase Comparable Store Sales. We expect to grow our comparable store sales by continuing to offer our customers a dynamic and expanding selection of compelling, value-priced hard surface flooring and accessories while maintaining strong service standards for our customers. We regularly introduce new products into our assortment through our category product line review process, including collaboration with our vendors to bring to market innovative products such as waterproof rigid core vinyl and water-resistant laminates. Because almost half of our stores have been opened for less than three years, we believe they will continue to drive comparable store sales growth as they ramp to maturity. We believe that we can continue to enhance our customer experience by focusing on service, optimizing sales and marketing strategies, investing in store staff and infrastructure, remodeling existing stores and improving visual merchandising and the overall aesthetic appeal of our stores. We also believe that growing our proprietary credit offering, Pro and designer strategies, further integrating connected customer strategies, and enhancing other key information technology, will contribute to increased comparable store sales. As we increase awareness of Floor & Decor’s brand, we believe there is a significant opportunity to gain additional market share, especially from independent flooring retailers and large format home improvement retailers. We are also adding adjacent categories that align with flooring projects like vanities, bathroom accessories, frameless glass in the bathroom, and customized countertops for the kitchen. We believe the combination of these initiatives plus the expected growth of the hard surface flooring category described in more detail under “Our Industry” below will continue to drive strong comparable store sales growth.
Expand Our “Connected Customer” Experience. Floor & Decor’s online experience allows our Pro, BIY and DIY customers to explore our product selection and design ideas before and after visiting our stores and offers the convenience of making online purchases for delivery or pick up in-store. We believe our online platform reflects our brand attributes and provides a powerful tool to educate, inspire and engage our consumers, and we view our website and multi-channel strategies as leading our brand. Our research indicates that 81% of customers who shopped at Floor & Decor in the last two years have visited our website. We continuously invest in our connected customer strategies to improve how our customers experience our brand. For example, we regularly update our website, which provides our customers with inspirational vignettes, videos, products, a room visualizer, and education. Additional initiatives include: (i) implementing our new CRM to obtain a single view of our customers, (ii) developing personalized content based on location, purchase and browsing history, (iii) developing more relevant content and improved search and purchasing tools to help customers add decorative and installation accessories and (iv) creating frequently asked questions to help customers choose the best product for their jobs. We believe this reinforces our unique customer value proposition and ultimately drives sales. Currently, e-commerce sales represent approximately 10% of our total net sales. While the hard surface flooring category has a relatively low penetration of e-commerce sales due to the nature of the product, we believe our connected customer presence represents an attractive growth opportunity to drive consumers to Floor & Decor.
Continue to Invest in the Pro and Commercial Customer. We believe our differentiated focus on Pro customers has created a competitive advantage for us and will continue to drive our net sales growth. We will invest in gaining and retaining Pro customers due to their frequent and high-ticket purchases, loyalty, and propensity to refer other potential customers. We have made important investments in the Pro services regional team, including the addition of Pro Regional Account Directors, to better recruit and train the Pro services team in each store. We have also invested in new technology, such as integrated CRM software, to help us further penetrate and grow our Pro business, dedicated phone lines for our Pro customers to call and text, commercial credit and open account terms, jobsite delivery, a dedicated website for Pro customers, training on technical flooring installation solutions, and tools to facilitate large commercial jobs sourced throughout the store. We plan to further invest in initiatives to increase speed of service, improve financing solutions, leverage technology, elevate our Pro branding, dedicate additional store staffing to support Pro customers, and enhance the in-store experience for our Pro customers. We have implemented a “Pro Zone” in a majority of our stores that focuses on the specific needs of the Pro customer as well as a Pro loyalty program in all of our stores. Additionally, we communicate our value proposition and various Pro-focused offerings by hosting a number of Pro networking events. Building on our success in serving the Pro customer, in 2016 we entered the adjacent commercial sales channel, thereby increasing the size of the addressable market we serve. Our commercial effort, which we have branded F&D Commercial, targets corporate customers with large flooring needs. We believe Pro customers will continue to be an integral part of our sales growth, and the commercial channel will provide incremental revenue and profit opportunities in the future.
9
Continue to Invest in Design Services. Our Design Services offer a unique to large format retail experience, which leads our customers through a seamless, inspirational design process to complete their projects. Our research tells us when a designer is involved, customer satisfaction is higher, the average ticket is higher (3-4x that of the total company), and design appointments close at a higher rate than typical transactions. We position our designers as experts through our inspirational content and promote design services through all channels. We intend to continue to invest in recruiting top design talent, training, tools and technology. Design-focused training is a priority to ensure our teams are knowledgeable and prepared to deliver a start-to-finish consultative selling experience. We believe the planned rollout of our customer relationship management technology to our design teams this year will enhance communication and workflow, from initial customer interaction through securing the close of the sale and beyond. Recent realignment within the field organization to support design is expected to amplify the effectiveness of influence and high-level strategic execution. Additionally, we intend to continue to test advanced service options in various markets to further set us apart.
Enhance Margins Through Increased Operating Leverage. Since 2011, we have invested significantly in our sourcing and distribution network, integrated IT systems and corporate overhead to support our growth. We expect to leverage these investments as we grow our net sales. Additionally, we believe operating margin improvement opportunities will include enhanced product sourcing processes and overall leveraging of our store-level fixed costs, existing infrastructure, supply chain, corporate overhead and other fixed costs resulting from increased sales productivity. We anticipate that the planned expansion of our store base and growth in comparable store sales will also support increasing economies of scale.
Our Industry
Floor & Decor operates in the large, growing and highly fragmented $14 billion hard surface flooring market (in manufacturers’ dollars), which is part of the larger $24 billion U.S. floor coverings market (in manufacturers’ dollars) based on internal research as well as a 2019 research report by Catalina Research, Inc., a leading provider of market research for the floor coverings industry (the “Catalina Floor Coverings Report”). We estimate that, after retail markup, the addressable hard surface flooring market for Floor & Decor is $22 billion, of which we represent approximately 8%, which increased from approximately 7% in 2018. The hard surface flooring market described above does not include installation materials and tools, which represented 17% of our net sales in 2019. The competitive landscape of the hard surface flooring market includes big-box home improvement centers, national and regional specialty flooring retailers, and independent flooring retailers. We believe we benefit from growth in the overall hard surface flooring market, which grew on average 6% per year from 2014 to 2019 and is estimated to grow on average 3%-6% per year from 2020 through 2024, assuming no negative economic cycle, housing downturn or recession. We believe that growth in the hard surface flooring market has been and will continue to be driven by home remodeling demand drivers such as the aging household inventory, millennials forming households, existing home sales, rising home equity values and the secular shift from carpet to hard surface flooring. In addition, we believe we have an opportunity to increase our market share as our competitors are unable to compete with our combination of price, service and in-stock assortment.
Based on our internal market research, key long-term industry trends include increasing spend on home renovations, aging of the existing housing stock, rising level of home ownership, growing average size of homes and favorable demographic trends. Throughout this decade, hard surface flooring has consistently taken share from carpet as a percentage of the total floor coverings market, increasing from 48% of the market in 2014 to 54% in 2019. Historically, mix shift towards hard surface flooring has been driven by product innovation, changing consumer preferences, better hygiene qualities, increasing ease of installation and higher durability. Product innovation, which has been aided by the increasing use of technology such as inkjet tile printing, waterproof wood-look flooring and water-resistant laminates, and non-traditional uses of hard surface flooring including walls, fireplaces and patios, has increased the size of the hard surface flooring market and has allowed us to better serve customer needs.
10
We believe we have an opportunity to continue to gain share in the hard surface flooring market with the largest selection of tile, wood, laminate, vinyl, natural stone, decorative accessories and installation accessories. Our strong focus on the customer experience drives us to remain innovative and locally relevant while maintaining low prices and in-stock merchandise in a one-stop shopping destination.
Our Products
We offer an assortment of tile, wood, laminate, vinyl, and natural stone flooring, along with decorative and installation materials at everyday low prices. Our objective is to carry a broad and deep in-stock product offering in order to be the one-stop destination for our customer’s entire project needs. We seek to showcase products in our stores and online to provide multiple avenues for inspiration throughout a customer’s decision-making process.
Our strategy is to fulfill the product needs of our Pro, DIY and BIY customers with our extensive assortment, in-stock inventory and merchandise selection across a broad range of price points. We offer bestseller products in addition to the more unique, hard to find items that we believe our customers have come to expect from us. We source our products from around the world, constantly seeking new and exciting merchandise to offer our customers. Our goal is to be at the forefront of hard surface flooring trends in the market, while offering low prices given our ability to source directly from manufacturers and quarries.
We utilize a regional merchandising strategy in order to carry products in our stores that cater to the preferences of our local customer base. This strategy is executed by our experienced merchandising team, which consists of category merchants and regional merchants, who work with our individual stores to ensure they have the appropriate product mix for their location. Our category merchants are constantly seeking new products and following trends by attending trade shows and conferences, as well as by meeting with vendors around the world. We schedule regular meetings to review information gathered and make future product decisions. This constant connectivity between our stores, regional merchants, category merchants, and our vendors allows us to quickly bring new, innovative, and compelling products to market.
11
Our fiscal 2019 net sales by key product categories are set forth below:
Category | Products Offered | Select Product Highlights | ||
---|---|---|---|---|
Tile | Porcelain, White Body, Ceramic | We offer a wide selection of Porcelain and Ceramic tiles from 4”x4” all the way up to 36”x72” and 48”x48”. We source many products directly from Italy, where many design trends in tile originate. We offer traditional stone looks as well as wood-looking planks and contemporary products like cement-look and vein cut styles. We work with many factories in the United States, Italy, Mexico, Brazil, Turkey and other countries to bring the most in-demand styles at low prices. | ||
Wood | Solid Prefinished Hardwood, Solid Unfinished Hardwood, Engineered Hardwood, Bamboo, Cork, Wood Wall | We sell common species such as Oak, Walnut, Birch, Hickory and Maple but also exotics such as Bamboo and Acacia, all in multiple colors. Our wood flooring comes in multiple widths from 21/4” up to 93/4” wide planks. Customers have the option of buying prefinished or unfinished flooring in many of our stores. | ||
Natural Stone | Marble, Travertine, Limestone, Slate, Granite | Natural stone is quarried around the world, and we typically buy directly from the source. For example, we buy natural stones from Italy, Greece, Spain, Turkey, Portugal, India, and China. We work with factories in these countries and others to cut stone tiles in many sizes, finishes and colors. |
12
Category | Products Offered | Select Product Highlights | ||
---|---|---|---|---|
Laminate/Luxury Vinyl Plank | Laminate Flooring, Luxury Vinyl, Engineered/Composite (Rigid Core) Vinyl | Laminate, AquaGuard® water-resistant laminate, NuCore®, DuraLux® Rigid and Luxury Vinyl plank flooring is offered in styles that mimic our bestselling tile and wood species, colors and finishes. Our product offers a full range of installation methods, many are water-resistant to waterproof, and all are great for customers who want the beauty of real hardwood and stone but the ease of maintenance and durability that laminate and luxury vinyl offer. | ||
Decorative Accessories/ Wall Tile | Glass, Natural Stone, Tile Mosaics and Decorative Tiles, Decorative Trims, Prefabricated Countertops, Medallions, Wall Tile | With over 800 choices in glass, stone mosaics and decoratives, we can customize nearly any look or style a customer desires. This trend-forward and distinctive category is a favorite of our designers and offers customers an inexpensive way to quickly update a backsplash or shower. | ||
Installation Materials and Tools | Grout, Underlayment, Adhesives, Mortar, Backer Board, Power and Hand Tools, Wood Moldings, Wood Glues, Blades | This category offers everything a customer needs to complete his or her project, including backer board, mortar, grout, underlayment, adhesives, wood glues, molding and tools. We sell top brands, which we believe are highly valued by our customers. |
Stores
We operate 120 warehouse-format stores across 30 states and one small 5,500 square foot design center. Most of our stores are situated in highly visible retail and industrial locations. Our warehouse-format stores average approximately 76,000 square feet and carry on average approximately 3,800 flooring, decorative and installation accessory SKUs, which equates to approximately 1.3 million square feet of flooring products or $2.5 million of inventory at cost.
Each of our stores is led by a store manager who holds the title CEM and is supported by an operations manager, product category department managers, a design team, and a Pro sales and support team. Our store management focuses on providing superior customer service and creating customized store offerings that are tailored to meet the specific needs of their stores. Beyond the store managers, each store is staffed with associates, the number of whom vary depending on sales volume and size of the store. We dedicate significant resources to training our new store managers through our CEM Training Workshop and in the field across all product areas, with store-level associates receiving certification on specific product areas. Ongoing training and continuing education are provided for all employees throughout the year.
We believe there is an opportunity to significantly expand our store base in the United States from our 120 warehouse-format stores currently to approximately 400 stores nationwide within the next 10-12 years based on our internal research with respect to housing density, demographic data, competitor concentration and other variables in both new and existing markets. For the next several years, we plan to grow our store base by approximately 20% per year, with approximately half being opened in existing geographies and approximately half being opened in new markets. We have developed a disciplined approach to new store development, based on an analytical, research-driven method to site selection and a rigorous real estate review and approval process. By focusing on key demographic characteristics for new site selection, such as aging of homes, length of home ownership and median income, we expect to open new stores with attractive returns.
When opening new stores, inventory orders are placed several months prior to a new store opening. Significant investment is made in building out or constructing the site, hiring and training employees in advance, and advertising and marketing the new store through pre-opening events to draw the flooring industry community together. Each new store is thoughtfully designed with store
13
interiors that include interchangeable displays on wheels, racking to access products and stand-up visual displays to allow ease of shopping and an exterior highlighted by a large, bold Floor & Decor sign. The majority of our stores have design centers that showcase project ideas to further inspire our customers, and, in all of our stores, we employ experienced designers to provide design consulting to our customers free of charge. Additionally, we have rolled out “Pro Zones”, which are dedicated areas offering a variety of services to Pro customers, in a majority of our stores.
Our new store model targets a store size of 70,000-80,000 square feet, total initial net cash investment of approximately $7 million to $9 million, which could increase as we have the ability to self-develop more new stores, net sales on average of $12 million to $15 million and positive four-wall Adjusted EBITDA in the first year, pre-tax payback in two to three years and cash-on-cash returns of greater than 50% in the third year. We believe the success of our stores across geographies and vintages supports the portability of Floor & Decor into a wide range of markets. The performance of our new stores is inherently uncertain and is subject to numerous factors that are outside of our control. As a result, we cannot assure you that our new stores will achieve our target results.
Connected Customer
We aim to elevate the total customer experience through our website FloorandDecor.com. Growing our e-commerce sales provides us with additional opportunity to enhance our connected customer experience. Home renovation and remodeling projects typically require significant investments of time and money from our DIY customers, and they consequently plan their projects carefully and conduct extensive research online. FloorandDecor.com is an important tool for engaging our DIY customers throughout this process, educating them on our product offerings and providing them with design ideas. Our Pro customers use the website and our Pro app to browse our broad product assortment, to continually educate themselves on new techniques and trends and to share our virtual catalogue and design ideas with their customers and utilize tools such as our calculators to aid with shopping. In addition, sales associates at our call center are available to assist our customers with their projects and questions. We designed the website to be a reflection of our stores and to promote our wide selection of high quality products and low prices. To this end, we believe the website provides not only the same region-specific product selection that customers can expect in our stores, but also the opportunity to extend our assortment by offering our entire portfolio of products.
In addition to highlighting our broad product selection, we believe FloorandDecor.com offers a convenient opportunity for customers to purchase products online and pick them up in our stores. Approximately 85% of our e-commerce sales are picked up in-store. As we continue to grow, we believe connected customer will become an increasingly important part of our strategy.
Marketing and Advertising
We use a multi-platform approach to increasing Floor & Decor’s brand awareness, while historically maintaining a low average advertising to net sales ratio of approximately 3%. We use traditional advertising media, combined with social media and online marketing, to share the Floor & Decor story with a growing audience. We take the same customized approach with our marketing as we do with our product selection; each region has a varied media mix based on local trends and what we believe will most efficiently drive sales. To further enhance our targeting efforts, our store managers have input into their respective stores’ marketing spend.
A key objective of our messaging is to make people aware of our stores, products and services. Based on our internal research, we estimate the conversion rate from a customer visiting one of our stores to purchasing our products is 77%.
As part of our focus on local markets, our stores have events that promote Floor & Decor as a hub for the local home improvement community. We feature networking events for Pro customers, giving them a chance to meet our sales teams, interact with others in the home improvement industry and learn about our newest products. For DIY customers, we regularly offer how-to classes on product installation. We believe these events serve to raise the profile of the Floor & Decor stores in our communities while showcasing our tremendous selection of products and services.
We want our customers to have a great experience at their local Floor & Decor store. Through our TV and radio commercials, print and outdoor ads, in-store flyers, online messaging and community events, we show our customers that we are a trusted resource with a vast selection, all at a low price.
14
Sourcing
Floor & Decor has a well-developed and geographically diverse supplier base. We source our industry leading merchandise assortment from over 225 suppliers in over 20 countries. Our largest supplier accounted for 15% of our net sales in fiscal 2019, while no other individual supplier accounted for more than 7% of our net sales. We are focused on bypassing agents, brokers, distributors, and other middlemen in our supply chain in order to reduce costs and lead time. We believe that our direct sourcing model and the resulting relationships we have developed with our suppliers are distinct competitive advantages. The cost savings we achieve by directly sourcing our merchandise enable us to offer our customers low prices.
We have established a Global Sourcing and Compliance Department to, among other things, develop and implement policies and procedures in order to address compliance with appropriate regulatory bodies, including compliance with the requirements of the Lacey Act, CARB, and the EPA. We utilize third-party consultants for audits, testing, and surveillance to ensure product safety and compliance. We have invested in technology and personnel to collaborate throughout the entire supply chain process. Additionally, our close relationships with suppliers allow us to collaborate with them directly to develop and quickly introduce innovative and quality products that meet our customers’ evolving tastes and preferences at low prices.
Distribution and Order Fulfillment
Merchandise inventory is our most significant working capital asset and is considered “in-transit” or “available for sale”, based on whether we have physically received the products at an individual store location or in one of our four distribution centers. In-transit inventory generally varies due to contractual terms, country of origin, transit times, international holidays, weather patterns and other factors, but approximately 15% of our inventory is in-transit, while roughly 85% is available for sale in our stores or at one of our four distribution centers.
We have invested significant resources to develop and enhance our distribution network. We have four distribution centers strategically located across the United States in port cities near Savannah, Georgia; Houston, Texas; Los Angeles, California; and Baltimore, Maryland. We closed our distribution center near Miami, Florida in the first quarter of fiscal 2018, and we opened our new distribution center near Baltimore, Maryland in the fourth quarter of fiscal 2019. Third-party brokers arrange the shipping of our international and domestic purchases to our distribution centers and stores and bill us for shipping costs according to the terms of the purchase agreements with our suppliers. We are typically able to transport inventory from our distribution centers to our stores in less than one week. This turnaround time enhances our ability to maintain project-ready quantities of the products stocked in our stores. All of our distribution centers are Company-operated facilities, and we have implemented a warehouse management and transportation management system tailored to our unique needs across all four distribution centers. We believe this system helps service levels, reduces shrinkage and damage, helps us better manage our inventory, and allows us to better implement our connected customer initiatives.
In the first quarter of fiscal 2018, we relocated all of the existing inventory from our 322,000 square foot leased distribution center near Miami, Florida to our 1.4 million square foot distribution center near Savannah, Georgia. We plan to exit our lease on the distribution center near Miami, Florida in 2021. Additionally, we began operating a 1.5 million square foot leased distribution center in Baltimore, Maryland in the fourth quarter of fiscal 2019, and we plan to continue to seek further opportunities to enhance our distribution capabilities and align them with our strategic growth initiatives.
Management Information Systems
We believe that technology plays a crucial role in the continued growth and success of our business. We have sought to integrate technology into all facets of our business, including supply chain, merchandising, store operations, point-of-sale, e-commerce, finance, accounting and human resources. The integration of technology allows us to analyze the business in real time and react accordingly. Our sophisticated inventory management system is our primary tool for forecasting, placing orders and managing in-stock inventory. The data-driven platform includes sophisticated forecasting tools based on historical trends in sales, inventory levels and vendor lead times at the store and distribution center level by SKU, allowing us to support store managers in their regional merchandising efforts. We rely on the forecasting accuracy of our system to maintain the in-stock, project-ready quantities that our customers rely on. In addition, our employee training certifications are entirely electronic, allowing us to effectively track the competencies of our staff and manage talent across stores. We believe that our systems are sufficiently scalable to support the continued growth of the business.
15
Competition
The retail hard surface flooring market is highly fragmented and competitive. We face significant competition from large home improvement centers, national and regional specialty flooring chains and independent flooring retailers. Some of our competitors are organizations that are larger, are better capitalized, have existed longer, have product offerings that extend beyond hard surface flooring and related accessories, and have a more established market presence with substantially greater financial, marketing, personnel and other resources than we have. In addition, while the hard surface flooring category has a relatively low threat of new internet-only entrants due to the nature of the product, the growth opportunities presented by e-commerce could outweigh these challenges and result in increased competition in this portion of our connected customer strategy. Further, because the barriers to entry into the hard surface flooring industry are relatively low, manufacturers and suppliers of flooring and related products, including those whose products we currently sell, could enter the market and start directly competing with us.
We believe that the key competitive factors in the retail hard surface flooring industry include:
• | product assortment; |
• | product innovation; |
• | in-store availability of products in project-ready quantities; |
• | product sourcing; |
• | product presentation; |
• | customer service; |
• | store management; |
• | store location; and |
• | low prices. |
We believe that we compete favorably with respect to each of these factors by providing a highly diverse selection of products to our customers, at an attractive value, in appealing and convenient retail stores.
Our Structure
Floor & Decor Holdings, Inc. (formerly known as FDO Holdings, Inc.) was incorporated as a Delaware corporation in October 2010 in connection with our Sponsors’ (as defined below) acquisition of Floor & Decor Outlets of America, Inc. (“F&D”) in November 2010, which in turn converted from a Georgia corporation into a Delaware corporation in connection with this transaction.
16
The following chart illustrates our current corporate structure:
Employees
As of December 26, 2019, we had 7,317 employees, 5,355 of whom were full-time and none of whom were represented by a union. Of the total employees, 6,354 work in our stores, 639 work in corporate, store support, infrastructure, e-commerce or similar functions, 311 work in distribution centers, and 13 work in our Asia sourcing office in Shanghai, China. We believe that we have good relations with our employees.
Government Regulation
We are subject to extensive and varied federal, state and local laws and regulations, including those relating to employment, the environment, protection of natural resources, import and export, advertising, labeling, public health and safety, product safety, zoning and fire codes. We operate our business in accordance with standards and procedures designed to comply with applicable laws and regulations. Compliance with these laws and regulations has not historically had a material effect on our financial condition or operating results; however, the effect of compliance in the future cannot be predicted.
Our operations and properties are also subject to federal, state and local laws and regulations governing the environment, environmental protection of natural resources and health and safety, including the use, storage, handling, generation, transportation, treatment, emission, release, discharge and disposal of hazardous materials, substances and wastes and relating to the investigation and clean-up of contaminated properties. Except to the extent of the capital expenditures related to our initiatives described below, compliance with these laws and regulations has not historically had a material effect on our financial condition or operating results, but we cannot predict the effect of compliance in the future.
In particular, certain of our products are subject to laws and regulations relating to the importation, exportation, acquisition or sale of certain plants and plant products, including those illegally harvested (which is prohibited by the Lacey Act), and the emissions of hazardous materials (which in California is governed by regulations promulgated by CARB and federally by regulations promulgated by the EPA). We have established a Global Sourcing and Compliance Department to, among other things, address these requirements, and we work with third-party consultants to assist us in designing and implementing compliance programs relating to the requirements of the Lacey Act, CARB and the EPA. Further, we could incur material compliance costs or be subject to compliance
17
liabilities or claims in the future, especially in the event new laws or regulations are adopted or there are changes in existing laws and regulations or in their interpretation.
Our suppliers are also subject to the laws and regulations of their home countries, including in particular laws regulating forestry and the environment. We also support social and environmental responsibility among our supplier community and endeavor to enter into vendor agreements with our suppliers that contain representations and warranties concerning environmental, labor and health and safety matters.
Insurance and Risk Management
We use a combination of insurance and self-insurance to provide for potential liability for workers’ compensation, general liability, product liability, director and officers’ liability, team member healthcare benefits, and other casualty and property risks. Changes in legal trends and interpretations, variability in inflation rates, changes in workers’ compensation and general liability premiums and deductibles, changes in the nature and method of claims settlement, benefit level changes due to changes in applicable laws, insolvency of insurance carriers, and changes in discount rates could all affect ultimate settlements of claims. We evaluate our insurance requirements on an ongoing basis to ensure we maintain adequate levels of coverage.
Legal Proceedings
We are engaged in various legal actions, claims and proceedings arising in the ordinary course of business, including claims related to breach of contracts, products liabilities, intellectual property matters and employment related matters resulting from our business activities. As with most actions such as these, an estimation of any possible and/or ultimate liability cannot always be determined. Regardless of the outcome, litigation can have an adverse impact on us because of defense and settlement costs, diversion of management resources, and other factors.
Trademarks and other Intellectual Property
As of February 20, 2020, we have 77 registered marks and several pending trademark applications in the United States. We regard our intellectual property, including our over 60 proprietary brands, as having significant value, and our brand is an important factor in the marketing of our products. Accordingly, we have taken, and continue to take, appropriate steps to protect our intellectual property.
Available Information
We maintain a website at www.FloorandDecor.com. The information on or available through our website is not, and should not be considered, a part of this Annual Report. You may access our annual reports on Form 10-K, quarterly reports on Form 10-Q, current reports on Form 8-K and amendments to those reports, as well as other reports relating to us that are filed with, or furnished to, the SEC free of charge on our website as soon as reasonably practicable after such material is electronically filed with, or furnished to, the SEC.
18
ITEM 1A. RISK FACTORS.
You should carefully consider the risks described below, together with all of the other information included in this Annual Report, including our consolidated financial statements and the related notes thereto, before making an investment decision. The risks and uncertainties set out below are not the only risks we face. Additional risks and uncertainties not currently known to us or that we currently deem to be immaterial also may materially and adversely affect our business, financial condition, and operating results. If any of the following events occur, our business, financial condition, and operating results could be materially and adversely affected. In that case, the trading price of our common stock could decline, and you may lose all or part of your investment.
Risks Related to our Business
Our business, financial condition and operating results are dependent on general economic conditions and discretionary spending by our customers, which in turn are affected by a variety of factors beyond our control. If such conditions deteriorate, our business, financial condition, and operating results may be adversely affected.
Our business, financial condition, and operating results are affected by general economic conditions and discretionary spending by our customers. Such general economic conditions and discretionary spending are beyond our control and are affected by, among other things:
● | consumer confidence in the economy; |
● | trade relations and tariffs; |
● | unemployment trends; |
● | consumer debt levels; |
● | consumer credit availability; |
● | data security and privacy concerns; |
● | the housing market, including housing turnover and whether home values are rising or declining; |
● | energy prices; |
● | interest rates and inflation; |
● | price deflation, including due to low-cost imports; |
● | slower rates of growth in real disposable personal income; |
● | natural disasters and unpredictable weather; |
● | national security concerns and other geopolitical risks; |
● | uncertain U.S. political conditions; |
● | tax rates and tax policy; and |
● | other matters that influence consumer confidence and spending. |
If such conditions deteriorate, our business, financial condition, and operating results may be adversely affected. In addition, increasing volatility in financial and capital markets may cause some of the above factors to change with a greater degree of frequency and magnitude than in the past.
19
The hard surface flooring industry depends on home remodeling activity and other important factors.
The hard surface flooring industry is highly dependent on the remodeling of existing homes, businesses and, to a lesser extent, new home construction. In turn, remodeling and new home construction depend on a number of factors that are beyond our control, including interest rates, tax policy, trade policy, employment levels, consumer confidence, credit availability, real estate prices, existing home sales, demographic trends, weather conditions, natural disasters and general economic conditions. In particular:
● | the national economy or any regional or local economy where we operate could weaken; |
● | home-price appreciation could slow or turn negative; |
● | regions where we have stores that could be impacted by hurricane, fire, or other natural disasters (including those due to the effects of climate change such as increased storm severity, drought, wildfires, and potential flooding due to rising sea levels and storm surges); |
● | interest rates could rise; |
● | credit could become less available; |
● | tax rates and/or health care costs could increase; or |
● | fuel costs or utility expenses could increase. |
Any one or a combination of these factors could result in decreased demand for our products, reduce spending on homebuilding or remodeling of existing homes or cause purchases of new and existing homes to decline. While the vast majority of our net sales are derived from home remodeling activity as opposed to new home construction, a decrease in any of these areas would adversely affect our business, financial condition and operating results.
Any failure by us to successfully anticipate trends may lead to loss of consumer acceptance of our products, resulting in reduced net sales.
Each of our stores is stocked with a customized product mix based on consumer demands in a particular market. Our success therefore depends on our ability to anticipate and respond to changing trends and consumer demands in these markets in a timely manner. If we fail to identify and respond to emerging trends, consumer acceptance of our merchandise and our image with current or potential customers may be harmed, which could reduce our net sales. Additionally, if we misjudge market trends, we may significantly overstock unpopular products, incur excess inventory costs and be forced to reduce the sales price of such products or incur inventory write-downs, which would adversely affect our operating results. Conversely, shortages of products that prove popular could also reduce our net sales through missed sales and a loss of customer loyalty.
If we fail to successfully manage the challenges that our planned new store growth poses or encounter unexpected difficulties during our expansion, our operating results and future growth opportunities could be adversely affected.
We have 120 warehouse-format stores and one small-format standalone design center located throughout the United States as of December 26, 2019. We plan to open 24 warehouse-format stores during fiscal 2020 and to increase the number of new stores that we open during each of the next several years thereafter. This growth strategy and the investment associated with the development of each new store may cause our operating results to fluctuate and be unpredictable or decrease our profits. We cannot ensure that store locations will be available to us, or that they will be available on terms acceptable to us. If additional retail store locations are unavailable on acceptable terms, we may not be able to carry out a significant part of our growth strategy or our new stores’ profitability may be lower. Our future operating results and ability to grow will depend on various other factors, including our ability to:
● | successfully select new markets and store locations; |
● | negotiate leases on acceptable terms; |
20
● | attract, train and retain highly qualified managers and staff; |
● | maintain our reputation of providing quality, safe and compliant products; and |
● | manage store opening costs. |
In addition, consumers in new markets may be less familiar with our brand, and we may need to increase brand awareness in such markets through additional investments in advertising or high cost locations with more prominent visibility. Stores opened in new markets may have higher construction, occupancy or operating costs, or may have lower net sales, than stores opened in the past. In addition, laws or regulations in these new markets may make opening new stores more difficult or cause unexpected delays. Newly opened stores may not succeed or may reach profitability more slowly than we expect, and the ramp-up to profitability may become longer in the future as we enter more markets and add stores to markets where we already have a presence. Future markets and stores may not be successful and, even if they are successful, our comparable store sales may not increase at historical rates. To the extent that we are not able to overcome these various challenges, our operating results and future growth opportunities could be adversely affected.
Increased competition could cause price declines, decrease demand for our products and decrease our market share.
We operate in the hard surface flooring industry, which is highly fragmented and competitive. We face competition from large home improvement centers, national and regional specialty flooring chains, Internet-based companies and independent flooring retailers. Among other things, we compete on the basis of breadth of product assortment, low prices, and the in-store availability of the products we offer in project-ready quantities, as well as the quality of our products and customer service. As we expand into new and unfamiliar markets, we may experience different competitive conditions than in the past.
Some of our competitors are organizations that are larger, are better capitalized, have existed longer, have product offerings that extend beyond hard surface flooring and related accessories and have a more established market presence with substantially greater financial, marketing, personnel and other resources than we have. In addition, while the hard surface flooring category has a relatively low threat of new internet-only entrants due to the nature of the product, the growth opportunities presented by e-commerce could outweigh these challenges and result in increased competition. Competitors may forecast market developments more accurately than we do, offer similar products at a lower cost or adapt more quickly to new trends and technologies or evolving customer requirements than we do. Further, because the barriers to entry into the hard surface flooring industry are relatively low, manufacturers and suppliers of flooring and related products, including those whose products we currently sell, could enter the market and start directly competing with us. Intense competitive pressures from any of our present or future competitors could cause price declines, decrease demand for our products and decrease our market share. Also, if we continue to grow and become more well-known, other companies may change their strategies to present new competitive challenges. Moreover, in the future, changes in consumer preferences may cause hard surface flooring to become less popular than other types of floor coverings. Such a change in consumer preferences could lead to decreased demand for our products.
All of these factors may harm us and adversely affect our net sales, market share, and operating results.
U.S. policies related to global trade and tariffs, including with respect to antidumping and countervailing duties, could adversely affect our business, financial condition and results of operations.
The current domestic and international political environment, including existing and potential changes to U.S. policies related to global trade and tariffs, have resulted in uncertainty surrounding the future state of the global economy. In particular, the ongoing trade dispute between the U.S. and China has resulted in the U.S. imposing tariffs of 25% on many products from China. Even though these tariffs were reduced for certain “click” vinyl and engineered products in November 2019, they are scheduled to increase back up to 25% on August 8, 2020 if no further action is taken, and any such development could adversely affect us. Historically, approximately half of the products we sell were imported from China, the majority of which are impacted by these tariffs. In the fourth quarter of fiscal 2019, we sourced approximately 35% of our products from China. Any further expansion in the types or levels of tariffs implemented has the potential to negatively impact our business, financial condition and results of operations. Additionally, there is a risk that the U.S. tariffs on imports are met with tariffs on U.S. produced exports and that a further trade conflict could ensue, which has the potential to significantly impact global trade and economic conditions. Potential costs and any attendant impact
21
on pricing arising from these tariffs and any further expansion in the types or levels of tariffs implemented could require us to modify our current business practices and could adversely affect our business, financial condition, and results of operations.
Any disruption in our distribution capabilities or our related planning and control processes may adversely affect our business, financial condition, and operating results.
Our success is highly dependent on our planning and distribution infrastructure, which includes the ordering, transportation, and distribution of products to our stores and the ability of suppliers to meet distribution requirements. We also need to ensure that we continue to identify and improve our processes and supply chain and that our distribution infrastructure and supply chain keep pace with our anticipated growth and increased number of stores. The cost of these enhanced processes could be significant and any failure to maintain, grow, or improve them could adversely affect our business, financial condition, and operating results. Due to our rapid expansion, we have had to significantly increase the size of our distribution centers. Additionally, we opened a new 1.5 million square foot distribution center in Maryland in the fourth quarter of fiscal 2019. Based on our growth intentions, we plan to add additional distribution centers or increase the size of our existing distribution centers in the future. Increasing the size of our distribution centers may decrease the efficiency of our distribution costs.
We manage our four distribution centers internally rather than rely on independent third-party logistics providers. If we are not able to manage our distribution centers successfully or at a lower cost than with third-party logistics providers, it could adversely affect our business, financial condition, and operating results. We opened a new distribution center in Maryland in fiscal 2019. As we continue to add distribution centers, we may incur unexpected costs, and our ability to distribute our products may be adversely affected. Any disruption in the transition to or operation of our distribution centers could have an adverse impact on our business, financial condition, and operating results. In addition, our long-term plan contemplates the ability to sublet a portion of our previously occupied distribution centers. Any failure to do so on favorable terms could have a negative impact on our financial condition, and operating results.
Our success is also dependent on our ability to provide timely delivery to our customers. Our business could also be adversely affected if fuel prices increase or there are delays in product shipments due to freight difficulties, inclement weather, strikes by our employees or employees of third-parties involved in our supply chain, or other difficulties. If we are unable to deliver products to our customers on a timely basis, they may decide to purchase products from our competitors instead of from us, which would adversely affect our business, financial condition, and operating results.
Our operating results may be adversely affected by fluctuations in material and energy costs beyond our control.
Our operating results may be affected by the wholesale prices of hard surface flooring products, setting and installation materials, and the related accessories that we sell. These prices may fluctuate based on a number of factors beyond our control, including the price of raw materials used in the manufacture of hard surface flooring, energy costs, changes in supply and demand, concerns about inflation, general economic conditions, labor costs, competition, import duties, tariffs, currency exchange rates, government regulation, the impact of natural disasters (including those due to the effects of climate change), duty and other import costs. In particular, energy costs have fluctuated dramatically in the past and may fluctuate in the future. These fluctuations may result in an increase in our transportation costs for distribution from the manufacturer to our distribution centers and from our distribution centers to our retail stores, utility costs for our distribution centers and retail stores, and overall costs to purchase products from our suppliers.
We may not be able to adjust the prices of our products, especially in the short-term, to recover these cost increases, and a continual rise in such costs could adversely affect consumer spending and demand for our products and increase our operating costs, both of which could adversely affect our business, financial condition and operating results.
Our future success is dependent on our ability to execute our business strategy effectively and deliver value to our customers.
We believe our future success will depend on our ability to execute our business strategy effectively and deliver value to our customers. We believe that our breadth of product assortment across a variety of hard surface flooring categories, low prices, and in-store availability of the products we offer in project-ready quantities, as well as the quality of our products and customer service, are among the key competitive advantages and important elements of our total value proposition. If we are unsuccessful in staying competitive with our current value proposition, the demand for our products would decrease, and customers may decide to purchase
22
products from our competitors instead of us. If this were to occur, our net sales, market share, and operating results would be adversely affected.
Our operating results may be adversely affected if we are not successful in managing our inventory or in implementing a new demand forecasting and inventory replenishment system.
We currently maintain a high level of inventory consisting of on average approximately 3,800 SKUs per store and an average inventory per store of approximately $2.5 million at cost in order to have a broad assortment of products across a wide variety of hard surface flooring categories in project-ready quantities. We also carry an additional $187.4 million of inventory outside our stores, primarily at our distribution centers, as of the end of fiscal 2019. The investment associated with this high level of inventory is substantial, and efficient inventory management is a key component of our business success and profitability. If we fail to adequately project the amount or mix of our inventory, we may miss sales opportunities or have to take unanticipated markdowns or hold additional clearance events to dispose of excess inventory, which will adversely affect our operating results.
In the past, we have incurred costs associated with inventory markdowns and obsolescence. Due to the likelihood that we will continue to incur such costs in the future, we generally include an allowance for such costs in our projections. However, the costs that we actually incur may be substantially higher than our estimate and adversely affect our operating results.
In addition, in fiscal 2020, we expect to implement a new demand forecasting and inventory replenishment system. If we are unsuccessful in implementing it, our operating results may be adversely affected. We continue to focus on ways to reduce these risks, but we cannot assure you that we will be successful in our inventory management.
Our operating results may be adversely affected by inventory shrinkage and damage.
We are subject to the risk of inventory shrinkage and damage, including the damage or destruction of our inventory by natural disasters or other causes. We have experienced charges in the past, and we cannot assure you that the measures we are taking will effectively address the problem of inventory shrinkage and damage in the future. Although some level of inventory shrinkage and damage is an unavoidable cost of doing business, we could experience higher-than-normal rates of inventory shrinkage and damage or incur increased security and other costs to combat inventory theft and damage. If we are not successful in managing our inventory balances, our operating results may be adversely affected.
If we are unable to enter into leases for additional stores on acceptable terms or renew or replace our current store leases, or if one or more of our current leases is terminated prior to expiration of its stated term, and we cannot find suitable alternate locations, our growth and profitability could be adversely affected.
We currently lease all of our store locations and our store support center. Our growth strategy largely depends on our ability to identify and open future store locations, which can be difficult because our stores generally require at least 50,000 square feet of floor space. Our ability to negotiate acceptable lease terms for these store locations, to re-negotiate acceptable terms on expiring leases or to negotiate acceptable terms for suitable alternate locations could depend on conditions in the real estate market, competition for desirable properties, our relationships with current and prospective landlords, or on other factors that are not within our control. We also intend to purchase the real property for certain locations, and such strategy may not be successful. Any or all of these factors and conditions could adversely affect our growth and profitability.
Our net sales growth could be adversely affected if comparable store sales growth is less than we expect.
While future net sales growth will depend substantially on our plans for new store openings, our comparable store sales growth is a significant driver of our net sales, profitability, cash flow, and overall business results. Because numerous factors affect our comparable store sales growth, including, among others, economic conditions, the retail sales environment, the home improvement spending environment, housing turnover, housing appreciation, interest rates, the hard surface flooring industry and the impact of competition, the ability of our customers to obtain credit, changes in our product mix, the in-stock availability of products that are in demand, changes in staffing at our stores, cannibalization resulting from the opening of new stores in existing markets, greater cannibalization than we modeled for new stores, lower than expected ramp-up in new store net sales, changes in advertising and other operating costs, weather conditions, retail trends, and our overall ability to execute our business strategy and planned growth
23
effectively, it is possible that we will not achieve our targeted comparable store sales growth or that the change in comparable store sales could be negative. If this were to happen, it is likely that overall net sales growth would be adversely affected.
If we fail to identify and maintain relationships with a sufficient number of suppliers, our ability to obtain products that meet our high quality standards at attractive prices could be adversely affected.
We purchase flooring and other products directly from suppliers located around the world. We do not have long-term contractual supply agreements with our suppliers that obligate them to supply us with products exclusively or at specified quantities or prices. As a result, our current suppliers may decide to sell products to our competitors and may not continue selling products to us. In order to retain the competitive advantage that we believe results from these relationships, we need to continue to identify, develop and maintain relationships with qualified suppliers that can satisfy our high standards for quality and safety and our requirements for delivery of flooring and other products in a timely and efficient manner at attractive prices. The need to develop new relationships will be particularly important as we seek to expand our operations and enhance our product offerings in the future. The loss of one or more of our existing suppliers or our inability to develop relationships with new suppliers could reduce our competitiveness, slow our plans for further expansion and cause our net sales and operating results to be adversely affected.
We will require significant capital to fund our expanding business, which may not be available to us on satisfactory terms or at all. If we are unable to maintain sufficient levels of cash flow or if we do not have sufficient availability under the ABL Facility, we may not meet our growth expectations or we may require additional financing, which could adversely affect our financial health and impose covenants that limit our business activities.
We plan to continue investing for growth, including opening new stores, remodeling existing stores, adding staff, adding distribution center capacity and upgrading our information technology systems and other infrastructure. These investments will require significant capital, which we plan on funding with cash flow from operations and borrowings under the ABL Facility (as defined below).
If our business does not generate sufficient cash flow from operations to fund these activities or if these investments do not yield cash flows in line with past performance or our expectations, we may need additional equity or debt financing. If such financing is not available to us, or is not available on satisfactory terms, our ability to operate and expand our business or respond to competitive pressures would be curtailed, and we may need to delay, limit or eliminate planned store openings or operations or other elements of our growth strategy. If we raise additional capital by issuing equity securities or securities convertible into equity securities, our stockholders’ ownership would be diluted.
We depend on a number of suppliers, and any failure by any of them to supply us with quality products on attractive terms and prices may adversely affect our business, financial condition and operating results.
We depend on our suppliers to deliver quality products to us on a timely basis at attractive prices. Additionally, we source the products that we sell from over 225 domestic and international suppliers. Although we purchase from a diverse supplier base, purchases from our largest supplier, which is located in China, accounted for approximately 15% of our net sales in fiscal 2019. No other singular vendor supplied products representing more than 7% of net sales in fiscal 2019. If we are unable to acquire desired merchandise in sufficient quantities on terms acceptable to us, or if we experience a change in business relationship with any of our major suppliers, it could impair our relationship with our customers, impair our ability to attract new customers, reduce our competitiveness, and adversely affect our business, financial condition and operating results.
Changes in tax laws, trade policies and regulations or in our operations and newly enacted laws or regulations may impact our effective tax rate or may adversely affect our business, financial condition and operating results.
Changes in tax laws in any of the multiple jurisdictions in which we operate, or adverse outcomes from tax audits that we may be subject to in any of the jurisdictions in which we operate, could result in an unfavorable change in our effective tax rate, which could adversely affect our business, financial condition and operating results.
Developments in tax policy or trade relations could have a material adverse effect on our business, results of operations and liquidity. If there are any adverse changes in tax laws or trade policies that result in an increase in our costs, we may not be able to
24
adjust the prices of our products, especially in the short-term, to recover such costs, and a rise in such costs could adversely affect our business, financial condition and operating results.
The failure of our suppliers to adhere to the quality standards that we set for our products could lead to investigations, litigation, write-offs, recalls or boycotts of our products, which could damage our reputation and our brand, increase our costs, and otherwise adversely affect our business.
We do not control the operations of our suppliers. Although we conduct initial due diligence prior to engaging our suppliers and require our suppliers to certify compliance with applicable laws and regulations, we cannot guarantee that our suppliers will comply with applicable laws and regulations or operate in a legal, ethical and responsible manner. Additionally, it is possible that we may not be able to identify noncompliance by our suppliers notwithstanding these precautionary measures. Violation of applicable laws and regulations by our suppliers or their failure to operate in a legal, ethical or responsible manner, could expose us to legal risks, cause us to violate laws and regulations and reduce demand for our products if, as a result of such violation or failure, we attract negative publicity. In addition, the failure of our suppliers to adhere to the quality standards that we set for our products could lead to government investigations, litigation, write-offs and recalls, which could damage our reputation and our brand, increase our costs, and otherwise adversely affect our business.
We procure the majority of our products from suppliers located outside of the United States, and as a result, we are subject to risks associated with obtaining products from abroad that could adversely affect our business, financial condition and results of operations.
We procure the majority of our products from suppliers located outside of the United States. As a result, we are subject to risks associated with obtaining products from abroad, including:
● | the imposition of new or different duties (including antidumping and countervailing duties), tariffs, taxes and/or other charges on exports or imports, including as a result of errors in the classification of products upon entry or changes in the interpretation or application of rates or regulations relating to the import or export of our products; |
● | political unrest, acts of war, terrorism and economic instability resulting in the disruption of trade from foreign countries where our products originate; |
● | disruption due to the public health crises such as the coronavirus; |
● | currency exchange fluctuations; |
● | the imposition of new or more stringent laws and regulations, including those relating to environmental, health and safety matters and climate change issues, labor conditions, quality and safety standards, trade restrictions, and restrictions on funds transfers; |
● | the risk that one or more of our suppliers will not adhere to applicable legal requirements, including fair labor standards, the prohibition on child labor, environmental, product safety or manufacturing safety standards, anti-bribery and anti-kickback laws such as the Foreign Corrupt Practices Act (the “FCPA”) and sourcing laws such as the Lacey Act; |
● | disruptions or delays in production, shipments, delivery or processing through ports of entry (including those resulting from strikes, lockouts, work-stoppages or slowdowns, or other forms of labor unrest); |
● | changes in local economic conditions in countries where our suppliers are located; and |
● | differences in product standards, acceptable business practice and legal environments. |
Additionally, we import approximately 45% of the products we sell from China. The Chinese government has in the past imposed restrictions on manufacturing facilities, including a shut-down of transportation of materials and power plants to reduce air pollution. If, in the future, restrictions are imposed that include our operations, our suppliers’ ability to supply current or new orders would be significantly impacted. In addition, China has been impacted by the coronavirus, which, along with other public health crises, could impact our ability to obtain products in a timely manner. These and other factors beyond our control could disrupt the
25
ability of our suppliers to ship certain products to us cost-effectively or at all, expose us to significant operational and legal risk and negatively affect our reputation, any of which could adversely affect our business, financial condition and results of operations.
Our ability to offer compelling products, particularly products made of more exotic species or unique stone, depends on the continued availability of sufficient suitable natural products.
Our business strategy depends on offering a wide assortment of compelling products to our customers. We sell, among other things, flooring made from various wood species and natural stone from quarries throughout the world. Our ability to obtain an adequate volume and quality of hard-to-find products depends on our suppliers’ ability to furnish those products, which, in turn, could be affected by many things, including events such as forest fires, insect infestation, tree diseases, prolonged drought, other adverse weather and climate conditions and the exhaustion of stone quarries. Government regulations relating to forest management practices also affect our suppliers’ ability to harvest or export timber and other products, and changes to regulations and forest management policies, or the implementation of new laws or regulations, could impede their ability to do so. If our suppliers cannot deliver sufficient products, and we cannot find replacement suppliers, our net sales and operating results may be adversely affected.
Our business exposes us to personal injury, product liability and warranty claims and related governmental investigations, which could result in negative publicity, harm our brand and adversely affect our business, financial condition and operating results.
Our stores and distribution centers are warehouse environments that involve the operation of forklifts and other machinery and the storage and movement of heavy merchandise, all of which are activities that have the inherent danger of injury or death to employees or customers despite safety precautions, training and compliance with federal, state and local health and safety regulations. While we have insurance coverage in place in addition to policies and procedures designed to minimize these risks, we may nonetheless be unable to avoid material liabilities for an injury or death arising out of these activities.
In addition, we face an inherent risk of exposure to product liability or warranty claims or governmental investigations in the event that the use of our products is alleged to have resulted in economic loss, personal injury or property damage or violated environmental or other laws. If any of our products proves to be defective or otherwise in violation of applicable law, we may be required to recall or redesign such products. Further, in such instances, we may be subject to legal action. We generally seek contractual indemnification from our suppliers. However, such contractual indemnification may not be enforceable against the supplier, particularly because many of our suppliers are located outside of the United States. Any personal injury, product liability or warranty claim made against us, whether or not it has merit, or governmental investigation related to our products, could be time-consuming and costly to defend or respond to, may not be covered by insurance carried by us, could result in negative publicity, could harm our brand and could adversely affect our business, financial condition and operating results. In addition, any negative publicity involving our suppliers, employees, and other parties who are not within our control could adversely affect us.
Unfavorable allegations, government investigations and legal actions surrounding our products and us could harm our reputation, impair our ability to grow or sustain our business, and adversely affect our business, financial condition and operating results.
We rely on our reputation for offering great value, superior service and a broad assortment of high-quality, safe products. If we become subject to unfavorable allegations, government investigations or legal actions involving our products or us, such circumstances could harm our reputation and our brand and adversely affect our business, financial condition and operating results. If this negative impact is significant, our ability to grow or sustain our business could be jeopardized.
For instance, we have previously settled claims related to unfavorable allegations surrounding the product quality of our laminates sourced from China. Although such claims have been resolved, we cannot predict whether we will face additional lawsuits that are not covered by the settlement or the release. If additional lawsuits are filed, we could incur significant costs, be liable to damages, be subject to fines, penalties, injunctive relief, criminal charges or other legal risks, which could reduce demand for our products and adversely affect our business, financial condition and operating results.
Negative publicity surrounding product matters, including publicity about other retailers, may harm our reputation and affect the demand for our products. In addition, if more stringent laws or regulations are adopted in the future, we may have difficulty complying with the new requirements imposed by such laws and regulations, and in turn, our business, financial condition, and operating results could be adversely affected. Moreover, regardless of whether any such changes are adopted, we may become subject to claims or governmental investigations alleging violations of applicable laws and regulations. Any such matter may subject us to
26
fines, penalties, injunctions, litigation and/or potential criminal violations. Any one of these results could negatively affect our business, financial condition, and operating results and impair our ability to grow or sustain our business.
If we violate or are alleged to have violated environmental, health and safety laws and regulations, we could incur significant costs and other negative effects that could reduce demand for our products and adversely affect our business, financial condition and operating results.
Certain portions of our operations are subject to laws and regulations governing the environmental protection of natural resources and health and safety, including formaldehyde emissions and the use, storage, handling, generation, transportation, treatment, emission, release, discharge and disposal of certain hazardous materials and wastes. In addition, certain of our products are subject to laws and regulations relating to the importation, exportation, acquisition or sale of certain plants and plant products, including those that have been illegally harvested, and the emissions of hazardous materials.
We operate our business in accordance with standards and procedures designed to comply with the applicable laws and regulations in these areas and work closely with our suppliers in order to comply with such laws and regulations. If we violate or are alleged to have violated these laws, we could incur significant costs, be liable for damages, experience delays in shipments of our products, be subject to fines, penalties, criminal charges or other legal risks, or suffer reputational harm, any of which could reduce demand for our products and adversely affect our business, financial condition and operating results. In addition, there can be no assurance that such laws or regulations will not become more stringent in the future or that we will not incur additional costs in the future in order to comply with such laws or regulations.
We are engaged in various legal actions, claims and proceedings arising in the ordinary course of business and, while we cannot predict the outcomes of such proceedings and other contingencies with certainty, this litigation and any potential future litigation could have an adverse impact on us.
We are engaged in various legal actions, claims and proceedings arising in the ordinary course of business, including claims related to breach of contract, product liabilities, intellectual property matters and employment related matters resulting from our business activities. As with most actions such as these, an estimate of any possible and/or ultimate liability cannot always be determined. Regardless of the outcome, litigation can have an adverse impact on us because of defense and settlement costs, diversion of management resources, and other factors. Additionally, we cannot guarantee that we will not become engaged in additional legal actions, claims, proceedings or governmental investigations in the future. Any such action could result in negative publicity, harm to our reputation and adversely affect our business, financial condition and operating results.
We, and some of our officers and directors and stockholders, have been named as parties in a purported securities class action lawsuit, the material allegations of which we deny. While we intend to defend ourselves vigorously, litigation can result in substantial damages and costs, divert management’s time and attention from our business and could adversely affect our results of operations, financial condition and stock price.
In May 2019, an alleged stockholder of the Company filed a putative class action lawsuit against the Company and certain of our officers, directors, and stockholders alleging certain violations of federal securities laws based on, among other things, purported materially false and misleading statements and omissions allegedly made by the Company. See the information under the “Litigation” caption in Note 9, “Commitments and Contingencies” to our consolidated financial statements included in this Annual Report for more information. We deny the material allegations in the lawsuit and intend to defend ourselves vigorously. No assurances can be given that the results of these matters will be favorable to us. In addition, we may be the target of securities-related litigation in the future, both related and unrelated to the existing class action lawsuit. Litigation can divert our management’s attention and resources, result in substantial costs, and have an adverse effect on our business, results of operations, financial condition and stock price.
We maintain director and officer insurance that we regard as reasonably adequate to protect us from potential claims; however, we are responsible for meeting certain deductibles under such policies, and, in any event, we cannot assure you that the insurance coverage will adequately protect us from all claims made against us. Further, as a result of the pending litigation the costs of insurance may increase, and the availability of coverage may decrease. As a result, we may not be able to maintain our current levels of insurance at a reasonable cost, or at all, which might make it more difficult to attract qualified candidates to serve as executive officers or directors. There also may be adverse publicity associated with litigation that could negatively affect customer perception of
27
our business and materially damage our reputation and the value of our brand regardless of whether the material allegations are valid or whether we are ultimately found liable.
Federal, state or local laws and regulations, or our failure to comply with such laws and regulations, could increase our expenses, restrict our ability to conduct our business and expose us to legal risks.
We are subject to a wide range of general and industry-specific laws and regulations imposed by federal, state and local authorities in the countries in which we operate including those related to customs, foreign operations (such as the FCPA), truth-in-advertising, consumer protection (such as the California Consumer Privacy Act and Telephone Consumer Protection Act), privacy, product safety (such as the Formaldehyde Standards in Composite Wood Products Act), the environment (such as the Lacey Act), intellectual property infringement, zoning and occupancy matters as well as the operation of retail stores and distribution facilities. In addition, various federal and state laws govern our relationship with, and other matters pertaining to, our employees, including wage and hour laws, laws governing independent contractor classifications, requirements to provide meal and rest periods or other benefits, family leave mandates, requirements regarding working conditions and accommodations to certain employees, citizenship or work authorization and related requirements, insurance and workers’ compensation rules and anti-discrimination laws. In recent years, we and other parties in the flooring industry have been or currently are parties to litigation involving claims that allege violations of the foregoing laws, including claims related to product safety and patent claims. In addition, there has been an increase in the number of wage and hour class action claims that allege misclassification of overtime eligible workers and/or failure to pay overtime-eligible workers for all hours worked, particularly in the retail industry, and we are currently defending one such claim. Although we believe that we have complied with these laws and regulations, there is nevertheless a risk that we will become subject to claims that allege we have failed to do so. Any claim that alleges a failure by us to comply with any of the foregoing laws and regulations may subject us to fines, penalties, injunctions, litigation and/or potential criminal violations, which could adversely affect our reputation, business, financial condition and operating results.
Certain of our products may require us to spend significant time and resources in order to comply with applicable advertising, labeling, importation, exportation, environmental, health and safety laws and regulations because if we violate these laws or regulations, we could experience delays in shipments of our goods, be subject to fines or penalties, be liable for costs and damages or suffer reputational harm, any of which could reduce demand for our merchandise and adversely affect our business, financial condition and operating results.
Any changes to the foregoing laws or regulations or any new laws or regulations that are passed or go into effect may make it more difficult for us to operate our business and in turn adversely affect our operating results.
We may also be subject to audits by various taxing authorities. Similarly, changes in tax laws in any of the multiple jurisdictions in which we operate, or adverse outcomes from tax audits that we may be subject to in any of the jurisdictions in which we operate, could result in an unfavorable change in our effective tax rate, which could adversely affect our business, financial condition and operating results. In addition, given the nature of our business, certain of our sales are exempt from state sales taxes. If we are audited and fail to maintain proper documentation, any adjustments resulting from such audits could increase our tax liability, including any interest or penalties.
Labor activities could cause labor relations difficulties for us.
Currently none of our employees are represented by a union; however, our employees have the right at any time to form or affiliate with a union. As we continue to grow, enter different regions and operate distribution centers, unions may attempt to organize all or part of our employee base at certain stores or distribution centers within certain regions. We cannot predict the adverse effects that any future organizational activities will have on our business, financial condition and operating results. If we were to become subject to work stoppages, we could experience disruption in our operations and increases in our labor costs, either of which could adversely affect our business, financial condition and operating results.
28
If our efforts to protect the privacy and security of information related to our customers, us, our employees, our suppliers and other third parties are not successful, we could become subject to litigation, investigations, liability and negative publicity that could significantly harm our reputation and relationships with our customers and adversely affect our business, financial condition and operating results.
Our business, like that of most retailers, involves the receipt, storage and transmission of customers’ personal information, consumer preferences and payment card data, as well as other confidential information related to us, our employees, our suppliers and other third parties, some of which is entrusted to third-party service providers and vendors that provide us with technology, systems and services that we use in connection with the receipt, storage and transmission of such information. Techniques used for cyber attacks designed to gain unauthorized access to these types of sensitive information by breaching or sabotaging critical systems of large organizations are constantly evolving and generally are difficult to recognize and react to effectively. We may be unable to anticipate these techniques or to implement adequate preventive or reactive security measures. Notwithstanding widespread recognition of the cyber attack threat and improved data protection methods, high profile electronic security breaches leading to unauthorized release of sensitive information have occurred in recent years with increasing frequency at a number of major U.S. companies, including several large retailers, notwithstanding widespread recognition of the cyber attack threat and improved data protection methods.
Despite our security measures and those of third parties with whom we do business, such as our banks, merchant card processing and other technology vendors, our respective systems and facilities may be vulnerable to criminal cyber-attacks or security incidents due to malfeasance, intentional or inadvertent security breaches by employees, or other vulnerabilities such as defects in design or manufacture. Unauthorized parties may also attempt to gain access to our systems or facilities through fraud, trickery or other forms of deception targeted at our customers, employees, suppliers and service providers. Any such incidents could compromise our networks and the information stored there could be accessed, misused, publicly disclosed, lost or stolen.
As noted above, the techniques used by criminals to obtain unauthorized access to sensitive data change frequently and often are not recognized until launched against a target; accordingly, we may be unable to anticipate these techniques or implement adequate preventative measures. In addition, advances in computer capabilities, new technological discoveries or other developments may also compromise or result in the obsolescence of the technology used to protect sensitive information. An actual or anticipated attack or security incident may cause us to incur additional costs, including costs related to diverting or deploying personnel, implementing preventative measures, training employees and engaging third-party experts and consultants. Further, any security breach incident could expose us to risks of data loss, regulatory and law enforcement investigations, litigation and liability and could seriously disrupt our operations and any resulting negative publicity could significantly harm our reputation and relationships with our customers and adversely affect our business, financial condition and operating results.
A material disruption in our information systems, including our website and call center, could adversely affect our business or operating results and lead to reduced net sales and reputational damage.
We rely on our information systems to process transactions, summarize our results of operations and manage our business. In particular, our website and our call center are important parts of our integrated connected customer strategy and customers use these systems as information sources on the range of products available to them and as a way to order our products. Therefore, the reliability and capacity of our information systems is critical to our operations and the implementation of our growth initiatives. However, our information systems are subject to damage or interruption from planned upgrades in technology interfaces, power outages, computer and telecommunications failures, computer viruses, cyber-attacks or other security breaches and catastrophic events such as fires, floods, earthquakes, tornadoes, hurricanes, acts of war or terrorism and usage errors by our employees. If our information systems are damaged or cease to function properly, we may have to make a significant investment to fix or replace them, and we may suffer losses of critical data and/or interruptions or delays in our operations. In addition, to keep pace with changing technology, we must continuously implement new information technology systems as well as enhance our existing systems. Moreover, the successful execution of some of our growth strategies, in particular the expansion of our connected customer and online capabilities, is dependent on the design and implementation of new systems and technologies and/or the enhancement of existing systems. Any material disruption in our information systems, or delays or difficulties in implementing or integrating new systems or enhancing or expanding current systems, could have an adverse effect on our business (in particular our call center and online operations) and our operating results and could lead to reduced net sales and reputational damage.
29
We previously identified a material weakness in our internal control over financial reporting, which has now been remediated. Any failure to maintain effective internal control over financial reporting could result in material misstatements in our financial statements and cause investors to lose confidence in our reported financial information, which in turn could cause the trading price of our securities to decline.
We reported in our Annual Report on Form 10-K as of December 27, 2018, a material weakness in our internal controls related to ineffective information technology general controls (“ITGCs”) in the areas of user access and program change-management over certain information technology systems that support the Company’s financial reporting processes. During 2019, we completed the remediation measures related to the material weakness and concluded that our internal control over financial reporting was effective as of December 26, 2019. Completion of remediation does not provide assurance that our remediation or other controls will continue to operate properly.
If we are unable to maintain effective internal control over financial reporting or disclosure controls and procedures, our ability to record, process and report financial information accurately, and to prepare financial statements within required time periods, could be adversely affected. This could subject us to litigation or investigations requiring management resources and payment of legal and other expenses and could result in negative publicity, harm to our reputation and adversely affect our business, financial condition and operating results or adversely affect the market price of our common stock.
We are subject to payments-related risks that could increase our operating costs, expose us to fraud, subject us to potential liability and potentially disrupt our business.
We accept payments using a variety of methods, including credit cards, debit cards, gift cards and physical bank checks. These payment options subject us to many compliance requirements, including, but not limited to, compliance with the Payment Card Industry Data Security Standards, which represents a common set of industry tools and measurements to help ensure the safe handling of sensitive information, and compliance with contracts with our third-party processors. These payment options also subject us to potential fraud by criminal elements seeking to discover and take advantage of security vulnerabilities that may exist in some of these payment systems. For certain payment methods, including credit cards and debit cards, we pay interchange and other fees, which may increase over time and raise our operating costs and lower profitability. We rely on third parties to provide payment processing services, including the processing of credit cards, debit cards and gift cards, and it could disrupt or harm our business if these companies become unwilling or unable to provide these services to us, experience a data security incident or fail to comply with applicable rules and industry standards. We are also subject to payment card association operating rules, including data security rules, certification requirements, and rules governing electronic funds transfers, which could change or be reinterpreted to make it difficult or impossible for us to comply. If we fail to comply with these rules or requirements, or if our data security systems or payment card information of our customers are breached or compromised, there is the potential that parties could seek damages from us, we may be liable for card issuing banks’ costs, subject to fines and higher transaction fees, and lose our ability to accept credit cards and debit card payments from our customers, process electronic funds transfers, or facilitate other types of online payments, we could lose the confidence of customers and our business, financial condition, and operating results could be adversely affected. We may also need to expend significant management and financial resources to become or remain compliant with relevant standards and requirements, which could divert resources from other initiatives and adversely affect our business, financial condition and operating results.
Our facilities and systems, as well as those of our suppliers, are vulnerable to natural disasters and other unexpected events, and as a result we may lose merchandise and be unable to effectively deliver it to our stores.
Our retail stores, store support center, and distribution centers, as well as the operations of our suppliers from which we receive goods and services, are vulnerable to damage from earthquakes, tornadoes, hurricanes, fires, floods, and similar events. If any of these events result in damage to our facilities, systems or equipment, or those of our suppliers, they could adversely affect our ability to stock our stores and deliver products to our customers, and could adversely affect our net sales and operating results. In addition, we may incur costs in repairing any damage beyond our applicable insurance coverage. In particular, any disruption to any of our distribution centers could have a material adverse impact on our business.
30
Our success depends substantially upon the continued retention of our key personnel, which we consider to be our executive officers.
We believe that our success has depended and continues to depend to a significant extent on the efforts and abilities of our key personnel, which we consider to be our executive officers. We have employment agreements with each of our executive officers. Our failure to retain members of that team could impede our ability to build on the efforts they have undertaken with respect to our business.
We do not maintain “key man” life insurance policies on our key personnel.
We do not have “key man” life insurance policies for any of our key personnel. If we were to obtain “key man” insurance for our key personnel, there can be no assurance that the amounts of such policies would be sufficient to pay losses experienced by us as a result of the loss of any of those personnel.
Our success depends upon our ability to attract, train, and retain highly qualified managers and staff.
Our success depends in part on our ability to attract, hire, train and retain qualified managers and staff. Purchasing hard surface flooring is an infrequent event for BIY and DIY consumers, and the typical consumer in these groups has little knowledge of the range, characteristics and suitability of the products available before starting the purchasing process. Therefore, consumers in the hard surface flooring market expect to have sales associates serving them who are knowledgeable about the entire assortment of products offered by the retailer and the process of choosing and installing hard surface flooring.
Each of our stores is managed by a store manager who has the flexibility (with the support of regional managers) to use his or her knowledge of local market dynamics to customize each store in a way that is most likely to increase net sales and profitability. Our store managers are also expected to anticipate, gauge and quickly respond to changing consumer demands in these markets. Further, it generally takes a substantial amount of time for our store managers to develop the entrepreneurial skills that we expect them to have in order to make our stores successful.
There is a high level of competition for qualified regional managers, store managers and sales associates among home improvement and flooring retailers in local markets, and as a result, we may not succeed in attracting and retaining the personnel we require to conduct our current operations and support our plans for expansion. In addition, we compete with other retail businesses for many of our associates in hourly positions, and we invest significant resources in training and motivating them to maintain a high level of job satisfaction. These positions have historically had high turnover rates, which can lead to increased training and retention costs, particularly in a tight labor market.
If our recruiting and retention efforts are not successful, we may have a shortage of qualified employees in future periods. Any such shortage would decrease our ability to effectively serve our customers. Such a shortage would also likely lead to higher wages for employees and a corresponding reduction in our operating results. In addition, as we expand into new markets, we may find it more difficult to hire, develop, and retain qualified employees and may experience increased labor costs. Any failure by us to attract, train, and retain highly qualified managers and staff could adversely affect our operating results and future growth opportunities, and any increased labor costs due to competition, increased minimum wage, employee benefit costs (including various federal, state, and location actions to increase minimum wages), unionization activity, or other factors would adversely impact our operating expenses.
As we have a high concentration of stores in the southern region of the United States, we are subject to regional risks.
We have a high concentration of stores in the southern region of the United States. If this market suffers an economic downturn or other significant adverse event, our comparable store sales, net sales, profitability and the ability to implement our planned expansion could be adversely affected. Any natural disaster, extended adverse weather or other serious disruption in this market, whether due to fire, tornado, hurricane, or any other calamity, could damage inventory and could result in decreased net sales.
31
Our intellectual property rights are valuable, and any failure to protect them could reduce the value of our products and brand and harm our business.
We regard our intellectual property as having significant value, and our brand is an important factor in the marketing of our products. However, we cannot assure you that the steps we take to protect our trademarks or intellectual property will be adequate to prevent others from copying or using our trademarks or intellectual property without authorization. If our trademarks or intellectual property are copied or used without authorization, the value of our brand, its reputation, our competitive advantages and our goodwill could be harmed.
We may be involved in disputes from time to time relating to our intellectual property and the intellectual property of third parties.
We are and may continue to become parties to disputes from time to time over rights and obligations concerning intellectual property, and we may not prevail in these disputes. Third parties may raise claims against us alleging infringement or violation of the intellectual property of such third-party. Even if we prevail in such disputes, the costs we incur in defending such dispute may be material and costly. Some third-party intellectual property rights may be extremely broad, and it may not be possible for us to conduct our operations in such a way as to avoid violating any such intellectual property rights. Any such intellectual property claim could subject us to costly litigation and impose a significant strain on our financial resources and management personnel regardless of whether such claim has merit. The liability insurance we maintain may not adequately cover potential claims of this type, and we may be required to pay monetary damages or license fees to third parties, which could have a material adverse effect on our business, financial condition and operating results.
We may, from time to time, consider or engage in strategic transactions. Any such strategic transactions would involve risks, which could have an adverse impact on our financial condition and results of operation, and we may not realize the anticipated benefits of these transactions.
From time to time, we consider strategic transactions, including mergers, acquisitions, investments, alliances, and other growth and market expansion strategies, with the expectation that these transactions will result in increases in sales, cost savings, synergies and various other benefits. Assessing the viability and realizing the benefits of these transactions is subject to significant uncertainty. Additionally, in connection with evaluating potential strategic transactions and assets, we may incur significant expenses for the evaluation and due diligence investigation and negotiation of any potential transaction. If we complete an acquisition, we would need to successfully integrate the target company’s products, services, associates and systems into our business operations. Integration can be a complex and time-consuming process, and if the integration is not fully successful or is delayed for a material period of time, we may not achieve the anticipated synergies or benefits of the acquisition. Furthermore, even if a target company is successfully integrated, an acquisition may fail to further our business strategy as anticipated, expose us to increased competition or challenges with respect to our products or services, and expose us to additional liabilities. Any impairment of goodwill or other intangible assets acquired in a strategic transaction may reduce our earnings.
Our ability to control higher health care costs is limited and could adversely affect our business, financial condition and operating results.
With the passage in 2010 of the U.S. Patient Protection and Affordable Care Act (as amended, the “Affordable Care Act”), we are required to provide affordable coverage, as defined in the Affordable Care Act, to all employees, or otherwise be subject to a payment per employee based on the affordability criteria in the Affordable Care Act. Additionally, some states and localities have passed state and local laws mandating the provision of certain levels of health benefits by some employers. These requirements limit our ability to control employee health care costs.
Efforts to modify, repeal or otherwise invalidate all, or certain provisions of, the Affordable Care Act and/or adopt a replacement healthcare reform law may impact our employee healthcare costs. At this time, there is uncertainty concerning whether the Affordable Care Act will be repealed or what requirements will be included in a new law, if enacted. If health care costs rise, we may experience increased operating costs, which may adversely affect our business, financial condition and operating results.
32
We are subject to risks related to corporate social responsibility.
Our business faces increasing public scrutiny related to environmental, social and governance (“ESG”) activities. We risk damage to our brand and reputation if we fail to act responsibly in a number of areas, such as diversity and inclusion, environmental stewardship, support for local communities, corporate governance and transparency and considering ESG factors in our business operations. Adverse incidents could impact the value of our brand, the cost of our operations and relationships with investors, all of which could adversely affect our business and results.
The effectiveness of our advertising strategy is a driver of our future success.
We believe that our growth was in part a result of our successful investment in local advertising. As we enter new markets that often have more expensive advertising rates, we may need to increase our advertising expenses to broaden the reach and frequency of our advertising to increase the recognition of our brand. If our advertisements fail to draw customers in the future, or if the cost of advertising or other marketing materials increases significantly, we could experience declines in our net sales and operating results.
We are a holding company with no business operations of our own and depend on cash flow from our subsidiaries to meet our obligations.
We are a holding company with no business operations of our own or material assets other than the equity of our subsidiaries. All of our operations are conducted by our subsidiaries. As a holding company, we will require dividends and other payments from our subsidiaries to meet cash requirements.
The terms of our $300 million asset-based revolving credit facility (the “ABL Facility”), and our $350 million senior secured term loan facility (the “Term Loan Facility” and together with the ABL Facility, our “Credit Facilities”), restrict our subsidiaries from paying dividends and otherwise transferring cash or other assets to us except in certain limited circumstances. If we become insolvent or there is a liquidation or other reorganization of any of our subsidiaries, our stockholders likely will have no right to proceed against their assets. Creditors of those subsidiaries will be entitled to payment in full from the sale or other disposal of the assets of those subsidiaries before we, as an equity holder, would be entitled to receive any distribution from that sale or disposal. If our subsidiaries are unable to pay dividends or make other payments to us when needed, we will be unable to satisfy our obligations.
We face risks related to our indebtedness.
As of December 26, 2019, the principal amount of our total indebtedness was approximately $142.6 million related to our indebtedness outstanding under the Term Loan Facility. In addition, as of December 26, 2019, we had the ability to access approximately $279.5 million of unused borrowings available under the ABL Facility without violating any covenants thereunder and had approximately $20.5 million in outstanding letters of credit thereunder.
Our indebtedness, combined with our lease and other financial obligations and contractual commitments, could adversely affect our business, financial condition and operating results by:
● | making it more difficult for us to satisfy our obligations with respect to our indebtedness, including restrictive covenants and borrowing conditions, which may lead to an event of default under the agreements governing our debt; |
● | making us more vulnerable to adverse changes in general economic, industry and competitive conditions and government regulation; |
● | requiring us to dedicate a substantial portion of our cash flow from operations to payments on our indebtedness, thereby reducing the availability of cash flows to fund current operations and future growth; |
● | exposing us to the risk of increased interest rates as our borrowings under our Credit Facilities are at variable rates; |
● | restricting us from making strategic acquisitions or causing us to make non-strategic divestitures; |
33
● | requiring us to comply with financial and operational covenants, restricting us, among other things, from placing liens on our assets, making investments, incurring debt, making payments to our equity or debt holders and engaging in transactions with affiliates; |
● | limiting our ability to borrow additional amounts for working capital, capital expenditures, acquisitions, debt service requirements, execution of our business and growth strategies or other purposes; and |
● | limiting our ability to obtain credit from our suppliers and other financing sources on acceptable terms or at all. |
We may also incur substantial additional indebtedness in the future, subject to the restrictions contained in our Credit Facilities. If such new indebtedness is in an amount greater than our current debt levels, the related risks that we now face could intensify. However, we cannot give assurance that any such additional financing will be available to us on acceptable terms or at all. Moreover, for taxable years beginning after December 31, 2017, the deductibility of net business interest expenses on our indebtedness for each taxable year could be limited under the Tax Cuts and Jobs Act (the “Act”).
Additionally, in July 2017, the Financial Conduct Authority (the authority that regulates LIBOR) announced it intends to stop compelling banks to submit rates for the calculation of LIBOR after 2021. The Alternative Reference Rates Committee (“ARRC”) has proposed a paced market transition plan to SOFR from USD-LIBOR, but it is unclear whether new methods of calculating LIBOR will be established such that it continues to exist after 2021, or if alternative rates or benchmarks will be adopted. Changes in the method of calculating LIBOR, or the replacement of LIBOR with an alternative rate or benchmark, may adversely affect interest rates and result in higher borrowing costs. The Company has material debt contracts that are indexed to USD-LIBOR and is currently working on a transition plan. We believe all our material agreements have appropriate language to negotiate a transition to an alternative index rate and are continuing to monitor this activity and evaluate the related risks. However, if LIBOR ceases to exist, we may need to amend or restructure our existing LIBOR-based debt instruments and any related hedging arrangements that extend beyond 2021, which may be difficult, costly and time consuming. We cannot give assurance that our financial condition, and operating results will not be adversely affected.
Significant amounts of cash are required to service our indebtedness and operating lease obligations, and any failure to meet our debt service obligations could adversely affect our business, financial condition and operating results.
Our ability to pay interest on and principal of our debt obligations will primarily depend upon our future operating performance. As a result, prevailing economic conditions and financial, business and other factors, many of which are beyond our control, will affect our ability to make these payments.
If we do not generate sufficient cash flow from operations to satisfy our debt service obligations, we may have to undertake alternative financing plans, such as refinancing or restructuring our indebtedness, selling our assets, reducing or delaying capital investments, or seeking to raise additional capital. Our ability to restructure or refinance our debt will depend on the condition of the capital markets and our financial condition at such time. From time to time, capital markets may experience periods of disruption and instability. For example, between 2008 and 2009, the global capital markets were unstable as evidenced by periodic disruptions in liquidity in the debt capital markets, significant write-offs in the financial services sector, the re-pricing of credit risk in the broadly syndicated credit market and the failure of major financial institutions. Despite actions of the U.S. federal government and foreign governments, these events contributed to worsening general economic conditions that materially and adversely impacted the broader financial and credit markets and reduced the availability of debt and equity capital for the market as a whole. While market conditions have largely recovered from the events of 2008 and 2009, there have been continuing periods of volatility, some lasting longer than others. There can be no assurance these market conditions will not continue or worsen in the future.
Any refinancing of our debt could therefore be at higher interest rates and may require us to comply with more onerous covenants, which could further restrict our business operations. The terms of existing or future debt instruments may restrict us from adopting some of these alternatives. In addition, any failure to make payments of interest and principal on our outstanding indebtedness on a timely basis would likely result in a reduction of our credit rating, which could harm our ability to incur additional indebtedness on acceptable terms. See “Management’s Discussion and Analysis of Financial Condition and Results of Operations—Liquidity and Capital Resources—Our Credit Facilities-” for more information.
34
Our inability to generate sufficient cash flow to satisfy our debt obligations, or to refinance our obligations at all or on acceptable terms, could have an adverse effect on our business, financial condition and operating results.
We cannot assure you that our business will generate sufficient cash flow from operations or that future borrowings will be available to us in amounts sufficient to enable us to make payments on our indebtedness or to fund our operations.
Our debt agreements contain restrictions that may limit our flexibility in operating our business.
We are a holding company, and accordingly, substantially all of our operations are conducted through our subsidiaries. The credit agreements governing our Credit Facilities contain, and any future indebtedness would likely contain, a number of restrictive covenants that impose significant operating and financial restrictions, including restrictions on our ability to engage in acts that may be in our best long-term interests. The credit agreements governing our Credit Facilities include covenants that, among other things, restrict our and our subsidiaries’ ability to:
● | incur additional indebtedness; |
● | create liens; |
● | make investments, loans, or advances; |
● | merge or consolidate; |
● | sell assets, including capital stock of subsidiaries, or make acquisitions; |
● | pay dividends on capital stock or redeem, repurchase or retire capital stock, or make other restricted payments; |
● | enter into transactions with affiliates; |
● | repurchase certain indebtedness; and |
● | exceed a certain total net leverage ratio or, in certain cases, maintain less than a certain fixed charge coverage ratio. |
Based on the foregoing factors, the operating and financial restrictions and covenants in our current debt agreements and any future financing agreements could adversely affect our ability to finance future operations or capital needs or to engage in other business activities.
In addition, a breach of any of the restrictive covenants in our Credit Facilities may constitute an event of default, permitting the lenders to declare all outstanding indebtedness under both our Credit Facilities to be immediately due and payable or to enforce their security interest, which could adversely affect our ability to respond to changes in our business and manage our operations. Upon the occurrence of an event of default under any of the agreements governing our Credit Facilities, the lenders could elect to declare all amounts outstanding to be due and payable and exercise other remedies as set forth in such credit agreements. If any of our indebtedness under either of our Credit Facilities were to be accelerated, there can be no assurance that our assets would be sufficient to repay this indebtedness in full, which could adversely affect our ability to continue to operate as a going concern. See “Management’s Discussion and Analysis of Financial Condition and Results of Operations—Liquidity and Capital Resources—Our Credit Facilities” for more information.
The Company is exposed to credit risk on certain of our receivables and the inability or failure to collect outstanding credit, specifically from our existing customers under our commercial credit program, could result in losses and adversely affect our operating results.
As an added convenience to our customers, we began offering limited credit to our commercial customers, a portion of which is not covered by collateral, third-party bank support, or credit insurance. Our exposure to credit and collectability risk makes us susceptible to potential losses, and our ability to mitigate such risks may be limited, especially if our customers are adversely affected
35
by a market downturn or periods of economic uncertainty. While we monitor individual customer payment capability and maintain adequate reserves to cover our exposure, there can be no assurance that such procedures will be effective in reducing our credit risks.
Our fixed lease obligations could adversely affect our operating results.
We are required to use a significant portion of cash generated by our operations to satisfy our fixed lease obligations, which could adversely affect our ability to obtain future financing to support our growth or other operational investments. We will require substantial cash flows from operations to make our payments under our operating leases, all of which provide for periodic increases in rent. As of December 26, 2019, our minimum annual rental obligations under long-term operating leases for the fiscal years ending December 31, 2020 and December 30, 2021 are approximately $122.3 million and $127.4 million, respectively. If we are not able to make payments under our operating leases, this could trigger defaults under other leases or, in certain circumstances, under our Credit Facilities, which could cause the counterparties or lenders under those agreements to accelerate the obligations due thereunder.
Changes to accounting rules or regulations could adversely affect our operating results.
Our consolidated financial statements are prepared in accordance with accounting principles generally accepted in the United States (“GAAP”). New accounting rules or regulations and changes to existing accounting rules or regulations have occurred and may occur in the future. Future changes to accounting rules or regulations, such as changes to revenue recognition or lease accounting guidance or a requirement to convert to international financial reporting standards, could adversely affect our operating results through increased cost of compliance.
Risks Related to the Ownership of Our Common Stock
Our stock price may be volatile, which could result in a significant loss or impairment of your investment.
On May 2, 2017, we completed our initial public offering (the “IPO”). Since the IPO, the price of our common stock as reported by The New York Stock Exchange (“NYSE”) has ranged from a low closing sales price of $24.00 on December 24, 2018 to a high closing sales price of $57.50 on April 5, 2018. In addition, the trading price of our common stock has been, and may continue to be, subject to wide price fluctuations in response to various factors, many of which are beyond our control, including those described above in “—Risks Related to our Business” and the following:
● | actual or anticipated fluctuations in our quarterly or annual financial results; |
● | the financial guidance we may provide to the public, any changes in such guidance or our failure to meet such guidance; |
● | failure of industry or securities analysts to maintain coverage of us, changes in financial estimates by any industry or securities analysts that follow us or our failure to meet such estimates; |
● | downgrades in our credit ratings or the credit ratings of our competitors; |
● | market factors, including rumors, whether or not correct, involving us or our competitors; |
● | unfavorable market reactions to allegations regarding the safety of products sold by us or our competitors that are similar to products that we sell and costs or negative publicity arising out of any potential litigation and/or government investigations resulting therefrom; |
● | fluctuations in stock market prices and trading volumes of securities of similar companies; |
● | sales or anticipated sales of large blocks of our stock; |
● | short selling of our common stock by investors; |
● | limited “public float” in the hands of a small number of persons whose sales or lack of sales of our common stock could result in positive or negative pricing pressure on the market price for our common stock; |
36
● | additions or departures of key personnel; |
● | announcements of new store openings, commercial relationships, acquisitions, or entry into new markets by us or our competitors; |
● | failure of any of our initiatives, including our growth strategy, to achieve commercial success; |
● | regulatory or political developments; |
● | changes in accounting principles or methodologies; |
● | litigation or governmental investigations; |
● | negative publicity about us in the media and online; and |
● | general financial market conditions or events. |
Furthermore, the stock markets have experienced extreme price and volume fluctuations that have affected and continue to affect the market prices of equity securities of many companies, including ours. These fluctuations sometimes have been unrelated or disproportionate to the operating performance of those companies. These and other factors may cause the market price and demand for our common stock to fluctuate substantially, which may limit or prevent investors from readily selling their shares of common stock and may otherwise adversely affect the price or liquidity of our common stock.
In addition, in the past, when the market price of a stock has been volatile, holders of that stock have sometimes instituted securities class action litigation against the company that issued the stock. Such litigation, including the litigation that is currently pending against us and certain of our officers, directors and stockholders and any other similar litigation that could be brought in the future, could cause us to incur substantial costs associated with defending such litigation or paying for settlements or damages. Such lawsuits could also divert the time and attention of our management from our operating business. Regardless of whether lawsuits are resolved in our favor or if we are the plaintiff or the defendant in any litigation, any lawsuits to which we are or may become a party will likely be expensive and time consuming to defend or resolve. As a result, such litigation may adversely affect our business, financial condition and operating results.
If securities or industry analysts do not publish or cease publishing research or reports about us, our business, our market, or our competitors, or if they change their recommendations regarding our common stock in a negative way, the price and trading volume of our common stock could decline.
The trading market for our common stock is influenced by the research and reports that industry or securities analysts publish about us, our business, our market, or our competitors. If any of the analysts who cover us change their recommendation regarding our common stock in a negative way, or provide more favorable relative recommendations about our competitors, the price of our common stock would likely decline. If any analyst who covers us were to cease coverage of us or fail to regularly publish reports on us, we could lose visibility in the financial markets, which in turn could cause our common stock price or trading volume to decline.
The large number of shares eligible for public sale in the future, or the perception of the public that these sales may occur, could depress the market price of our common stock.
The market price of our common stock could decline as a result of (i) sales of a large number of shares of our common stock in the market, particularly sales by our directors, employees (including our executive officers) and certain other significant stockholders, and (ii) a large number of shares of our common stock being registered or offered for sale. These sales, or the perception that these sales could occur, may depress the market price of our common stock. As of February 18, 2020, there were 101,580,656 shares of common stock outstanding, all of which were freely tradeable on the NYSE, except that any shares held by our affiliates, as that term is defined in Rule 144 under the Securities Act (“Rule 144”), may only be sold in compliance with the registration requirements of the Securities Act or under an exemption under Rule 144 or otherwise.
Additionally, as of February 18, 2020, approximately 5,933,108 shares of our common stock are issuable upon exercise of stock options that vest and are exercisable at various dates through November 4, 2029, with an average weighted exercise price of $13.69
37
per share, and we have issued 49,847 shares of restricted stock with restrictions that lapse at various dates through May 16, 2023. Of such options, 3,628,692 are currently exercisable. We have filed a registration statement on Form S-8 under the Securities Act to register shares of our common stock issued or reserved for issuance under our stock incentive plans. The Form S-8 registration statement became effective immediately upon filing, and shares covered by that registration statement are eligible for sale in the public markets, subject to vesting restrictions and the limitations of Rule 144 applicable to affiliates.
All of our shares of common stock will be eligible for future sale, subject to the applicable volume, manner of sale, holding period and other limitations of Rule 144. In addition, our Sponsors have certain demand registration rights, and certain of our pre IPO stockholders have “piggy back” registration rights with respect to the common stock, subject to certain conditions and exceptions contained in a registration rights agreement.
In the future, we expect to issue stock options, restricted stock and/or other forms of stock-based compensation, which have the potential to dilute stockholders’ value and cause the price of our common stock to decline.
In the future, we expect to offer stock options, restricted stock and/or other forms of stock based compensation to our eligible employees, consultants and directors who are not executives or consultants of the Company or employees of Ares (as defined below) or Freeman Spogli (as defined below) or their respective affiliates. If we grant more equity awards to attract and retain key personnel, the expenses associated with such additional equity awards could materially adversely affect our results of operations and may also result in additional dilution to our stockholders. If any options that we issue are exercised or any restrictions on restricted stock that we issue lapse and those shares are sold into the public market, the market price of our common stock may decline. In addition, the availability of shares of common stock for award under our stock incentive plans or the grant of stock options, restricted stock or other forms of stock based compensation may adversely affect the market price of our common stock.
Our ability to raise capital in the future may be limited.
Our business and operations may consume resources faster than we anticipate. In the future, we may need to raise additional funds through the issuance of new equity securities, debt or a combination of both. Additional financing may not be available on favorable terms or at all. If adequate funds are not available on acceptable terms, we may be unable to fund our capital requirements. If we issue new debt securities, the debt holders would have rights senior to holders of our common stock to make claims on our assets and the terms of any debt could restrict our operations, including our ability to pay dividends on our common stock. If we issue additional equity securities or securities convertible into equity securities, existing stockholders will experience dilution and the new equity securities could have rights senior to those of our common stock. Because our decision to issue securities in any future offering will depend on market conditions and other factors beyond our control, we cannot predict or estimate the amount, timing, or nature of our future offerings. Thus, you bear the risk of our future securities offerings reducing the market price of our common stock and diluting their interest.
Our principal stockholders have substantial control over us, are able to influence corporate matters and may take actions that conflict with your interests and have the effect of delaying or preventing changes of control or changes in management, or limiting the ability of other stockholders to approve transactions they deem to be in their best interest.
Our directors, executive officers, and holders of more than 5.0% of our Class A common stock, together with their affiliates, beneficially own, in the aggregate, approximately 52.6% of our outstanding Class A common stock. Ares Corporate Opportunities Fund III, L.P. (“Ares”), a fund affiliated with Ares Management Corporation (“Ares Management”), beneficially owns, in the aggregate, approximately 12.1% of our outstanding Class A common stock, and FS Equity Partners VI, L.P. and FS Affiliates VI, L.P., funds affiliated with Freeman Spogli Management Co., L.P. (collectively “Freeman Spogli” or “Freeman Spogli & Co.” and together with Ares, our “Sponsors”) beneficially own, in the aggregate, approximately 5.8% of our outstanding Class A common stock. Additionally, Capital World Investors beneficially owns approximately 10.1% of our outstanding Class A common stock, Sands Capital Management, LLC beneficially owns approximately 7.6%, The Vanguard Group beneficially owns approximately 6.9%, and Wellington Management Group LLP beneficially owns approximately 5.3%. As a result, these stockholders acting together, or Ares or Freeman Spogli acting alone, are able to exercise significant influence over all matters requiring stockholder approval, including the election of directors and approval of significant corporate transactions, such as a merger or other sale of us or our assets. The investor rights agreement by and among us, Ares and Freeman Spogli also contains agreements among our Sponsors with respect to voting on the election of our directors and committee memberships on our Board of Directors (the “Board”). The interests of Ares or Freeman Spogli could conflict in material respects with yours, and this concentration of ownership could limit your ability to influence
38
corporate matters and may have the effect of delaying or preventing a third-party from acquiring control over us. Certain of the members of our Board also have relationships with our Sponsors. David B. Kaplan and Rachel H. Lee serve as officers and principals of certain Ares affiliated entities. In addition, NAX 18, LLC, a consulting entity controlled by Norman H. Axelrod, provides consulting services to certain Ares affiliated entities. Brad J. Brutocao and John M. Roth serve as officers and principals of certain Freeman Spogli affiliated entities. In addition, Peter Starrett Associates, a consulting entity controlled by Peter M. Starrett, provides consulting services to certain Freeman Spogli affiliated entities. Our certificate of incorporation provides that no officer or director of ours who is also an officer, director, employee, managing director or other affiliate of our Sponsors will be liable to us or our stockholders for breach of any fiduciary duty by reason of the fact that any such individual directs a corporate opportunity to our Sponsors instead of us, or does not communicate information regarding a corporate opportunity to us that the officer, director, employee, managing director, or other affiliate has directed to our Sponsors.
We do not currently expect to pay any cash dividends.
The continued operation and growth of our business will require substantial funding. Accordingly, we do not currently expect to pay any cash dividends on shares of our common stock. Any determination to pay dividends in the future will be at the discretion of our Board and will depend upon our operating results, financial condition, contractual restrictions, restrictions imposed by applicable law and other factors our Board deem relevant. Additionally, under our Credit Facilities, our subsidiaries are currently restricted from paying cash dividends except in limited circumstances, and we expect these restrictions to continue in the future. Accordingly, realization of a gain on your investment in our common stock will depend on the appreciation of the price of our common stock, which may never occur. Investors seeking cash dividends in the foreseeable future should not purchase our common stock. See Item 5, “Market for Registrant’s Common Equity- Related Stockholder Matters and Issuer Purchases of Equity” for more information.
As a result of our 2017 IPO, our costs have increased significantly, and our management is required to devote substantial time to complying with public company regulations, which will negatively impact our financial performance and could cause our results of operations or financial condition to suffer.
In April 2017, we priced our IPO. As a result, we will continue to incur additional legal, accounting, insurance and other expenses that we did not incur as a private company, including costs associated with public company reporting requirements. We also have incurred and will incur costs associated with the Sarbanes-Oxley Act, Dodd-Frank Wall Street Reform and Consumer Protection Act and related rules implemented by the SEC. The expenses incurred by public companies generally for reporting and corporate governance purposes have been increasing. These rules and regulations increase our legal and financial compliance costs and make some activities more time-consuming and costly, although we are currently unable to estimate these costs with any degree of certainty. In estimating these costs, we took into account expenses related to insurance, legal, accounting, and compliance activities, as well as other expenses. These laws and regulations can also make it more difficult or costly for us to obtain certain types of insurance, including director and officer liability insurance, and we may be forced to accept reduced policy limits and coverage or incur substantially higher costs to obtain the same or similar coverage. These laws and regulations can also make it more difficult for us to attract and retain qualified persons to serve on our Board, our Board committees or as our executive officers. Furthermore, if we are unable to satisfy our obligations as a public company, we could be subject to delisting of our Class A common stock, fines, sanctions, and other regulatory action and potentially civil litigation.
Failure to establish and maintain effective internal controls in accordance with Sections 302 and 404 of the Sarbanes-Oxley Act could have an adverse effect on our business and stock price.
We are required to comply with the SEC’s rules implementing Sections 302 and 404 of the Sarbanes-Oxley Act, which require management to certify financial and other information in our quarterly and annual reports and provide an annual management report on the effectiveness of controls over financial reporting.
To comply with the requirements of Sections 302 and 404, we may need to undertake various actions, such as implementing new internal controls and procedures and hiring additional accounting or internal audit staff. Testing and maintaining internal controls can divert our management’s attention from other matters that are important to the operation of our business. In addition, when evaluating our internal controls over financial reporting, we may identify material weaknesses that we may not be able to remediate in time to meet the applicable deadline imposed upon us for compliance with the requirements of Sections 302 and 404. If we identify material weaknesses in our internal controls over financial reporting or are unable to comply with the requirements of Sections 302 and 404 in a timely manner or assert that our internal controls over financial reporting are effective, or if our independent registered
39
public accounting firm is unable to express an opinion as to the effectiveness of our internal controls over financial reporting, investors may lose confidence in the accuracy and completeness of our financial reports and the market price of our common stock could be negatively affected, and we could become subject to investigations by the NYSE, the SEC or other regulatory authorities, which could require additional financial and management resources.
Anti-takeover provisions could impair a takeover attempt and adversely affect existing stockholders and the market value of our common stock.
Certain provisions of our certificate of incorporation and bylaws and applicable provisions of Delaware law may have the effect of rendering more difficult, delaying or preventing an acquisition of the Company, even when this would be in the best interest of our stockholders. These provisions include:
• | a classified Board; |
• | the sole power of a majority of our Board to fix the number of directors; |
• | the requirement that certain advance notice procedures be followed for our stockholders to submit nominations of candidates for election to our Board and to bring other proposals before a meeting of the stockholders; |
• | the power of our Board to amend our bylaws without stockholder approval; |
• | limitations on the removal of directors nominated by our Sponsors; |
• | the sole power of the Board, or our Sponsors in the case of a vacancy of one of their respective Board nominees, to fill any vacancy on the Board, whether such vacancy occurs as a result of an increase in the number of directors or otherwise; |
• | the ability of a majority of our Board (even if less than a quorum) to designate one or more series of preferred stock and issue shares of preferred stock without stockholder approval; |
• | the inability of stockholders to act by written consent if our Sponsors collectively own less than a majority of our outstanding Class A common stock; |
• | a requirement that, to the fullest extent permitted by law, certain proceedings against or involving us or our directors, officers, or employees be brought exclusively in the Court of Chancery in the State of Delaware; |
• | the lack of cumulative voting rights for the holders of our Class A common stock with respect to the election of directors; and |
• | the inability of stockholders to call special meetings if our Sponsors collectively own less than a majority of our outstanding Class A common stock. |
Further, Delaware law imposes conditions on the voting of “control shares” and on certain business combination transactions with “interested stockholders.”
Our issuance of shares of preferred stock could delay or prevent a change of control of the Company. Our Board has the authority to cause us to issue, without any further vote or action by our stockholders, shares of preferred stock, par value $0.001 per share, in one or more series, to designate the number of shares constituting any series and to fix the rights, preferences, privileges, and restrictions thereof, including dividend rights, voting rights, rights and terms of redemption, redemption price or prices, and liquidation preferences of such series. The issuance of shares of preferred stock may have the effect of delaying, deferring, or preventing a change in control of our Company without further action by our stockholders, even where stockholders are offered a premium for their shares.
40
In addition, the issuance of shares of preferred stock with voting rights may adversely affect the voting power of the holders of our other classes of voting stock either by diluting the voting power of our other classes of voting stock if they vote together as a single class, or by giving the holders of any such preferred stock the right to block an action on which they have a separate class vote even if the action were approved by the holders of our other classes of voting stock.
These provisions could delay or prevent hostile takeovers and changes in control or changes in our management. Also, the issuance of shares of preferred stock with dividend or conversion rights, liquidation preferences, or other economic terms favorable to the holders of preferred stock could adversely affect the market price for our common stock by making an investment in our common stock less attractive. For example, a conversion feature could cause the trading price of our common stock to decline to the conversion price of the preferred stock. Any provision of our certificate of incorporation or bylaws or Delaware law that has the effect of delaying or deterring a change in control or otherwise makes an investment in our common stock less attractive could limit the opportunity for our stockholders to receive a premium for their shares of our common stock and could also affect the price that some investors are willing to pay for our common stock.
ITEM 1B. UNRESOLVED STAFF COMMENTS.
None.
41
ITEM 2. PROPERTIES.
We have 120 U.S. warehouse-format stores located in 30 states, as shown in the chart below:
Number of | ||
State |
| Stores |
Alabama | 1 | |
Arizona |
| 6 |
California |
| 14 |
Colorado |
| 4 |
Florida |
| 20 |
Georgia |
| 8 |
Illinois |
| 7 |
Indiana | 1 | |
Kansas | 2 | |
Kentucky | 1 | |
Louisiana |
| 1 |
Maryland |
| 1 |
Massachusetts | 2 | |
Michigan | 1 | |
Missouri | 2 | |
Nevada |
| 3 |
New Jersey |
| 3 |
New Mexico | 1 | |
New York | 1 | |
North Carolina |
| 3 |
Ohio |
| 3 |
Oklahoma | 1 | |
Pennsylvania |
| 2 |
South Carolina | 1 | |
Tennessee |
| 3 |
Texas |
| 18 |
Utah |
| 2 |
Virginia |
| 5 |
Washington | 2 | |
Wisconsin | 1 | |
Total |
| 120 |
We opened 20 new stores during fiscal 2019. In addition to our warehouse-format stores, we operate one separate small 5,500 square foot design center located in New Orleans, Louisiana. Our headquarters, which we refer to as our store support center, is approximately 185,473 square feet and is located in Atlanta, Georgia. We completed our move to this new location in the fourth quarter of fiscal 2019 from our old store support center in Smyrna, Georgia. Additionally, we operate an approximately 37,000 square foot product review center in Marietta, GA, as well as a 20,400 square foot sample fulfillment center in Marietta, GA.
We lease our store support center, all of our stores, and our distribution centers. Most of our leases provide for a minimum rent and typically include escalating rent increases. Our leases also generally require us to pay insurance, utilities, real estate taxes and repair and maintenance expenses. See the information disclosed under the “Lease Commitments” caption in Note 9, “Commitments and Contingencies” of the notes to our consolidated financial statements included in this Annual Report for further detail on our leases.
ITEM 3. LEGAL PROCEEDINGS.
We are engaged in various legal actions, claims and proceedings arising in the ordinary course of business, including claims related to breach of contracts, product liabilities, intellectual property matters and employment related matters resulting from our business activities. As with most actions such as these, an estimation of any possible and/or ultimate liability cannot always be
42
determined. Regardless of the outcome, litigation can have an adverse impact on us because of defense and settlement costs, diversion of management resources, and other factors. See the information disclosed under the “Litigation” caption in Note 9, “Commitments and Contingencies” to our consolidated financial statements included in this Annual Report for further detail on legal proceedings.
ITEM 4. MINE SAFETY DISCLOSURES.
Not applicable.
43
PART II
ITEM 5. MARKET FOR REGISTRANT’S COMMON EQUITY, RELATED STOCKHOLDER MATTERS AND ISSUER PURCHASES OF EQUITY SECURITIES.
Market Information
Our common stock has been listed on the NYSE under the symbol “FND” since our IPO on April 27, 2017. Prior to that date, there was no public market for our common stock. On February 18, 2020, there were 30 stockholders of record of our Class A common stock. The actual number of stockholders is greater than the number of record holders stated above, and includes stockholders who are beneficial owners, but whose shares are held in “street name” by brokers and other nominees. This number of holders of record also does not include stockholders whose shares may be held in trust by other entities.
Dividend Policy
No dividends have been declared or paid on our common stock. We intend to continue to retain all available funds and any future earnings for use in the operation and growth of our business, and therefore we do not currently expect to pay any cash dividends on our common stock. Any future determination to pay dividends will be at the discretion of our Board and will depend on then existing conditions, including our operating results, financial condition, contractual restrictions, capital requirements, business prospects and other factors that our Board may deem relevant.
Stock Performance Graph
The following graph shows a comparison of cumulative total return to holders of common stock against the cumulative total return of the S&P 500 Index and the S&P 500 Home Improvement Retail Index from April 27, 2017 (the date our common stock commenced trading on the NYSE) through December 26, 2019. The comparison of the cumulative total returns for each investment assumes that $100 was invested in our Class A common stock and the respective indices on April 27, 2017 through December 26, 2019, including reinvestment of any dividends. Historical share price performance should not be relied upon as an indication of future share price performance.
4/27/2017 | 9/28/2017 | 3/29/2018 | 9/27/2018 | 3/28/2019 | 9/26/2019 | 12/26/2019 | ||||||||||||||
FND | $ | 100.00 | $ | 120.81 | $ | 162.62 | $ | 95.85 | $ | 129.52 | $ | 160.03 | $ | 156.94 | ||||||
S&P 500 Index | $ | 100.00 | $ | 105.28 | $ | 110.77 | $ | 122.22 | $ | 118.09 | $ | 124.89 | $ | 135.89 | ||||||
S&P 500 Home Improvement Retail | $ | 100.00 | $ | 101.10 | $ | 111.16 | $ | 133.16 | $ | 123.40 | $ | 142.54 | $ | 141.33 |
44
Unregistered Sales of Equity Securities and Use of Proceeds
None.
Repurchases of our Common Stock
None.
45
ITEM 6. SELECTED FINANCIAL DATA.
The following table sets forth certain selected historical financial and operating data of the Company as of the dates and for the periods indicated. The following selected financial data are qualified by reference to, and should be read in conjunction with, the consolidated financial statements, related notes and other financial information, as well as in “Item 7. Management’s Discussion and Analysis of Financial Condition and Results of Operations”. We operate on a 52- or 53-week fiscal year ending on the Thursday on or preceding December 31. The data presented contains references to fiscal 2015, fiscal 2016, fiscal 2017, fiscal 2018, and fiscal 2019, which represent our fiscal years ended December 29, 2016, December 28, 2017, December 27, 2018 and December 26, 2019 all of which were 52-week periods, and December 31, 2015, which was a 53-week period.
Fiscal Year Ended | ||||||||||||||||
in thousands, except per share amounts (1) |
| 12/26/2019 |
| 12/27/2018 |
| 12/28/2017 |
| 12/29/2016 |
| 12/31/2015(2) |
| |||||
Net sales | $ | 2,045,456 | $ | 1,709,848 | $ | 1,384,767 | $ | 1,050,759 | $ | 784,012 | ||||||
Cost of sales |
| 1,182,442 |
| 1,007,580 |
| 812,203 |
| 621,497 |
| 471,390 | ||||||
Gross profit |
| 863,014 |
| 702,268 |
| 572,564 |
| 429,262 |
| 312,622 | ||||||
Operating expenses: |
|
| ||||||||||||||
Selling and store operating |
| 546,853 |
| 439,495 |
| 353,647 |
| 271,876 |
| 202,637 | ||||||
General and administrative |
| 132,386 |
| 105,327 |
| 84,661 |
| 64,025 |
| 49,917 | ||||||
Pre-opening |
| 24,594 |
| 26,145 |
| 16,485 |
| 13,732 |
| 7,380 | ||||||
Litigation settlement |
| — |
| — |
| — |
| 10,500 |
| — | ||||||
Executive severance (3) | — | — | — |
| — |
| 296 | |||||||||
Total operating expenses | 703,833 | 570,967 | 454,793 |
| 360,133 |
| 260,230 | |||||||||
Operating income |
| 159,181 |
| 131,301 |
| 117,771 |
| 69,129 |
| 52,392 | ||||||
Interest expense, net |
| 8,801 |
| 8,917 |
| 13,777 |
| 12,803 |
| 9,386 | ||||||
Loss on early extinguishment of debt |
| — |
| — |
| 5,442 |
| 1,813 |
| — | ||||||
Income before income taxes |
| 150,380 |
| 122,384 |
| 98,552 |
| 54,513 |
| 43,006 | ||||||
(Benefit) provision for income taxes |
| (251) |
| 6,197 |
| (4,236) | 11,474 | 16,199 | ||||||||
Net income | $ | 150,631 | $ | 116,187 | $ | 102,788 | $ | 43,039 | $ | 26,807 | ||||||
Earnings per share: |
|
|
|
|
|
|
|
|
|
| ||||||
Basic | $ | 1.51 | $ | 1.20 | $ | 1.13 | $ | 0.52 | $ | 0.32 | ||||||
Diluted | $ | 1.44 | $ | 1.11 | $ | 1.03 | $ | 0.49 | $ | 0.31 | ||||||
Weighted average shares outstanding: |
|
|
|
|
|
|
|
| ||||||||
Basic |
| 99,435 |
| 96,770 |
| 90,951 |
| 83,432 |
| 83,365 | ||||||
Diluted |
| 104,962 |
| 104,561 |
| 99,660 |
| 88,431 |
| 86,281 |
As of | |||||||||||||||
in thousands |
| 12/26/2019 |
| 12/27/2018 |
| 12/28/2017 |
| 12/29/2016 |
| 12/31/2015 | |||||
Consolidated balance sheet data: | |||||||||||||||
Cash and cash equivalents | $ | 27,037 | $ | 644 | $ | 556 | $ | 451 | $ | 318 | |||||
Net working capital | 121,908 | 158,029 | 146,856 | 95,550 | 109,565 | ||||||||||
Total assets | 2,324,309 | 1,234,091 | 1,067,992 | 831,166 | 748,888 | ||||||||||
Total debt (4) | 142,606 | 145,334 | 189,062 | 390,743 | 177,590 | ||||||||||
Total stockholders’ equity | 764,336 | 584,309 | 442,860 | 134,283 | 312,365 |
46
Fiscal Year Ended | |||||||||||||||
in thousands, except for per share amounts (1) | 12/26/2019 |
| 12/27/2018 |
| 12/28/2017 |
| 12/29/2016 |
| 12/31/2015(2) | ||||||
Consolidated statement of cash flows data: | |||||||||||||||
Net cash provided by operating activities | $ | 204,658 | $ | 185,624 | $ | 109,207 | $ | 89,456 | $ | 20,380 | |||||
Net cash used in investing activities | (196,008) | (151,397) | (102,253) | (74,648) | (45,021) | ||||||||||
Net cash provided by (used in) financing activities | 17,743 | (34,139) | (6,849) | (14,675) | 24,680 | ||||||||||
Cash dividends declared per share | — | — | — | 2.43 | — |
Fiscal Year Ended | ||||||||||||||||
Other financial data: | 12/26/2019 |
| 12/27/2018 |
| 12/28/2017 |
| 12/29/2016 |
| 12/31/2015(2) | |||||||
Comparable store sales growth | 4.0 | % | 9.2 | % | 16.6 | % | 19.4 | % | 13.5 | % | ||||||
Number of stores open at the end of the period (5) | 121 | 101 | 84 | 70 | 58 | |||||||||||
Adjusted EBITDA (in thousands) (6) | $ | 242,623 | $ | 191,939 | $ | 158,781 | $ | 108,398 | $ | 72,868 | ||||||
Adjusted EBITDA margin | 11.9 | % | 11.2 | % | 11.5 | % | 10.3 | % | 9.3 | % |
(1) | All of the earnings per share data, share numbers, share prices, and exercise prices have been adjusted on a retroactive basis to reflect the 321.820-for-one stock split effected on April 24, 2017. |
(2) | The 53rd week in fiscal 2015 represented $11.9 million in net sales, an estimated $2.1 million in operating income and an estimated $2.2 million in adjusted EBITDA. When presenting comparable store sales for fiscal 2015 and fiscal 2016, we have excluded the last week of fiscal 2015. |
(3) | Represents costs incurred in connection with separation agreements with former officers. |
(4) | Total debt consists of the current and long-term portions of our Credit Facilities, as well as debt discount and debt issuance costs. |
(5) | Represents the number of our warehouse-format stores and our one small-format standalone design center. |
(6) | EBITDA and Adjusted EBITDA (which are shown in the reconciliations below) have been presented in this filing as supplemental measures of financial performance that are not required by, or presented in accordance with, GAAP. We define EBITDA as net income before interest, loss on early extinguishment of debt, taxes, depreciation and amortization. We define Adjusted EBITDA as net income before interest, loss on early extinguishment of debt, taxes, depreciation and amortization, adjusted to eliminate the impact of certain items that we do not consider indicative of our core operating performance. Reconciliations of these measures to the equivalent measures under GAAP are set forth in the table below. |
EBITDA and Adjusted EBITDA are key metrics used by management and our Board to assess our financial performance and enterprise value. We believe that EBITDA and Adjusted EBITDA are useful measures, as they eliminate certain expenses that are not indicative of our core operating performance and facilitate a comparison of our core operating performance on a consistent basis from period to period. We also use Adjusted EBITDA as a basis to determine covenant compliance with respect to our Credit Facilities, to supplement GAAP measures of performance to evaluate the effectiveness of our business strategies, to make budgeting decisions, and to compare our performance against that of other peer companies using similar measures. EBITDA and Adjusted EBITDA are also used by analysts, investors and other interested parties as performance measures to evaluate companies in our industry.
EBITDA and Adjusted EBITDA are non-GAAP measures of our financial performance and should not be considered as alternatives to net income as a measure of financial performance or any other performance measure derived in accordance with GAAP and they should not be construed as an inference that our future results will be unaffected by unusual or non-recurring items. Additionally, EBITDA and Adjusted EBITDA are not intended to be measures of liquidity or free cash flow for management's discretionary use. In addition, these non-GAAP measures exclude certain non-recurring and other charges. Each of these non-GAAP measures has its limitations as an analytical tool, and you should not consider them in isolation or as a substitute for analysis of our results as reported under GAAP. In evaluating EBITDA and Adjusted EBITDA, you should be aware that in the future we will incur expenses that are the same as or similar to some of the items eliminated in the adjustments made to determine EBITDA and Adjusted EBITDA, such as stock compensation expense, loss on asset disposal, executive recruiting/relocation, and other adjustments. Our presentation of EBITDA and Adjusted EBITDA should not be construed to imply that our future results will be unaffected by any such adjustments. Definitions and calculations of
47
EBITDA and Adjusted EBITDA differ among companies in the retail industry, and therefore EBITDA and Adjusted EBITDA disclosed by us may not be comparable to the metrics disclosed by other companies.
The reconciliations of net income to EBITDA and Adjusted EBITDA for the periods noted below are set forth in the table as follows:
| Fiscal Year Ended | ||||||||||||||
in thousands | 12/26/2019 |
| 12/27/2018 |
| 12/28/2017 |
| 12/29/2016 |
| 12/31/2015(2) | ||||||
Net income | $ | 150,631 | $ | 116,187 | $ | 102,788 | $ | 43,039 | $ | 26,807 | |||||
Depreciation and amortization (a) |
| 73,019 |
| 46,346 |
| 33,546 |
| 25,089 |
| 16,794 | |||||
Interest expense, net |
| 8,801 |
| 8,917 |
| 13,777 |
| 12,803 |
| 9,386 | |||||
Loss on early extinguishment of debt (b) | — | — | 5,442 | 1,813 | — | ||||||||||
Income tax (benefit) expense |
| (251) |
| 6,197 |
| (4,236) |
| 11,474 |
| 16,199 | |||||
EBITDA |
| 232,200 |
| 177,647 |
| 151,317 |
| 94,218 |
| 69,186 | |||||
Stock compensation expense (c) |
| 8,711 |
| 6,514 |
| 4,959 |
| 3,229 |
| 3,258 | |||||
Loss on asset impairments and disposals (d) |
| 4,111 |
| 23 |
| 128 |
| 451 |
| 128 | |||||
Executive severance (e) | — | — | — | — | 296 | ||||||||||
Tariff refunds (f) | (8,148) | — | — | — | — | ||||||||||
Litigation settlement (g) | — |
| — |
| — |
| 10,500 |
| — | ||||||
Other (h) | 5,749 |
| 7,755 |
| 2,377 |
| — |
| — | ||||||
Adjusted EBITDA | $ | 242,623 | $ | 191,939 | $ | 158,781 | $ | 108,398 | $ | 72,868 |
(a) | Excludes amortization of deferred financing costs, which is included as a part of interest expense in the table above. For fiscal 2015, fiscal 2016, fiscal 2017, and fiscal 2018, amounts are also net of amortization of tenant improvement allowances. |
(b) | Loss recorded as a result of non-cash write-off of certain deferred financing fees related to the refinancing of term and revolver borrowings in fiscal 2016. For fiscal 2017, the loss related to repaying a portion of our Term Loan Facility with our net proceeds from the IPO. |
(c) | Non-cash charges related to stock-based compensation programs, which vary from period to period depending on timing of awards and forfeitures. |
(d) | For fiscal 2015, fiscal 2016, fiscal 2017, and fiscal 2018, the losses related primarily to assets retired in connection with significant store remodels. For fiscal 2019, amount primarily represents impairment loss for the operating lease right-of-use asset related to the Company’s former store support center in Smyrna, Georgia. |
(e) | Represents one-time costs incurred in connection with separation agreements with former officers. |
(f) | Represents income recognized during the fourth quarter of fiscal 2019 for the portion of expected tariff refunds related to products sold prior to November 20, 2019, the date on which U.S. Customs issued Chapter 99 tariff exclusions for certain of our click-vinyl and engineered flooring products, net of a resulting increase to incentive compensation. Interest income for tariff refunds is included within interest expense, net in the table above. |
(g) | Legal settlement related to classwide settlement to resolve a lawsuit. |
(h) | Other adjustments include amounts management does not consider indicative of our core operating performance. Amounts for fiscal 2019 primarily relate to costs associated with the relocation of the Company’s store support center, including related lease termination costs, and secondary public offering costs of our Class A common stock by certain of our stockholders. Amounts for fiscal 2018 primarily relate to costs associated with two secondary public offerings of our Class A common stock by certain of our stockholders, the closing of our distribution center near Miami, Florida, and losses from hurricanes Harvey and Florence. Amounts for fiscal 2017 relate to costs in connection with the IPO, two secondary public offerings of our Class A common stock by certain of our stockholders and expenses and losses, net of recoveries, from hurricanes Harvey and Irma. The Company did not sell any shares in any of the secondary offerings and did not receive any proceeds from the sales of shares by the selling stockholders. |
48
ITEM 7. MANAGEMENT’S DISCUSSION AND ANALYSIS OF FINANCIAL CONDITION AND RESULTS OF OPERATIONS.
You should read the following discussion and analysis of our financial condition and results of operations together with “Selected Financial Data” and our consolidated financial statements and the related notes thereto and other financial information included elsewhere in this filing. This discussion and analysis contains forward-looking statements that involve risks and uncertainties. Our actual results could differ materially from those anticipated in these forward-looking statements as a result of certain factors, including those discussed in “Item 1A. Risk Factors.” See the cautionary note regarding forward-looking statements set forth at the beginning of Part I of this Annual Report.
Overview
Founded in 2000, Floor & Decor is a high-growth, differentiated, multi-channel specialty retailer of hard surface flooring and related accessories with 120 warehouse-format stores across 30 states as of December 26, 2019. We believe that we offer the industry’s broadest assortment of tile, wood, laminate, vinyl, and natural stone flooring along with decorative and installation accessories at everyday low prices. We appeal to a variety of customers, including our Pro, DIY and BIY customers. Our warehouse-format stores, which average approximately 76,000 square feet, carry on average approximately 3,800 flooring and decorative and installation accessory SKUs, 1.3 million square feet of flooring products, and $2.5 million of inventory at cost. We believe that our inspiring design centers and creative and informative visual merchandising also greatly enhance our customers’ renovation experience. In addition to our stores, our website FloorandDecor.com showcases our products.
We believe our strong financial results are a reflection of a growing domestic hard surface flooring market, a unique approach to selling hard surface flooring, and our consistent and disciplined culture of innovation and reinvestment, together creating a differentiated business model in the hard surface flooring category. In fiscal 2019, we experienced our eleventh year of comparable store sales growth, averaging 13.8% over this time period and 9.9% over the past three years.
Fiscal Year Ended | |||||||||||||||
| 12/26/2019 |
| 12/27/2018 |
| 12/28/2017 |
| CAGR |
| |||||||
Comparable store sales (% change) |
| 4.0 | % | 9.2 | % | 16.6 | % | N/A | |||||||
Number of warehouse-format stores |
| 120 |
| 100 |
| 83 |
| 20.2 | % | ||||||
Net sales (in thousands) | $ | 2,045,456 | $ | 1,709,848 | $ | 1,384,767 | 21.5 | % | |||||||
Net income (in thousands) | $ | 150,631 | $ | 116,187 | $ | 102,788 | 21.1 | % | |||||||
Adjusted EBITDA (in thousands) | $ | 242,623 | $ | 191,939 | $ | 158,781 |
| 23.6 | % |
During fiscal 2019, we continued to make long-term key strategic investments, including:
● | opening 20 new warehouse-format stores, including three new stores in densely populated markets in Boston, Detroit, and the San Francisco Bay area, ending the year with 120 warehouse-format stores; |
● | making significant investments in our distribution supply chain, including opening a new 1.5 million square foot distribution center near Baltimore, Maryland in the fourth quarter, which expanded our distribution center foot print by 50% and is expected to reduce our weeks-of-inventory-supply, improve our on-hand store level inventory, and lower our domestic transportation costs to about one-third of our store base over time; |
● | focusing on innovative new products and localized assortments, supported by inspirational in-store and online visual merchandising solutions; |
● | repositioning a significant amount of our sourced product away from China due to tariffs and antidumping and countervailing duties, while growing our sales and gross margin; |
● | augmenting the management team with new hires in store operations, store training, Pro and Commercial sales, e-commerce, supply chain, merchandising, real estate, information technology, and inventory management; |
● | investing in our connected customer, in-store designer, and Pro customer personnel and customer relationship technology; |
49
● | adding more resources dedicated to serving our Pro customers, including hiring a professional external sales staff to obtain more commercial sales; |
● | increasing proprietary credit offerings; and |
● | investing capital to continue enhancing the in-store shopping experience for our customers. |
Fiscal 2020 – A Look At The Upcoming Year
We believe that our compelling business model, in addition to the projected growth of the large and highly fragmented hard surface flooring market, provides us with an opportunity to significantly expand our store base in the U.S. from 120 warehouse format stores as of December 26, 2019 to approximately 400 stores nationwide within the next 10-12 years based on our past success as well as internal research with respect to housing density, demographic data, competitor concentration, and other variables in both new and existing markets. In 2020, we plan to grow our store base by approximately 20%. In addition to opening new stores, our focus will be on executing our core strategies as well as continuing to make investments that we believe will support our long-term growth, as outlined in “Item 1. Business - Our Growth Strategy.” Our ability to open profitable new stores depends on many factors, including the successful selection of new markets and store locations, our ability to negotiate leases on acceptable terms, and our ability to attract highly qualified managers and staff. For further information, see “Risk Factors—Risks Related to Our Business.”
Key Performance Indicators
We consider a variety of performance and financial measures in assessing the performance of our business. The key measures we use to determine how our business is performing are comparable store sales, the number of new store openings, gross profit and gross margin, operating income, and EBITDA and Adjusted EBITDA.
Comparable Store Sales
Our comparable store sales growth is a significant driver of our net sales, profitability, cash flow, and overall business results. We believe that comparable store sales growth is generated by continued focus on providing a dynamic and expanding product assortment in addition to other merchandising initiatives, quality of customer service, enhancing sales and marketing strategies, improving visual merchandising and overall aesthetic appeal of our stores and our website, effectively serving our Pro customers, continued investment in store staff and infrastructure, growing our proprietary credit offering, and further integrating connected customer strategies and other key information technology enhancements.
Comparable store sales refer to period-over-period comparisons of our net sales among the comparable store base, which has historically been when customers obtained possession of their product. Starting in fiscal 2018, when the new revenue recognition standard was adopted, our comparable store sales refer to period-over-period comparisons of our net sales based on when the customer obtains control of the product, which is typically at the time of sale and may be slightly different than our historically reported net sales due to timing of when final delivery of the product has occurred. A store is included in the comparable store sales calculation on the first day of the thirteenth full fiscal month following a store’s opening, which is when we believe comparability has been achieved. Since our e-commerce sales are fulfilled by individual stores, they are included in comparable store sales only to the extent the fulfilling store meets the above mentioned store criteria. Changes in our comparable store sales between two periods are based on net sales for stores that were in operation during both of the two periods. Any change in square footage of an existing comparable store, including remodels and relocations, does not eliminate that store from inclusion in the calculation of comparable store sales. Stores that are closed temporarily and relocated within their primary trade areas are included in comparable store sales. Additionally, any stores that were closed during the current or prior fiscal year are excluded from the definition of comparable stores.
Our fiscal 2015 year, which ended December 31, 2015, included a 53rd week. When presenting comparable store sales for fiscal 2015, we have excluded the last week of fiscal 2015.
Definitions and calculations of comparable store sales differ among companies in the retail industry; therefore, comparable store metrics disclosed by us may not be comparable to the metrics disclosed by other companies.
We believe that comparable store sales is a useful measure as it allows management as well as analysts, investors, and other interested parties to evaluate the sales performance of our retail stores. In addition, comparable store sales highlights our sales and market share growth. Management uses comparable store sales to evaluate the effectiveness of our selling strategies, to make budgeting decisions, and to compare our performance against that of other peer companies using similar measures.
50
Various factors affect comparable store sales, including:
● | national and regional economic conditions; |
● | the retail sales environment and other retail trends; |
● | the home improvement spending environment; |
● | the hard surface flooring industry trends; |
● | the impact of competition; |
● | changes in our product mix; |
● | changes in staffing at our stores; |
● | cannibalization resulting from the opening of new stores in existing markets; |
● | changes in pricing; |
● | changes in advertising and other operating costs; and |
● | weather conditions. |
Number of New Stores
The number and timing of new store openings, and the costs and fixed lease obligations associated with those openings, have had, and are expected to continue to have, a significant impact on our results of operations. The number of new stores reflects the number of stores opened during a particular reporting period. Before we open new stores, we incur pre-opening expenses, which are defined below. While net sales at new stores are generally lower than net sales at our stores that have been open for more than one year, our new stores have historically been profitable in their first year. Generally, our newer stores have also averaged higher comparable store sales growth than our total store average. Our ability to open new, profitable stores is important to our long-term sales and profit growth goals.
Gross Profit and Gross Margin
Our gross profit is variable in nature and generally follows changes in net sales. Our gross profit and gross margin can also be impacted by changes in our prices, our merchandising assortment, shrink, damage, selling of discontinued products, the cost to transport our products from the manufacturer to our stores, and our distribution center costs. With respect to our merchandising assortment, certain of our products tend to generate somewhat higher margins than other products within the same product categories or among different product categories. We have experienced modest inflation increases in certain of our product categories, but historically have been able to source from a different manufacturer or pass increases onto our consumers with modest impact on our gross margin. Our gross profit and gross margin, which reflect our net sales and our cost of sales and any changes to the components thereof, allow us to evaluate our profitability and overall business results.
Gross profit is calculated as net sales less cost of sales. Gross profit as a percentage of net sales is referred to as gross margin. Cost of sales consists of merchandise costs, as well as freight costs to transport inventory to our distribution centers and stores, and duty and other costs that are incurred to distribute the merchandise to our stores. Cost of sales also includes shrinkage, damage product disposals, distribution, warehousing costs, sourcing and compliance costs. We receive cash consideration from certain vendors related to vendor allowances and volume rebates, which is recorded as a reduction of costs of sales as the inventory is sold or as a reduction of the carrying value of inventory while the inventory is still on hand. Costs associated with arranging and paying for freight to deliver products to customers is included in cost of sales. The components of our cost of sales may not be comparable to the components of cost of sales, or similar measures, of other retailers. As a result, data in this filing regarding our gross profit and gross margin may not be comparable to similar data made available by other retailers.
We believe that gross profit and gross margin are useful measures as they allow management and analysts, investors, and other interested parties to evaluate the cost and profitability of our products and overall cost of sales, which is our largest expense. Gross profit and gross margin are also important indicators of our ability to grow profits and leverage our expenses on a growing sales
51
base. Management uses gross profit and gross margin, among other measures, to make decisions related to product, pricing, supplier, and distribution strategies as well as other areas affecting the products we offer to our customers.
Operating Income, EBITDA, Adjusted EBITDA
Operating income, EBITDA, and Adjusted EBITDA are key metrics used by management and our Board to assess our financial performance and enterprise value. We believe that operating income, EBITDA, and Adjusted EBITDA are useful measures, as they eliminate certain expenses that are not indicative of our core operating performance and facilitate a comparison of our core operating performance on a consistent basis from period to period. We also use Adjusted EBITDA as a basis to determine covenant compliance with respect to our Credit Facilities, to supplement GAAP measures of performance to evaluate the effectiveness of our business strategies, to make budgeting decisions, and to compare our performance against that of other peer companies using similar measures. Operating income, EBITDA and Adjusted EBITDA are also frequently used by analysts, investors and other interested parties as performance measures to evaluate companies in our industry.
EBITDA and Adjusted EBITDA are supplemental measures of financial performance that are not required by, or presented in accordance with, GAAP. We define EBITDA as net income before interest, loss on early extinguishment of debt, taxes, depreciation and amortization. We define Adjusted EBITDA as net income before interest, loss on early extinguishment of debt, taxes, depreciation and amortization, adjusted to eliminate the impact of certain items that we do not consider indicative of our core operating performance.
EBITDA and Adjusted EBITDA are non-GAAP measures of our financial performance and should not be considered as alternatives to net income as a measure of financial performance or any other performance measure derived in accordance with GAAP and they should not be construed as an inference that our future results will be unaffected by unusual or non-recurring items. Additionally, EBITDA and Adjusted EBITDA are not intended to be measures of liquidity or free cash flow for management's discretionary use. In addition, these non-GAAP measures exclude certain non-recurring and other charges. Each of these non-GAAP measures has its limitations as an analytical tool, and you should not consider them in isolation or as a substitute for analysis of our results as reported under GAAP. In evaluating EBITDA and Adjusted EBITDA, you should be aware that in the future we will incur expenses that are the same as or similar to some of the items eliminated in the adjustments made to determine EBITDA and Adjusted EBITDA, such as stock compensation expense, loss (gain) on asset disposal, executive recruiting/relocation, and other adjustments. Our presentation of EBITDA and Adjusted EBITDA should not be construed to imply that our future results will be unaffected by any such adjustments. Definitions and calculations of EBITDA and Adjusted EBITDA differ among companies in the retail industry, and therefore EBITDA and Adjusted EBITDA disclosed by us may not be comparable to the metrics disclosed by other companies.
Other Key Financial Definitions
Net Sales
The retail sector in which we operate is cyclical, and consequently our sales are affected by general economic conditions. Purchases of our products are sensitive to trends in the levels of consumer spending, which are affected by a number of factors such as consumer disposable income, housing market conditions, unemployment trends, stock market performance, consumer debt levels and consumer credit availability, interest rates and inflation, tax rates and overall consumer confidence in the economy.
Net sales reflect our sales of merchandise, less discounts and estimated returns and include our in-store sales and e-commerce sales. In certain cases, we arrange and pay for freight to deliver products to customers and bill the customer for the estimated freight cost, which is also included in net sales. Revenue is recognized when we satisfy the performance obligations in contracts with our customers. Our performance obligations for our retail store sales, as well as for orders placed through our website and shipped to our customers, are satisfied at the point at which the customer obtains control of the inventory, which is typically at the point-of-sale.
Selling and Store Operating Expenses
We expect that our selling and store operating expenses will increase in future periods with future growth. Selling and store operating expenses consist primarily of store personnel wages, bonuses and benefits, rent and infrastructure expenses, supplies, depreciation and amortization, training expenses, and advertising costs. Credit card fees, insurance, personal property taxes, and other miscellaneous operating costs are also included.
52
The components of our selling and store operating expenses may not be comparable to the components of similar measures of other retailers.
General and Administrative Expenses
We expect that our general and administrative expenses will increase in future periods with future growth and in part due to additional legal, accounting, insurance, and other expenses that we expect to incur as a result of being a public company, including compliance with the Sarbanes-Oxley Act. General and administrative expenses include both fixed and variable components, and therefore, are not directly correlated with net sales.
General and administrative expenses consist primarily of costs incurred outside of our stores and include administrative personnel wages in our store support center and regional functions, bonuses and benefits, supplies, depreciation and amortization, and store support center expenses. Insurance, legal expenses, information technology costs, consulting, and other miscellaneous operating costs are also included.
The components of our general and administrative expenses may not be comparable to the components of similar measures of other retailers.
Pre-opening Expenses
We account for non-capital operating expenditures incurred prior to opening a new store or relocating an existing store as “pre-opening” expenses in our consolidated statements of income. Our pre-opening expenses begin, on average, three to six months in advance of a store opening or relocating due to, among other things, the amount of time it takes to prepare a store for its grand opening. Pre-opening expenses primarily include the following: rent, advertising, training, staff recruiting, utilities, personnel, and equipment rental. A store is considered to be relocated if it is closed temporarily and re-opened within the same primary trade area.
Segments
We have one operating segment and one reportable segment. For operating and reporting segment information, refer to Note 1 of the notes to the consolidated financial statements included in this Annual Report for additional details.
53
Results of Operations
The comparison of the fiscal years ended December 27, 2018 and December 28, 2017 can be found in our annual report on Form 10-K for the fiscal year ended December 27, 2018 (the “2018 Annual Report”) located within Part II, Item 7. Management's Discussion and Analysis of Financial Condition and Results of Operations.
For the fiscal years ended December 26, 2019 and December 27, 2018
The following table summarizes key components of our results of operations for the periods indicated, in dollars and as a percentage of net sales (actuals in thousands, dollar changes in millions; certain numbers may not sum due to rounding):
Fiscal Year Ended | ||||||||||||||||||
12/26/2019 | 12/27/2018 | |||||||||||||||||
| Actual |
| % of Sales |
| Actual |
| % of Sales |
| $ Increase/(Decrease) | % Increase/(Decrease) |
| |||||||
Net sales | $ | 2,045,456 | 100.0 | % | $ | 1,709,848 | 100.0 | % | $ | 335.6 | 19.6 | % | ||||||
Cost of sales | 1,182,442 | 57.8 | 1,007,580 | 58.9 | 174.9 | 17.4 | ||||||||||||
Gross profit | 863,014 | 42.2 | 702,268 | 41.1 | 160.7 | 22.9 | ||||||||||||
Operating expenses: |
| |||||||||||||||||
Selling and store operating | 546,853 | 26.7 | 439,495 | 25.7 | 107.4 | 24.4 | ||||||||||||
General and administrative | 132,386 | 6.5 | 105,327 | 6.2 | 27.1 | 25.7 | ||||||||||||
Pre-opening | 24,594 | 1.2 | 26,145 | 1.5 | (1.6) | (5.9) | ||||||||||||
Total operating expenses | 703,833 | 34.4 | 570,967 | 33.4 | 132.9 | 23.3 | ||||||||||||
Operating income | 159,181 | 7.8 | 131,301 | 7.7 | 27.9 | 21.2 | ||||||||||||
Interest expense, net | 8,801 | 0.4 | 8,917 | 0.5 | (0.1) | (1.3) | ||||||||||||
Income before income taxes | 150,380 | 7.4 | 122,384 | 7.2 | 28.0 | 22.9 | ||||||||||||
(Benefit) provision for income taxes | (251) | — | 6,197 | 0.4 | (6.4) | NM | ||||||||||||
Net income | $ | 150,631 | 7.4 | % | $ | 116,187 | 6.8 | % | $ | 34.4 | 29.6 | % |
NM- Not Meaningful
54
Fiscal Year Ended | ||||||||
| 12/26/2019 |
| 12/27/2018 |
| ||||
Comparable store sales (% change) |
| 4.0 | % | 9.2 | % | |||
Comparable average ticket (% change) |
| 2.1 | % | (0.6) | % | |||
Comparable customer transactions (% change) |
| 1.9 | % | 10.0 | % | |||
Number of warehouse-format stores |
| 120 |
| 100 |
| |||
Adjusted EBITDA (in thousands) |
| $ | 242,623 |
| $ | 191,939 |
| |
Adjusted EBITDA margin |
| 11.9 | % | 11.2 | % |
Net Sales
Net sales during fiscal 2019 increased $335.6 million, or 19.6%, compared to fiscal 2018 due to the opening of 20 new stores since December 27, 2018 and an increase in comparable store sales of 4.0%. The comparable store sales increase during the period of 4.0%, or $68.2 million, was driven by a 2.1% increase in comparable average ticket growth and a 1.9% increase in comparable customer transactions. Among our six product categories, three experienced comparable store sales increases during the year, including laminate/luxury vinyl plank, decorative accessories, and installation materials. Non-comparable store sales increased $267.4 million during fiscal 2019 primarily due to the increase in new stores previously described.
We believe the increase in net sales and customer transactions is due to the execution of our key strategic investments. We believe our continued investments and focused merchandising, connected customer, enhanced Pro and commercial sales associates, designer, merchandising, marketing, credit, and visual merchandising strategies, along with new innovative products, led to our sales growth during the periods presented. We have also modestly increased retail prices due to increased tariffs.
Gross Profit and Gross Margin
Gross profit during fiscal 2019 increased $160.7 million, or 22.9%, compared to fiscal 2018. This increase in gross profit was driven by the 19.6% increase in net sales and an increase in gross margin to 42.2%, up approximately 110 basis points from 41.1% in fiscal 2018. The increase in gross margin was due to expected refunds of tariff payments associated with certain of our merchandise as well as higher product margin driven by favorable negotiations with our suppliers, improved merchandising strategies, including higher sales from higher margin categories like installation and decorative accessories, and various strategic retail increases. Refer to Note 1 of the notes to our consolidated financial statements in this Annual Report for additional details related to tariff refunds.
Selling and Store Operating Expenses
Selling and store operating expenses during fiscal 2019 increased $107.4 million, or 24.4%, compared to fiscal 2018 due primarily to opening 20 new stores since December 27, 2018. As a percentage of net sales, our selling and store operating expenses increased approximately 100 basis points to 26.7% from 25.7% in fiscal 2018. The increase was primarily attributable to new stores open less than one year. Comparable store selling and store operating expenses as a percentage of comparable store sales decreased by approximately 30 basis points due to improved leveraging of personnel expenses on higher net sales.
General and Administrative Expenses
General and administrative expenses, which are typically expenses incurred outside of our stores, increased $27.1 million, or 25.7%, during fiscal 2019 compared to fiscal 2018 due to our continued investments in personnel for our store support functions, increased depreciation due to technology investments to support our store growth, and a $4.1 million impairment charge related to the operating lease right-of-use asset for our former store support center in Smyrna, Georgia. Our general and administrative expenses as a percentage of net sales increased approximately 30 basis points to 6.5% in fiscal 2019 from 6.2% in fiscal 2018, of which 20 basis points of the increase was due to the impairment charge.
Pre-Opening Expenses
Pre-opening expenses during fiscal 2019 decreased $1.6 million, or 5.9%, compared to fiscal 2018. This expense decreased due to an enhanced store opening process which shortens the period it takes to open new stores, thereby lessening pre-opening occupancy costs, and the opening of fewer new stores in high cost metropolitan markets. We opened 20 stores and relocated one in fiscal 2019 compared to opening 17 stores and relocating one in fiscal 2018. Of the new store openings, 8 were in new markets and 12 were in existing markets in fiscal 2019 as compared to 12 in new markets and 5 in existing markets in fiscal 2018.
55
Interest Expense
Net interest expense in fiscal 2019 decreased $0.1 million, or 1.3%, compared to fiscal 2018. The decrease in net interest expense was primarily due to our average total debt decreasing to $150.1 million in fiscal 2019 compared to $170.0 million in fiscal 2018. Interest income earned during the year, a portion of which was related to expected tariff refunds, also contributed to the overall decrease. Refer to Note 1 of the notes to our consolidated financial statements in this Annual Report for additional details related to interest on tariff refunds.
Taxes
The provision for income taxes in fiscal 2019 decreased $6.4 million from fiscal 2018. The effective tax rate was (0.2)% for fiscal 2019 compared to 5.1% for fiscal 2018. The decrease in the effective tax rate was primarily due to the recognition of higher excess tax benefits related to stock options exercised in fiscal 2019 compared to fiscal 2018.
Seasonality
Historically, our business has had very little seasonality. Our specialty hard surface flooring and decorative home product offering makes us less susceptible to holiday shopping seasonal patterns compared to other retailers. However, we generally conduct a clearance event during our third fiscal quarter followed by a smaller clearance event towards the end of the year. The timing of these clearance events is driven by operational considerations rather than customer demand and could change from year to year.
Liquidity and Capital Resources
Liquidity is provided primarily by our cash flows from operations and our ABL Facility. During fiscal 2019, we generated $204.7 million in cash from operating activities. As of December 26, 2019, we had $306.5 million in unrestricted liquidity, consisting of $27.0 million in cash and cash equivalents and $279.5 million immediately available for borrowing under the ABL Facility without violating any covenants thereunder.
Our primary cash needs are for merchandise inventories, payroll, store rent, and other operating expenses and capital expenditures associated with opening new stores and remodeling existing stores, as well as information technology, e-commerce, and store support center infrastructure. We also use cash for the payment of taxes and interest.
The most significant components of our operating assets and liabilities are merchandise inventories and accounts payable, and to a lesser extent accounts receivable, prepaid expenses and other assets, other current and non-current liabilities, taxes receivable, and taxes payable. Our liquidity is not generally seasonal, and our uses of cash are primarily tied to when we open stores and make other capital expenditures. We believe that cash expected to be generated from operations and the availability of borrowings under the ABL Facility will be sufficient to meet liquidity requirements, anticipated capital expenditures, and payments due under our Credit Facilities for at least the next 12 months.
Merchandise inventory is our most significant working capital asset and is considered “in-transit” or “available for sale” based on whether we have physically received the products at an individual store location or in one of our four distribution centers. In-transit inventory generally varies due to contractual terms, country of origin, transit times, international holidays, weather patterns, and other factors, but for the last two years, approximately 15% of our inventory was in-transit, while roughly 85% was available for sale in our stores or at one of our four distribution centers.
We measure realizability of our inventory by monitoring sales, gross margin, inventory aging, weeks of supply or inventory turns as well as by reviewing SKUs that have been determined by our merchandising team to be discontinued. Based on our analysis of these factors, we believe our inventory is realizable.
Twice a year, we conduct a clearance event with the goal of selling through discontinued inventory, followed by donations of the aged discontinued inventory that we are unable to sell. We generally conduct a larger clearance event during our third fiscal quarter followed by a smaller clearance event towards the end of the fiscal year. We define aged discontinued inventory as inventory in discontinued status for more than 12 months that we intend to donate. As of December 26, 2019, we had $0.1 million of aged discontinued inventory.
56
Total capital expenditures in fiscal 2020 are planned to be between approximately $255 million to $265 million and will be funded primarily by cash generated from operations and borrowings under the ABL Facility. We intend to make the following capital expenditures in fiscal 2020:
● | Open 24 stores and start construction on stores opening in early fiscal 2020 using approximately $188 million to $194 million of cash; |
● | Invest in existing store remodeling projects and our distribution centers using approximately $50 million to $52 million of cash; and |
● | Invest in information technology infrastructure, e-commerce and other store support center initiatives using approximately $17 million to $19 million of cash. |
During the fourth quarter of fiscal 2019, we opened a new distribution center near Baltimore, Maryland. During fiscal 2019, we incurred capital expenditures of approximately $7.9 million related to this new distribution center.
Cash Flow Analysis
A summary of our operating, investing and financing activities are shown in the following table:
Fiscal Year Ended | ||||||
in thousands |
| 12/26/2019 |
| 12/27/2018 | ||
Net cash provided by operating activities | $ | 204,658 | $ | 185,624 | ||
Net cash used in investing activities |
| (196,008) |
| (151,397) | ||
Net cash provided by (used in) financing activities |
| 17,743 |
| (34,139) | ||
Net increase in cash and cash equivalents | $ |