0001507079falseFY2021http://fasb.org/us-gaap/2021-01-31#AccountingStandardsUpdate201409MemberP3DP5D00P4YP4YP4YP4YP4YP4Y252525252525252500015070792021-01-012021-12-3000015070792021-07-01iso4217:USD00015070792022-02-21xbrli:shares00015070792021-12-3000015070792020-12-31iso4217:USDxbrli:shares0001507079us-gaap:CommonClassAMember2020-12-310001507079us-gaap:CommonClassAMember2021-12-300001507079us-gaap:CommonClassBMember2020-12-310001507079us-gaap:CommonClassBMember2021-12-300001507079us-gaap:CommonClassCMember2021-12-300001507079us-gaap:CommonClassCMember2020-12-3100015070792019-12-272020-12-3100015070792018-12-282019-12-260001507079us-gaap:CommonClassAMemberus-gaap:CommonStockMember2018-12-270001507079us-gaap:AdditionalPaidInCapitalMember2018-12-270001507079us-gaap:AccumulatedOtherComprehensiveIncomeMember2018-12-270001507079us-gaap:RetainedEarningsMember2018-12-2700015070792018-12-270001507079us-gaap:AdditionalPaidInCapitalMember2018-12-282019-12-260001507079us-gaap:CommonClassAMemberus-gaap:CommonStockMember2018-12-282019-12-2600015070792017-12-292018-12-270001507079srt:CumulativeEffectPeriodOfAdoptionAdjustmentMemberus-gaap:RetainedEarningsMember2018-12-270001507079srt:CumulativeEffectPeriodOfAdoptionAdjustmentMember2018-12-270001507079us-gaap:AccumulatedOtherComprehensiveIncomeMember2018-12-282019-12-260001507079us-gaap:RetainedEarningsMember2018-12-282019-12-260001507079us-gaap:CommonClassAMemberus-gaap:CommonStockMember2019-12-260001507079us-gaap:AdditionalPaidInCapitalMember2019-12-260001507079us-gaap:AccumulatedOtherComprehensiveIncomeMember2019-12-260001507079us-gaap:RetainedEarningsMember2019-12-2600015070792019-12-260001507079us-gaap:AdditionalPaidInCapitalMember2019-12-272020-12-310001507079us-gaap:CommonClassAMemberus-gaap:CommonStockMember2019-12-272020-12-310001507079us-gaap:AccumulatedOtherComprehensiveIncomeMember2019-12-272020-12-310001507079us-gaap:RetainedEarningsMember2019-12-272020-12-310001507079us-gaap:CommonClassAMemberus-gaap:CommonStockMember2020-12-310001507079us-gaap:AdditionalPaidInCapitalMember2020-12-310001507079us-gaap:AccumulatedOtherComprehensiveIncomeMember2020-12-310001507079us-gaap:RetainedEarningsMember2020-12-310001507079us-gaap:AdditionalPaidInCapitalMember2021-01-012021-12-300001507079us-gaap:CommonClassAMemberus-gaap:CommonStockMember2021-01-012021-12-300001507079us-gaap:AccumulatedOtherComprehensiveIncomeMember2021-01-012021-12-300001507079us-gaap:RetainedEarningsMember2021-01-012021-12-300001507079us-gaap:CommonClassAMemberus-gaap:CommonStockMember2021-12-300001507079us-gaap:AdditionalPaidInCapitalMember2021-12-300001507079us-gaap:AccumulatedOtherComprehensiveIncomeMember2021-12-300001507079us-gaap:RetainedEarningsMember2021-12-30fnd:segment0001507079fnd:SpartanSurfacesIncMember2021-06-042021-06-040001507079fnd:WarehouseFormatStoreMember2021-12-30fnd:storeutr:sqft0001507079fnd:SmallFormatStoreMember2021-12-30fnd:designCenterfnd:statefnd:distributionCenter0001507079srt:MinimumMember2021-01-012021-12-300001507079srt:MaximumMember2021-01-012021-12-300001507079fnd:TariffRefundMember2021-01-012021-12-300001507079fnd:TariffRefundMember2019-12-272020-12-310001507079fnd:TariffRefundMember2018-12-282019-12-260001507079srt:MinimumMemberus-gaap:FurnitureAndFixturesMember2021-01-012021-12-300001507079us-gaap:FurnitureAndFixturesMembersrt:MaximumMember2021-01-012021-12-300001507079srt:MinimumMemberus-gaap:LeaseholdImprovementsMember2021-01-012021-12-300001507079us-gaap:LeaseholdImprovementsMembersrt:MaximumMember2021-01-012021-12-300001507079srt:MinimumMemberus-gaap:BuildingAndBuildingImprovementsMember2021-01-012021-12-300001507079us-gaap:BuildingAndBuildingImprovementsMembersrt:MaximumMember2021-01-012021-12-300001507079srt:MinimumMemberfnd:ComputerSoftwareAndHardwareMember2021-01-012021-12-300001507079srt:MaximumMemberfnd:ComputerSoftwareAndHardwareMember2021-01-012021-12-300001507079us-gaap:CustomerRelationshipsMember2021-01-012021-12-300001507079us-gaap:NoncompeteAgreementsMember2021-01-012021-12-30xbrli:pure0001507079srt:MinimumMemberus-gaap:EmployeeStockOptionMember2021-01-012021-12-300001507079us-gaap:EmployeeStockOptionMembersrt:MaximumMember2021-01-012021-12-300001507079us-gaap:EmployeeStockMember2021-01-012021-12-300001507079srt:CumulativeEffectPeriodOfAdoptionAdjustmentMemberus-gaap:AccountingStandardsUpdate201602Memberus-gaap:RetainedEarningsMember2018-12-270001507079fnd:LaminateLuxuryVinylPlankMember2021-01-012021-12-300001507079us-gaap:ProductConcentrationRiskMemberfnd:LaminateLuxuryVinylPlankMemberus-gaap:RevenueFromContractWithCustomerProductAndServiceBenchmarkMember2021-01-012021-12-300001507079fnd:LaminateLuxuryVinylPlankMember2019-12-272020-12-310001507079us-gaap:ProductConcentrationRiskMemberfnd:LaminateLuxuryVinylPlankMemberus-gaap:RevenueFromContractWithCustomerProductAndServiceBenchmarkMember2019-12-272020-12-310001507079fnd:LaminateLuxuryVinylPlankMember2018-12-282019-12-260001507079us-gaap:ProductConcentrationRiskMemberfnd:LaminateLuxuryVinylPlankMemberus-gaap:RevenueFromContractWithCustomerProductAndServiceBenchmarkMember2018-12-282019-12-260001507079fnd:TileMember2021-01-012021-12-300001507079us-gaap:ProductConcentrationRiskMemberus-gaap:RevenueFromContractWithCustomerProductAndServiceBenchmarkMemberfnd:TileMember2021-01-012021-12-300001507079fnd:TileMember2019-12-272020-12-310001507079us-gaap:ProductConcentrationRiskMemberus-gaap:RevenueFromContractWithCustomerProductAndServiceBenchmarkMemberfnd:TileMember2019-12-272020-12-310001507079fnd:TileMember2018-12-282019-12-260001507079us-gaap:ProductConcentrationRiskMemberus-gaap:RevenueFromContractWithCustomerProductAndServiceBenchmarkMemberfnd:TileMember2018-12-282019-12-260001507079fnd:DecorativeAccessoriesMember2021-01-012021-12-300001507079us-gaap:ProductConcentrationRiskMemberfnd:DecorativeAccessoriesMemberus-gaap:RevenueFromContractWithCustomerProductAndServiceBenchmarkMember2021-01-012021-12-300001507079fnd:DecorativeAccessoriesMember2019-12-272020-12-310001507079us-gaap:ProductConcentrationRiskMemberfnd:DecorativeAccessoriesMemberus-gaap:RevenueFromContractWithCustomerProductAndServiceBenchmarkMember2019-12-272020-12-310001507079fnd:DecorativeAccessoriesMember2018-12-282019-12-260001507079us-gaap:ProductConcentrationRiskMemberfnd:DecorativeAccessoriesMemberus-gaap:RevenueFromContractWithCustomerProductAndServiceBenchmarkMember2018-12-282019-12-260001507079fnd:InstallationMaterialsAndToolsMember2021-01-012021-12-300001507079us-gaap:ProductConcentrationRiskMemberus-gaap:RevenueFromContractWithCustomerProductAndServiceBenchmarkMemberfnd:InstallationMaterialsAndToolsMember2021-01-012021-12-300001507079fnd:InstallationMaterialsAndToolsMember2019-12-272020-12-310001507079us-gaap:ProductConcentrationRiskMemberus-gaap:RevenueFromContractWithCustomerProductAndServiceBenchmarkMemberfnd:InstallationMaterialsAndToolsMember2019-12-272020-12-310001507079fnd:InstallationMaterialsAndToolsMember2018-12-282019-12-260001507079us-gaap:ProductConcentrationRiskMemberus-gaap:RevenueFromContractWithCustomerProductAndServiceBenchmarkMemberfnd:InstallationMaterialsAndToolsMember2018-12-282019-12-260001507079fnd:WoodMember2021-01-012021-12-300001507079us-gaap:ProductConcentrationRiskMemberus-gaap:RevenueFromContractWithCustomerProductAndServiceBenchmarkMemberfnd:WoodMember2021-01-012021-12-300001507079fnd:WoodMember2019-12-272020-12-310001507079us-gaap:ProductConcentrationRiskMemberus-gaap:RevenueFromContractWithCustomerProductAndServiceBenchmarkMemberfnd:WoodMember2019-12-272020-12-310001507079fnd:WoodMember2018-12-282019-12-260001507079us-gaap:ProductConcentrationRiskMemberus-gaap:RevenueFromContractWithCustomerProductAndServiceBenchmarkMemberfnd:WoodMember2018-12-282019-12-260001507079fnd:NaturalStoneMember2021-01-012021-12-300001507079us-gaap:ProductConcentrationRiskMemberfnd:NaturalStoneMemberus-gaap:RevenueFromContractWithCustomerProductAndServiceBenchmarkMember2021-01-012021-12-300001507079fnd:NaturalStoneMember2019-12-272020-12-310001507079us-gaap:ProductConcentrationRiskMemberfnd:NaturalStoneMemberus-gaap:RevenueFromContractWithCustomerProductAndServiceBenchmarkMember2019-12-272020-12-310001507079fnd:NaturalStoneMember2018-12-282019-12-260001507079us-gaap:ProductConcentrationRiskMemberfnd:NaturalStoneMemberus-gaap:RevenueFromContractWithCustomerProductAndServiceBenchmarkMember2018-12-282019-12-260001507079fnd:AdjacentCategoriesMember2021-01-012021-12-300001507079us-gaap:ProductConcentrationRiskMemberfnd:AdjacentCategoriesMemberus-gaap:RevenueFromContractWithCustomerProductAndServiceBenchmarkMember2021-01-012021-12-300001507079fnd:AdjacentCategoriesMember2019-12-272020-12-310001507079us-gaap:ProductConcentrationRiskMemberfnd:AdjacentCategoriesMemberus-gaap:RevenueFromContractWithCustomerProductAndServiceBenchmarkMember2019-12-272020-12-310001507079fnd:AdjacentCategoriesMember2018-12-282019-12-260001507079us-gaap:ProductConcentrationRiskMemberfnd:AdjacentCategoriesMemberus-gaap:RevenueFromContractWithCustomerProductAndServiceBenchmarkMember2018-12-282019-12-260001507079us-gaap:ProductAndServiceOtherMember2021-01-012021-12-300001507079us-gaap:ProductConcentrationRiskMemberus-gaap:ProductAndServiceOtherMemberus-gaap:RevenueFromContractWithCustomerProductAndServiceBenchmarkMember2021-01-012021-12-300001507079us-gaap:ProductAndServiceOtherMember2019-12-272020-12-310001507079us-gaap:ProductConcentrationRiskMemberus-gaap:ProductAndServiceOtherMemberus-gaap:RevenueFromContractWithCustomerProductAndServiceBenchmarkMember2019-12-272020-12-310001507079us-gaap:ProductAndServiceOtherMember2018-12-282019-12-260001507079us-gaap:ProductConcentrationRiskMemberus-gaap:ProductAndServiceOtherMemberus-gaap:RevenueFromContractWithCustomerProductAndServiceBenchmarkMember2018-12-282019-12-260001507079us-gaap:ProductConcentrationRiskMemberus-gaap:RevenueFromContractWithCustomerProductAndServiceBenchmarkMember2021-01-012021-12-300001507079us-gaap:ProductConcentrationRiskMemberus-gaap:RevenueFromContractWithCustomerProductAndServiceBenchmarkMember2019-12-272020-12-310001507079us-gaap:ProductConcentrationRiskMemberus-gaap:RevenueFromContractWithCustomerProductAndServiceBenchmarkMember2018-12-282019-12-260001507079us-gaap:FurnitureAndFixturesMember2021-12-300001507079us-gaap:FurnitureAndFixturesMember2020-12-310001507079us-gaap:LeaseholdImprovementsMember2021-12-300001507079us-gaap:LeaseholdImprovementsMember2020-12-310001507079fnd:ComputerSoftwareAndHardwareMember2021-12-300001507079fnd:ComputerSoftwareAndHardwareMember2020-12-310001507079us-gaap:BuildingAndBuildingImprovementsMember2021-12-300001507079us-gaap:BuildingAndBuildingImprovementsMember2020-12-310001507079us-gaap:LandMember2021-12-300001507079us-gaap:LandMember2020-12-310001507079us-gaap:CustomerRelationshipsMember2021-12-300001507079us-gaap:CustomerRelationshipsMember2020-12-310001507079us-gaap:NoncompeteAgreementsMember2021-12-300001507079us-gaap:NoncompeteAgreementsMember2020-12-310001507079us-gaap:TradeNamesMember2021-12-300001507079us-gaap:TradeNamesMember2020-12-310001507079us-gaap:StateAndLocalJurisdictionMember2021-01-012021-12-300001507079us-gaap:StateAndLocalJurisdictionMember2019-12-272020-12-310001507079us-gaap:StateAndLocalJurisdictionMember2018-12-282019-12-260001507079us-gaap:StateAndLocalJurisdictionMember2021-12-300001507079fnd:CARESActMemberus-gaap:TaxYear2019Member2020-03-272020-06-250001507079fnd:CARESActMemberfnd:TaxCreditRecognizedAsOffsetToSellingAndStoreOperatingExpensesMember2021-01-012021-12-300001507079fnd:CARESActMember2019-12-272020-12-310001507079fnd:CARESActMemberfnd:TaxCreditCarryforwardsRecognizedAsOffsetToGeneralAndAdministrativeExpensesMember2019-12-272020-12-310001507079fnd:CARESActMember2021-12-300001507079fnd:SpartanSurfacesIncMember2021-12-300001507079fnd:SpartanSurfacesIncMemberfnd:AccruedExpensesAndOtherCurrentLiabilitiesMember2021-12-300001507079fnd:SpartanSurfacesIncMemberus-gaap:OtherLiabilitiesMember2021-12-300001507079fnd:SpartanSurfacesIncMember2021-01-012021-12-300001507079us-gaap:MeasurementInputDiscountRateMemberfnd:SpartanSurfacesIncMember2021-12-300001507079fnd:SpartanSurfacesIncMemberfnd:MeasurementInputRevenueVolatilityMember2021-12-300001507079fnd:SpartanSurfacesIncMemberfnd:MeasurementInputEBITDAVolatilityMember2021-12-300001507079us-gaap:InterestRateCapMemberus-gaap:FairValueInputsLevel2Memberus-gaap:FairValueMeasurementsRecurringMember2021-12-300001507079us-gaap:InterestRateCapMemberus-gaap:FairValueInputsLevel2Memberus-gaap:FairValueMeasurementsRecurringMember2020-12-310001507079us-gaap:InterestRateCapMemberus-gaap:DesignatedAsHedgingInstrumentMember2021-12-300001507079us-gaap:InterestRateCapMemberus-gaap:DesignatedAsHedgingInstrumentMember2021-01-012021-12-300001507079fnd:InterestRateCapOneMemberus-gaap:DesignatedAsHedgingInstrumentMember2021-12-300001507079fnd:InterestRateCapOneMemberus-gaap:DesignatedAsHedgingInstrumentMember2021-01-012021-12-300001507079fnd:InterestRateCapTwoMemberus-gaap:DesignatedAsHedgingInstrumentMember2021-12-300001507079fnd:InterestRateCapTwoMemberus-gaap:DesignatedAsHedgingInstrumentMember2021-01-012021-12-300001507079us-gaap:InterestRateCapMemberus-gaap:NondesignatedMember2021-12-300001507079us-gaap:InterestRateCapMemberus-gaap:NondesignatedMember2021-01-012021-12-300001507079us-gaap:InterestRateCapMemberus-gaap:DesignatedAsHedgingInstrumentMember2020-12-310001507079us-gaap:InterestRateCapMemberus-gaap:DesignatedAsHedgingInstrumentMember2019-12-272020-12-310001507079us-gaap:InterestRateCapMemberus-gaap:NondesignatedMember2020-12-310001507079us-gaap:InterestRateCapMemberus-gaap:NondesignatedMember2019-12-272020-12-310001507079us-gaap:InterestRateCapMember2021-01-012021-12-300001507079us-gaap:InterestRateCapMember2019-12-272020-12-310001507079us-gaap:InterestRateCapMember2018-12-282019-12-260001507079us-gaap:AccumulatedNetGainLossFromDesignatedOrQualifyingCashFlowHedgesMember2021-01-012021-12-300001507079us-gaap:AccumulatedNetGainLossFromDesignatedOrQualifyingCashFlowHedgesMember2019-12-272020-12-310001507079us-gaap:AccumulatedNetGainLossFromDesignatedOrQualifyingCashFlowHedgesMember2018-12-282019-12-260001507079srt:MinimumMember2021-12-300001507079srt:MaximumMember2021-12-30fnd:lease0001507079us-gaap:BuildingMember2021-12-300001507079us-gaap:BuildingMember2020-12-310001507079us-gaap:EquipmentMember2021-12-300001507079us-gaap:EquipmentMember2020-12-310001507079us-gaap:SoftwareAndSoftwareDevelopmentCostsMember2021-12-300001507079us-gaap:SoftwareAndSoftwareDevelopmentCostsMember2020-12-310001507079us-gaap:SellingAndMarketingExpenseMember2021-01-012021-12-300001507079us-gaap:SellingAndMarketingExpenseMember2019-12-272020-12-310001507079us-gaap:SellingAndMarketingExpenseMember2018-12-282019-12-260001507079us-gaap:CostOfSalesMember2021-01-012021-12-300001507079us-gaap:CostOfSalesMember2019-12-272020-12-310001507079us-gaap:CostOfSalesMember2018-12-282019-12-260001507079fnd:PreOpeningCostsMember2021-01-012021-12-300001507079fnd:PreOpeningCostsMember2019-12-272020-12-310001507079fnd:PreOpeningCostsMember2018-12-282019-12-260001507079us-gaap:GeneralAndAdministrativeExpenseMember2021-01-012021-12-300001507079us-gaap:GeneralAndAdministrativeExpenseMember2019-12-272020-12-310001507079us-gaap:GeneralAndAdministrativeExpenseMember2018-12-282019-12-2600015070792019-06-282019-09-2600015070792019-09-272019-12-2600015070792021-11-152021-11-150001507079fnd:TermLoanFacilityMember2021-12-300001507079fnd:TermLoanFacilityMember2020-12-310001507079fnd:TermLoanFacilityB1Member2021-12-300001507079fnd:TermLoanFacilityB1Member2020-12-310001507079fnd:SupplementalTermLoanFacilityMember2021-02-090001507079fnd:SupplementalTermLoanFacilityMember2021-02-092021-02-090001507079fnd:TermLoanFacilityB1Member2021-02-092021-02-090001507079us-gaap:BaseRateMemberfnd:TermLoanFacilityMember2021-02-092021-02-090001507079us-gaap:EurodollarMemberfnd:TermLoanFacilityMember2021-02-092021-02-0900015070792021-02-092021-02-090001507079fnd:TermLoanFacilityMember2021-02-092021-02-090001507079fnd:TermLoanFacilityMember2021-02-090001507079fnd:FourthAmendmentToTermLoanFacilityMember2019-12-272020-06-250001507079fnd:FourthAmendmentToTermLoanFacilityMember2020-06-250001507079fnd:RevolvingCreditFacilityAccordionFeatureMemberus-gaap:RevolvingCreditFacilityMember2021-12-300001507079us-gaap:RevolvingCreditFacilityMemberfnd:AssetBasedLoanFacilityMember2021-01-012021-12-300001507079us-gaap:LetterOfCreditMember2021-12-300001507079us-gaap:RevolvingCreditFacilityMemberfnd:AssetBasedLoanFacilityMember2021-12-300001507079us-gaap:RevolvingCreditFacilityMember2021-01-012021-12-300001507079us-gaap:RevolvingCreditFacilityMember2021-12-300001507079us-gaap:RevolvingCreditFacilityMember2020-12-310001507079us-gaap:FairValueInputsLevel3Member2021-12-300001507079us-gaap:FairValueInputsLevel3Member2020-12-31fnd:class0001507079us-gaap:CommonClassAMember2021-01-012021-12-30fnd:vote0001507079us-gaap:CommonClassBMember2021-01-012021-12-300001507079us-gaap:CommonClassCMember2021-01-012021-12-300001507079fnd:StockOptionPlan2011Member2016-12-290001507079fnd:StockOptionPlan2011Member2015-12-310001507079fnd:StockIncentivePlan2017Member2021-12-300001507079fnd:StockIncentivePlan2017Member2020-12-3100015070792020-08-132020-08-1300015070792020-08-1300015070792020-05-222020-05-2200015070792020-05-2200015070792019-02-282019-02-2800015070792019-02-280001507079us-gaap:EmployeeStockOptionMember2021-01-012021-12-300001507079us-gaap:EmployeeStockOptionMember2019-12-272020-12-310001507079us-gaap:EmployeeStockOptionMember2018-12-282019-12-260001507079us-gaap:EmployeeStockOptionMember2021-12-300001507079us-gaap:EmployeeStockOptionMember2020-12-310001507079us-gaap:RestrictedStockUnitsRSUMember2021-01-012021-12-300001507079us-gaap:RestrictedStockUnitsRSUMember2020-12-310001507079us-gaap:RestrictedStockUnitsRSUMember2021-12-300001507079us-gaap:RestrictedStockMember2021-01-012021-12-300001507079fnd:ServiceBasedShareAwardsMember2020-12-310001507079us-gaap:PerformanceSharesMember2020-12-310001507079fnd:TotalShareholderReturnAwardsMember2020-12-310001507079fnd:ServiceBasedShareAwardsMember2021-01-012021-12-300001507079us-gaap:PerformanceSharesMember2021-01-012021-12-300001507079fnd:TotalShareholderReturnAwardsMember2021-01-012021-12-300001507079fnd:ServiceBasedShareAwardsMember2021-12-300001507079us-gaap:PerformanceSharesMember2021-12-300001507079fnd:TotalShareholderReturnAwardsMember2021-12-300001507079us-gaap:RestrictedStockMember2021-12-300001507079us-gaap:RestrictedStockMember2020-12-310001507079us-gaap:RestrictedStockMember2019-12-272020-12-310001507079us-gaap:RestrictedStockMember2018-12-282019-12-260001507079fnd:EmployeeStockPurchasePlanMembersrt:MinimumMember2018-05-172018-05-170001507079fnd:EmployeeStockPurchasePlanMember2018-05-172018-05-170001507079us-gaap:CommonClassAMemberfnd:EmployeeStockPurchasePlanMember2018-05-170001507079fnd:EmployeeStockPurchasePlanMember2021-01-012021-12-300001507079fnd:EmployeeStockPurchasePlanMember2019-12-272020-12-310001507079fnd:EmployeeStockPurchasePlanMember2018-12-282019-12-260001507079us-gaap:EmployeeStockOptionMemberus-gaap:ShareBasedCompensationAwardTrancheOneMember2021-01-012021-12-300001507079us-gaap:ShareBasedCompensationAwardTrancheTwoMemberus-gaap:EmployeeStockOptionMember2021-01-012021-12-300001507079us-gaap:ShareBasedCompensationAwardTrancheThreeMemberus-gaap:EmployeeStockOptionMember2021-01-012021-12-300001507079us-gaap:EmployeeStockOptionMemberfnd:ShareBasedPaymentArrangementTrancheFourMember2021-01-012021-12-300001507079us-gaap:ShareBasedCompensationAwardTrancheOneMemberus-gaap:RestrictedStockUnitsRSUMember2021-01-012021-12-300001507079us-gaap:ShareBasedCompensationAwardTrancheTwoMemberus-gaap:RestrictedStockUnitsRSUMember2021-01-012021-12-300001507079us-gaap:ShareBasedCompensationAwardTrancheThreeMemberus-gaap:RestrictedStockUnitsRSUMember2021-01-012021-12-300001507079fnd:ShareBasedPaymentArrangementTrancheFourMemberus-gaap:RestrictedStockUnitsRSUMember2021-01-012021-12-300001507079us-gaap:EmployeeStockOptionMember2021-01-012021-12-300001507079us-gaap:EmployeeStockOptionMember2019-12-272020-12-310001507079us-gaap:EmployeeStockOptionMember2018-12-282019-12-2600015070792021-01-012021-04-0100015070792021-04-022021-07-0100015070792021-07-022021-09-3000015070792021-10-012021-12-3000015070792019-12-272020-03-2600015070792020-03-272020-06-2500015070792020-06-262020-09-2400015070792020-09-252020-12-310001507079fnd:SpartanSurfacesIncMember2019-12-272020-12-310001507079fnd:SpartanSurfacesIncMember2018-12-282019-12-260001507079fnd:SpartanSurfacesIncMember2021-06-040001507079fnd:SpartanSurfacesIncMemberfnd:AnnualAdjustedEBITDAMarginTargetsMember2021-06-040001507079fnd:AnnualGrossProfitTargetsMemberfnd:SpartanSurfacesIncMember2021-06-040001507079us-gaap:CustomerRelationshipsMemberfnd:SpartanSurfacesIncMember2021-06-042021-06-040001507079us-gaap:TrademarksAndTradeNamesMemberfnd:SpartanSurfacesIncMember2021-06-042021-06-040001507079us-gaap:NoncompeteAgreementsMemberfnd:SpartanSurfacesIncMember2021-06-042021-06-04
UNITED STATES
SECURITIES AND EXCHANGE COMMISSION
Washington, D.C. 20549
FORM 10-K
| | | | | |
☒ | ANNUAL REPORT PURSUANT TO SECTION 13 OR 15(d) OF THE SECURITIES EXCHANGE ACT OF 1934 |
For the fiscal year ended December 30, 2021
OR
| | | | | |
☐ | TRANSITION REPORT PURSUANT TO SECTION 13 OR 15(d) OF THE SECURITIES EXCHANGE ACT OF 1934 |
For the transition period from to
Commission file number 001-38070
Floor & Decor Holdings, Inc.
(Exact name of registrant as specified in its charter)
Delaware
(State or Other Jurisdiction of Incorporation or Organization)
2500 Windy Ridge Parkway SE Atlanta, Georgia
(Address of Principal Executive Offices)
27-3730271
(I.R.S. Employer Identification No.)
30339
(Zip Code)
Registrant’s telephone number, including area code (404) 471-1634
Securities registered pursuant to Section 12(b) of the Act:
| | | | | | | | |
| Title of each class | Trading Symbol(s) | Name of each exchange on which registered |
| Class A Common Stock, $0.001 par value per share | FND | New York Stock Exchange |
Securities registered pursuant to Section 12(g) of the Act:
NONE
Indicate by check mark if the registrant is a well-known seasoned issuer, as defined in Rule 405 of the Securities Act.
Yes ☒ No ☐
Indicate by check mark if the registrant is not required to file reports pursuant to Section 13 or Section 15(d) of the Act.
Yes ☐ No ☒
Indicate by check mark whether the registrant (1) has filed all reports required to be filed by Section 13 or 15(d) of the Securities Exchange Act of 1934 during the preceding 12 months (or for such shorter period that registrant was required to file such reports), and (2) has been subject to such filing requirements for the past 90 days.
Yes ☒ No ☐
Indicate by check mark whether the registrant has submitted electronically every Interactive Data File required to be submitted pursuant to Rule 405 of Regulation S-T (§232.405 of this chapter) during the preceding 12 months (or for such shorter period that the registrant was required to submit such files).
Yes ☒ No ☐
Indicate by check mark whether the registrant is a large accelerated filer, an accelerated filer, a non-accelerated filer, a smaller reporting company, or an emerging growth company. See the definitions of “large accelerated filer,” “accelerated filer,” “smaller reporting company,” and “emerging growth company” in Rule 12b-2 of the Exchange Act.
| | | | | | | | | | | |
| Large accelerated filer | ☒ | Accelerated filer | ☐ |
| Non-accelerated filer | ☐ | Smaller reporting company | ☐ |
| | Emerging growth company | ☐ |
If an emerging growth company, indicate by check mark if the registrant has elected not to use the extended transition period for complying with any new or revised financial accounting standards provided pursuant to Section 13(a) of the Exchange Act. ☐
Indicate by check mark whether the registrant has filed a report on and attestation to its management's assessment of the effectiveness of its internal control over financial reporting under Section 404(b) of the Sarbanes-Oxley Act (15 U.S.C. 7262(b)) by the registered public accounting firm that prepared or issued its audit report. ☒
Indicate by check mark whether the registrant is a shell company (as defined in Rule 12b-2 of the Exchange Act). Yes ☐ No ☒
The aggregate market value of the Registrant’s Common Stock held by non-affiliates as of July 1, 2021, based on the closing sale price per share as reported by the New York Stock Exchange on such date, was $11.1 billion. There were 105,781,629 shares of Common Stock outstanding as of February 21, 2022.
Documents Incorporated by Reference:
Portions of the Registrant’s proxy statement for the Annual Meeting of Shareholders to be filed pursuant to Regulation 14A of the Exchange Act on or before April 29, 2022, are incorporated by reference into Part III of this Form 10-K. Except as expressly incorporated by reference, the Registrant’s proxy statement shall not be deemed to be part of this report.
TABLE OF CONTENTS
PART I
FORWARD LOOKING STATEMENTS.
The discussion in this Annual Report on Form 10-K (this “Annual Report”), including under Item 1A, “Risk Factors” of Part I and Item 7, “Management’s Discussion and Analysis of Financial Condition and Results of Operations” of Part II, contains forward-looking statements within the meaning of the federal securities laws. All statements other than statements of historical fact contained in this Annual Report, including statements regarding our future operating results and financial position, expectations related to our acquisition of Spartan Surfaces, Inc. ("Spartan"), business strategy and plans, objectives of management for future operations, and the impact of the coronavirus (COVID-19) pandemic, are forward-looking statements. These statements are based on our current expectations, assumptions, estimates and projections. These statements involve known and unknown risks, uncertainties and other important factors that may cause our actual results, performance or achievements to be materially different from any future results, performance or achievements expressed or implied by the forward-looking statements. Forward-looking statements are based on management’s current expectations and assumptions regarding the Company’s business, the economy and other future conditions, including the impact of natural disasters on sales. In some cases, you can identify forward-looking statements by terms such as “may,” “will,” “should,” “expects,” “plans,” “anticipates,” “could,” “seeks,” “intends,” “target,” “projects,” “contemplates,” “believes,” “estimates,” “predicts,” “budget,” “potential” or “continue” or the negative of these terms or other similar expressions.
The forward-looking statements contained in this Annual Report are only predictions. Although we believe that the expectations reflected in the forward-looking statements in this Annual Report are reasonable, we cannot guarantee future events, results, performance or achievements. A number of important factors could cause actual results to differ materially from those indicated by the forward-looking statements in this Annual Report, including, without limitation, those factors described in Item 1A, “Risk Factors” of Part I of this Annual Report, Item 7, “Management’s Discussion and Analysis of Financial Condition and Results of Operations” of Part II of this Annual Report, and elsewhere in the Company’s filings with the Securities and Exchange Commission (the “SEC”). Some of the key factors that could cause actual results to differ from our expectations include the following:
•an overall decline in the health of the economy, the hard surface flooring industry, consumer confidence and spending and the housing market, including as a result of rising inflation or interest rates or the COVID-19 pandemic;
•an economic recession or depression;
•global inflationary pressures on raw materials, energy, commodity, transportation, and other costs could cause our vendors to seek further price increases on the products we sell;
•any disruption in our supply chain, including carrier capacity constraints, port congestion, higher shipping, rail, and trucking prices and other supply chain costs or product shortages;
•our failure to successfully anticipate consumer preferences and demand;
•our inability to pass along cost increases at rates consumers are willing to pay, or reduced demand due to pricing increases;
•our inability to manage our growth;
•our inability to manage costs and risks relating to new store openings;
•our inability to find available locations for our stores on terms acceptable to us;
•any disruption in our distribution capabilities, including from difficulties operating our distribution centers;
•our failure to execute our business strategy effectively and deliver value to our customers;
•our inability to find, train and retain key personnel;
•the resignation, incapacitation or death of any key personnel;
•the inability to staff our stores and distribution centers sufficiently, including for reasons due to the COVID-19 pandemic and other impacts of the COVID-19 pandemic;
•a pandemic, such as COVID-19, or other natural disaster or unexpected event, and its impacts on our suppliers, customers, employees, lenders, operations, including our ability to operate our distribution centers and stores or on the credit markets or our future financial and operating results;
•our dependence on foreign imports for the products we sell, which may include the impact of tariffs and other duties;
•geopolitical risks that impact our ability to import from foreign suppliers;
•if the use of “cookie” tracking technologies is further restricted, the amount of internet user information we collect would decrease, which could require additional marketing efforts and harm our business and operating results;
•violations of laws and regulations applicable to us or our suppliers;
•our failure to adequately protect against security breaches involving our information technology systems and customer information;
•suppliers may sell similar or identical products to our competitors;
•competition from other stores and internet-based competition;
•impact of acquired companies, including Spartan;
•our inability to manage our inventory obsolescence, shrinkage and damage;
•our inability to maintain sufficient levels of cash flow or liquidity to meet growth expectations;
•our inability to obtain merchandise on a timely basis at prices acceptable to us; and
•restrictions imposed by our indebtedness on our current and future operations.
Because forward-looking statements are inherently subject to risks and uncertainties, some of which cannot be predicted or quantified, you should not rely on these forward-looking statements as predictions of future events. The forward-looking statements contained in this Annual Report speak only as of the date hereof. New risks and uncertainties arise over time, and it is not possible for us to predict those events or how they may affect us. If a change to the events and circumstances reflected in our forward-looking statements occurs, our business, financial condition, and operating results may vary materially from those expressed in our forward-looking statements. Except as required by applicable law, we do not plan to publicly update or revise any forward-looking statements contained herein, whether as a result of any new information, future events or otherwise.
ITEM 1. BUSINESS.
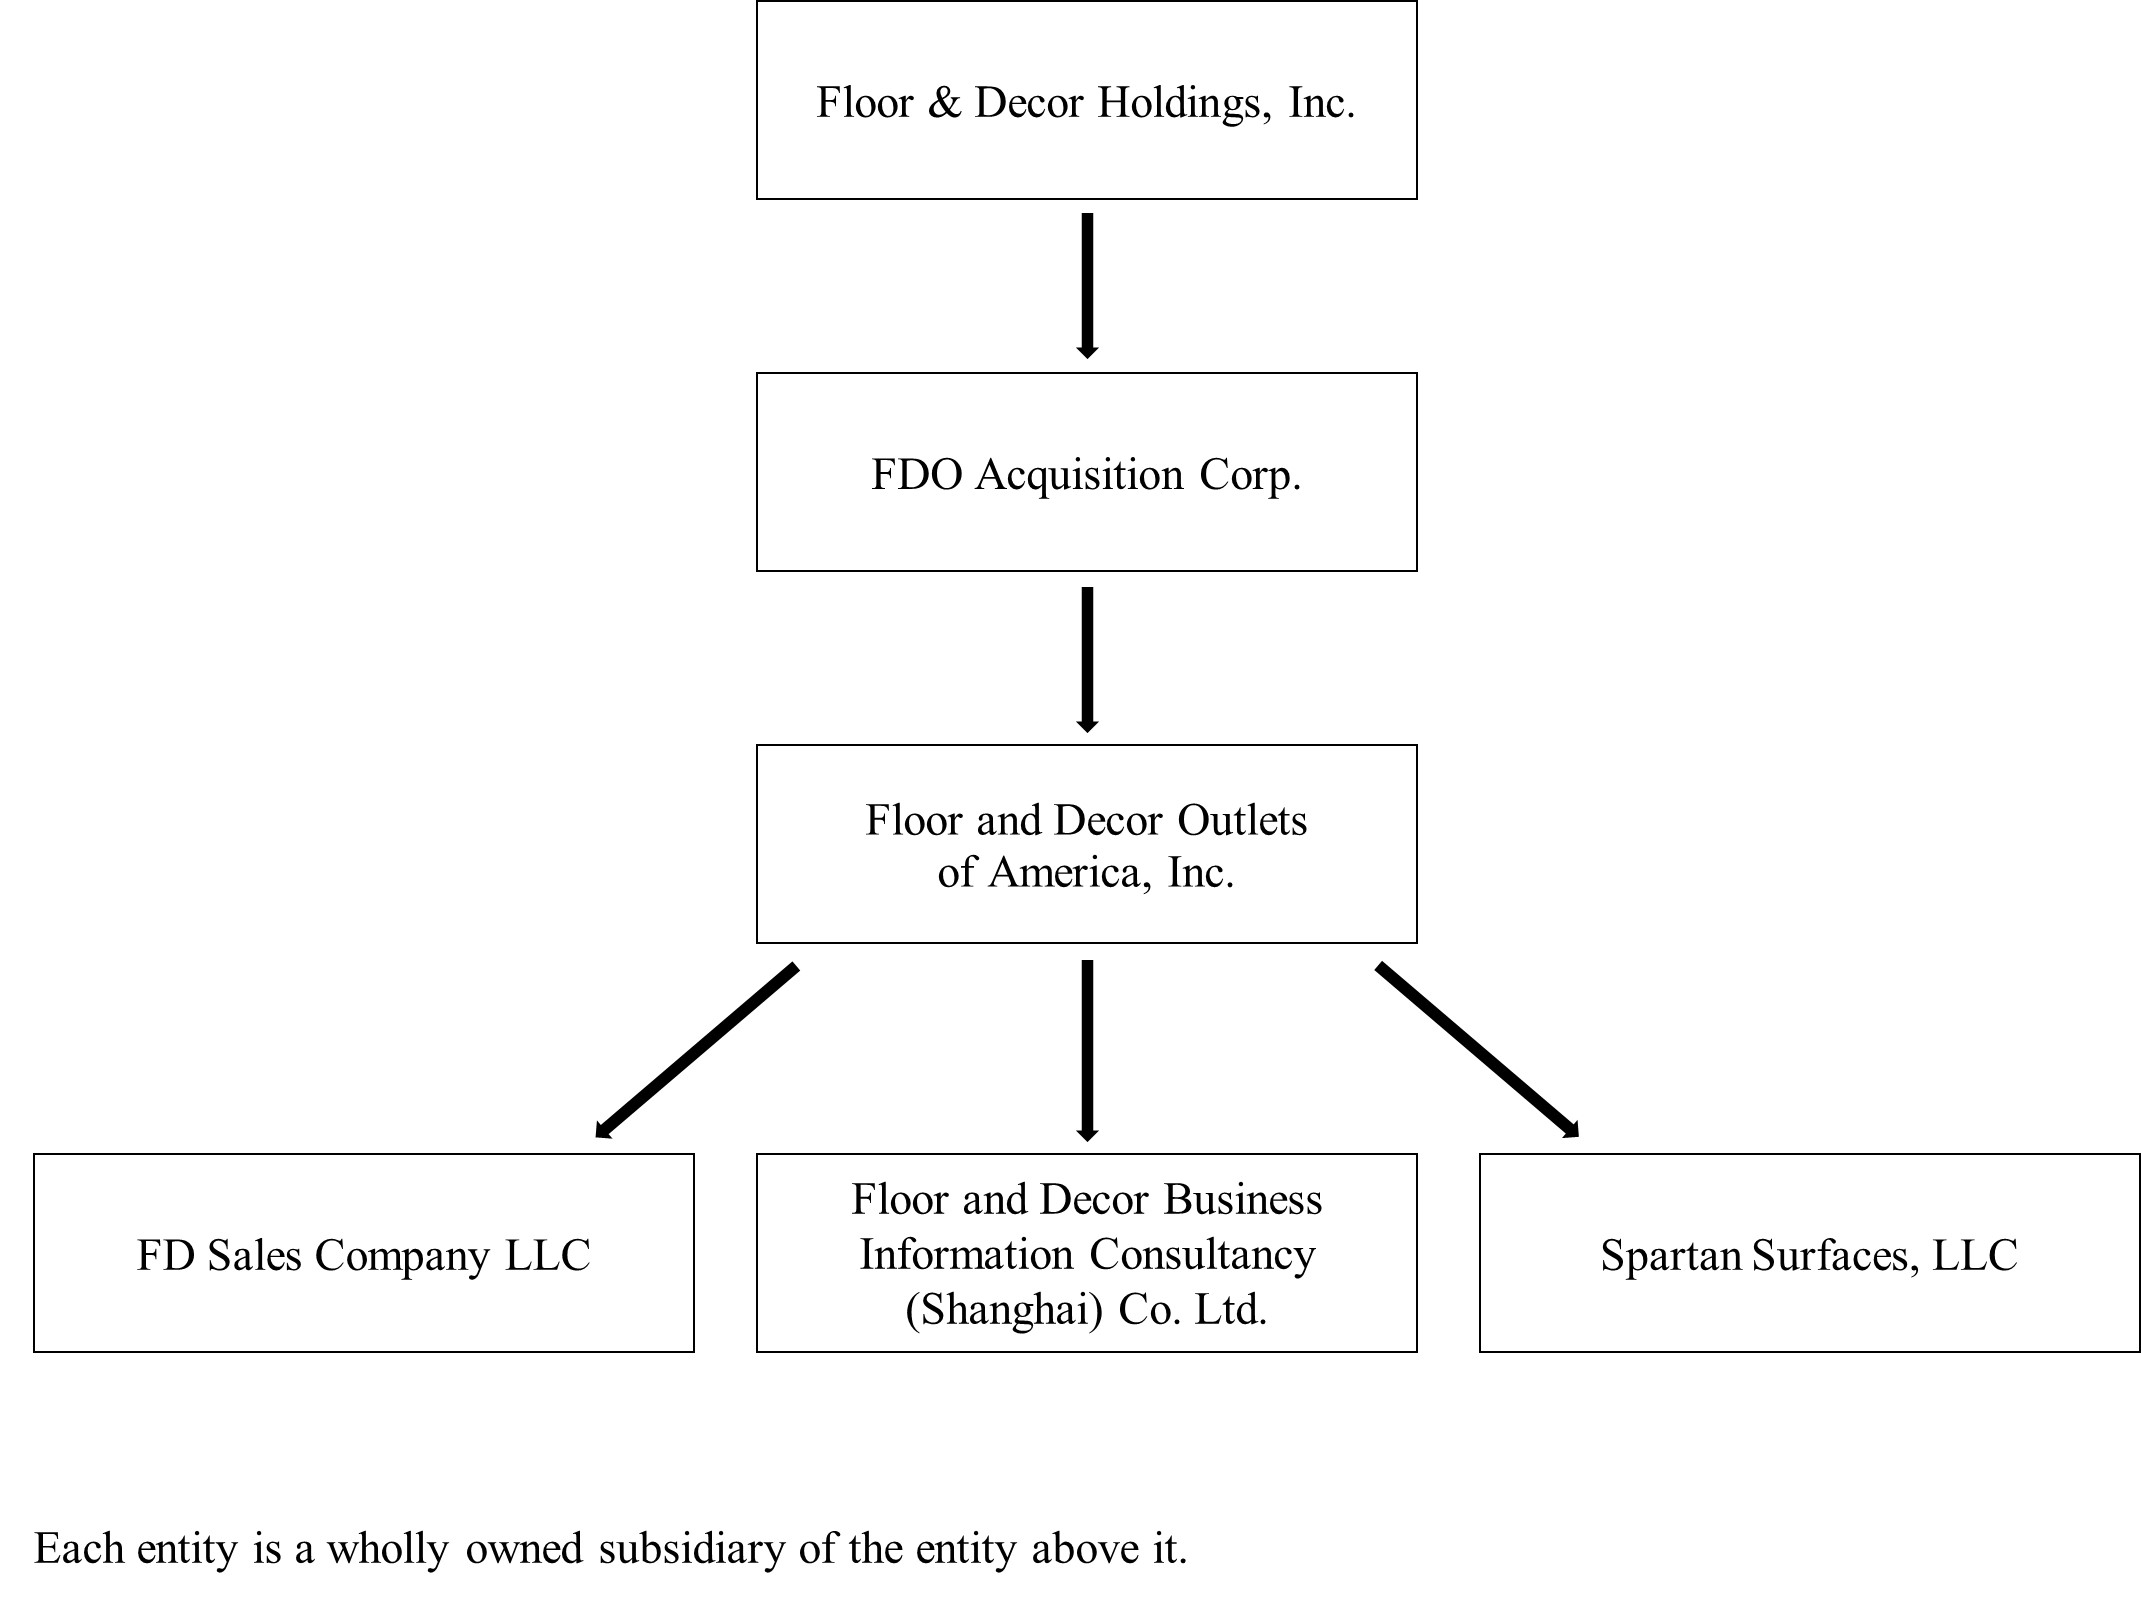
Except where the context suggests otherwise, the terms “Floor & Decor Holdings, Inc.,” “Floor & Decor,” the “Company,” “we,” “us,” and “our” refer to Floor & Decor Holdings, Inc., a Delaware corporation, together with its consolidated subsidiaries.
Our fiscal year is the 52- or 53-week period ending on the Thursday preceding December 31. The following discussion contains references to fiscal 2017, fiscal 2018, fiscal 2019, fiscal 2020, fiscal 2021, and fiscal 2022, which represent our fiscal years ended or ending, as applicable, December 28, 2017, December 27, 2018, December 26, 2019, December 31, 2020, December 30, 2021 and December 29, 2022. Fiscal years 2017, 2018, 2019, 2021, and 2022 are 52-week periods, and fiscal 2020 is a 53-week period.
Our Company
Founded in 2000, Floor & Decor is a high growth, differentiated, multi-channel specialty retailer and commercial flooring distributor of hard surface flooring and related accessories with 160 warehouse-format stores and two small design studios across 33 states. We believe that we offer the industry’s broadest in-stock assortment of tile, wood, laminate, vinyl, and natural stone flooring along with decorative and installation accessories and adjacent categories at everyday low prices positioning us as the one-stop destination for our customers’ entire hard surface flooring needs. We appeal to a variety of customers, including professional installers and commercial businesses (“Pro”), Do it Yourself customers (“DIY”), and customers who buy the products for professional installation (“Buy it Yourself” or “BIY”). We believe the majority of our BIY customers are homeowners. Our Pro customers are loyal, shop often and help promote our brand. The combination of our category and product breadth, low prices, in-stock inventory in project-ready quantities, proprietary credit offerings, integrated website and app, free design services, free storage options and dedicated customer service positions us to gain share in the attractive Pro customer segment. We believe our DIY customers spend significant time planning their projects while conducting extensive research in advance. We provide our customers with the education and inspiration they need before making a purchase through our differentiated online and in-store experience.
Our warehouse-format stores, which average approximately 78,000 square feet, are typically larger than any of our specialty retail flooring competitors’ stores. Other large format home improvement retailers only allocate a small percentage of their floor space to hard surface flooring and accessories. When our customers walk into a Floor & Decor store for the first time, we believe they are amazed by our visual presentation, our store size, our everyday low prices and the breadth and depth of our merchandise. We believe that our inspiring design studios, creative and informative visual merchandising, and accessible price points greatly enhance our customers’ experience. Our stores are easy to navigate and designed to interactively showcase the wide array of designs and product styles a customer can create with our flooring and decorative accessories. We engage our customers both through our trained store associates and designers who can assist in narrowing choices and making the process of home renovation easier, as well as our staff dedicated to serving Pro customers. By carrying a deep level of in-stock hard surface flooring inventory and wide range of tools and accessories, we seek to offer our customers immediate availability on everything they need to complete their entire flooring or remodeling project. In addition to our stores, our website FloorandDecor.com showcases our products, offers informational training and design ideas and has our products available for sale, which a customer can pick up in-store or have delivered. Our ability to purchase directly from manufacturers through our direct sourcing model enables us to be fast to market with a balanced assortment of bestseller and unique, hard to find items that are the latest trend-right products. We believe these factors create a differentiated value proposition for Floor & Decor and drive customer loyalty with our Pro, DIY and BIY hard surface flooring customers in our markets, as evidenced by our track record of consistent comparable store sales growth, which has averaged 12.6% over the last five years. Based on these characteristics, we believe Floor & Decor is redefining and expanding the addressable market size of the hard surface flooring category and that we have an opportunity to significantly expand our warehouse-format store base to at least 500 stores nationwide over the next 8 to 10 years, as described in more detail below.
Our Company was founded in 2000 by our Vice Chairman Vincent West, who opened the first Floor & Decor store in Atlanta, Georgia, with the vision of being the low-price leader for hard surface flooring. As we have grown, we have implemented a customer-focused and decentralized approach to managing our business. We provide our store leadership and regional operating teams with regular training and sophisticated information technology systems. We also train and incentivize our store associates to deliver a superior experience to our customers. Taken together, these elements create a customer-centric culture that helps us achieve our operational and financial goals.
Over the last several years, we have invested significant resources across our business and infrastructure to support innovation and growth. We believe that these investments will continue to strengthen our customer value proposition and further differentiate Floor & Decor from our competition, positioning us for continued market share gains. We have made significant investments in product innovation across all categories, improving our assortment and seeking to provide more value to our Pro, DIY and BIY customers. We have also invested in e-commerce, technology and personnel to support our stores. We believe that our investments in our business will continue to improve our customer value proposition, differentiating us and strengthening our competitive advantage.
We believe our strong financial results are a reflection of our consistent and disciplined culture of innovation and reinvestment, creating a differentiated business model in the hard surface flooring category, as evidenced by the following:
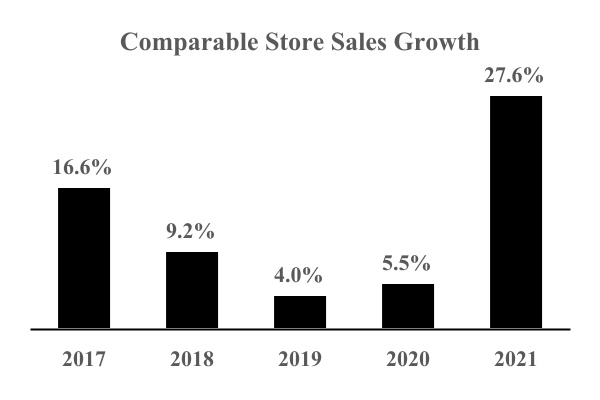
•thirteen years of comparable store sales growth averaging 14.2% per year (and averaging 12.6% per year for fiscal 2017 to fiscal 2021) with a 27.6% increase in fiscal 2021 compared to 5.5% for fiscal 2020;
•store base expansion from 83 warehouse-format stores at the end of fiscal 2017 to 160 warehouse-format stores and two small-format design studios at the end of fiscal 2021, representing a warehouse-format store compound annual growth rate (“CAGR”) of 17.8%; we added 27 warehouse-format stores during fiscal 2021, which was a 20% growth in warehouse-format stores compared to fiscal 2020;
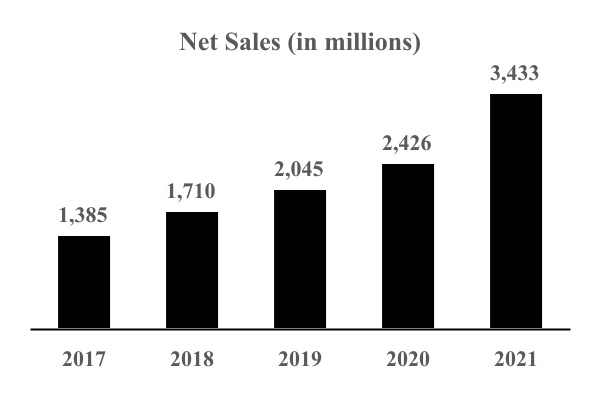
•total net sales growth from $1.38 billion to $3.43 billion from fiscal 2017 to fiscal 2021, representing a CAGR of 25.5%;
•net income growth from $102.8 million to $283.2 million from fiscal 2017 to fiscal 2021, representing a CAGR of 28.8%;
For additional discussion of our fiscal 2021 financial results, see Item 7 “Management's Discussion and Analysis of Financial Condition and Results of Operations.”
Our Competitive Strengths
We believe our strengths, described below, set us apart from our competitors and are the key drivers of our success.
Unparalleled Customer Value Proposition. Our customer value proposition is a critical driver of our business. The key components include:
•Differentiated Assortment Across a Wide Variety of Hard Surface Flooring Categories. Our stores are generally larger than those of our specialty retail flooring competitors, and we allocate substantially more square footage to hard surface flooring and accessories than other large format home improvement retailers. We believe we have the most comprehensive in-stock, trend-right product assortment in the industry within our categories with on average approximately 4,200 stock keeping units (“SKUs”) in each store which, based on our market experience, is a far greater in-stock offering than any other flooring retailer. Additionally, we customize our product assortment at the store level for the regional preferences of each market. We have an ongoing product line review process across all categories that allows us to identify and interpret emerging trends in hard surface flooring. We work with our suppliers to quickly introduce new products and styles in our stores. We appeal to a wide range of customers through our “good/better/best” merchandise selection, as well as through our broad range of product styles from classic to modern, as well as new trend-right products. We consistently innovate with proprietary brands and products that appeal to certain customers with over 60 proprietary brands, including AquaGuard®, DuraLux®, and NuCore®.
•Low Prices. We provide everyday low prices in the retail hard surface flooring market. Our merchandising and individual store teams competitively shop each market so that we can offer our flooring products and related accessories at low prices. We also work with our vendors to identify and create new, affordable products in categories traditionally considered high-end to further democratize hard surface flooring by providing a greater number of options to a larger customer base. We believe we are unique in our industry in employing an “everyday low price” strategy, where we strive to offer our products at consistently everyday low prices throughout the year instead of engaging in frequent promotional activities. Our ability to provide these low prices is supported by our direct-sourcing model, which strives to eliminate third-party intermediaries and shortens time to market. We believe this strategy creates trust with our Pro, DIY and BIY customers because they consistently receive low prices at Floor & Decor without having to wait for a sale or negotiate to obtain the lowest price.
•One-Stop Project Destination with Immediate Availability. We carry an extensive range of products, including flooring and decorative accessories, as well as installation accessories such as thin set, underlayment, grout and tools, to fulfill a customer’s entire flooring project. More recently, we added adjacent categories such as vanities, bathroom accessories, frameless glass in the bathroom, and customized countertops for the kitchen. Our large in-stock assortment, including decorative and installation accessories, differentiates us from our competitors. Our stores stock job-size quantities to immediately fulfill a customer’s entire flooring project. In the instance where a product is not available in the store, our four regional distribution centers and neighboring stores can quickly ship the product to meet a customer’s needs. On average, each warehouse-format store carries approximately 4,200 SKUs, which equates to 1.1 million square feet of flooring products or $2.3 million of inventory at cost. Customers also have access to all of our inventory for in-store pick up or delivery through FloorandDecor.com.
Unique and Inspiring Shopping Environment. Our stores average approximately 78,000 square feet and are typically designed with warehouse features including high ceilings, clear signage, bright lighting and industrial racking and are staffed with knowledgeable store associates. We offer an easy-to-navigate store layout with clear lines of sight and departments organized by our major product categories of tile, wood, laminate, vinyl, natural stone, decorative accessories and installation accessories and smaller, adjacent categories for the bathroom and kitchen. We believe our unique signage, which clearly displays individual product features and benefits, improves the ease of shopping and facilitates customer decision making. We invest heavily in large, visually inspiring merchandise displays that showcase our assortment as well as point of sale marketing throughout our stores to highlight product features, benefits and design elements. These features educate and enable customers to visualize how the product would look in their homes or businesses. Furthermore, we encourage customers to interact with our merchandise, to experiment with potential designs and to see the actual product they will purchase, an experience that is not possible in flooring stores that do not carry in-stock inventory in project-ready quantities. The majority of our stores have design studios, with multiple different vignettes that showcase project ideas to further inspire our customers, and we employ experienced designers in all of our stores to provide free design consulting. Additionally, we provide a robust online experience for potential customers on FloorandDecor.com. For our DIY customers, we also offer weekly “how-to” installation classes on Saturdays. We believe inspiring and educating customers within our stores and on our website provides us with a significant competitive advantage in serving our customers.
Extensive Service Offerings to Enhance the Pro Customer Experience. Our focus on meeting the unique needs of the Pro customer, and by extension the BIY customer, drives our sales mix for Pro and BIY customers, which we believe represents a higher percentage than our competitors. We generate approximately 70% of our sales from homeowners and 30% of our sales from Pros; however, when looking at who determines where to shop, the Pro influences approximately 40% of our sales while homeowners influence approximately 60% our sales. We also estimate that approximately 85% of these flooring purchases will involve a Pro installation. We provide an efficient one-stop shopping experience for our Pro customers, offering low prices on a broad selection of high-quality flooring products, deep inventory levels to support immediate availability of our products, financial credit, free storage for purchased inventory, the convenience of early store hours and, in most stores, separate entrances for merchandise pick-up. We also offer Design Services to our Pro customer to support them in servicing their customers. Additionally, each store has a dedicated Pro sales force with technology to service our Pro customer more efficiently. We have a Pro loyalty rewards program, which provides business-building tools and awards points based on purchases. We believe rewarding our Pro customers through this program improves their loyalty to Floor & Decor, and by serving the needs of Pro customers, we drive repeat and high-ticket purchases, customer referrals, and brand awareness from this attractive and loyal customer segment. We offer commercial credit terms to some of our larger Pro customers, and in late 2020, we added a unique commercial credit card offering for our Pros'.
Decentralized Culture with an Experienced Store-Level Team and Emphasis on Training. We have a decentralized culture that empowers managers at the store and regional levels to make key decisions to maximize the customer experience. Our store managers, who carry the title Chief Executive Merchant (“CEM”), have significant flexibility to customize product mix, pricing, marketing, merchandising, visual displays and other elements in consultation with their regional leaders. We create or implement localized assortments that are not only trend forward but often create trends in the industry, which we believe differentiates us from our national competitors that tend to have standard assortments across markets. Throughout the year, we train all of our employees on a variety of topics, including product knowledge, sales strategies, leadership and store operations. Our store managers and store department managers are an integral part of our company, and many have over 15 years of relevant industry experience in retail. We have made important investments in the training and development of our people, including the creation of a full time training department. Approximately 70% of our new store management positions are filled through internal promotions, including 96% of our CEMs. We also have incentive compensation programs and an employee stock purchase plan for all employees, regardless of position or title. We train prospective store managers at our CEM Leadership Workshop, which is part of an extensive training program. Once a year, we hold a multiple day training session with our senior management, regional directors and CEMs, where we focus on the upcoming year’s strategic priorities to keep our entire business aligned. We believe our decentralized culture and coordinated training foster an organization aligned around providing a superior customer experience, ultimately contributing to higher net sales and profitability.
Sophisticated, Global Supply Chain. Our merchandising team has developed direct sourcing relationships with manufacturers and quarries in 24 countries. Through these relationships, we believe we understand the best places to procure our various product categories. We currently source our products from more than 240 vendors worldwide and have developed long-term relationships with many of them. We often collaborate with our vendors to design and manufacture products for us to address emerging customer preferences that we observe in our stores and markets. We procure the majority of our products directly from the manufacturers, which eliminates additional costs from exporters, importers, wholesalers and distributors. We believe direct sourcing is a key competitive advantage, as many of our specialty retail flooring competitors are too small to have the scale or the resources to work directly with suppliers. We have established a Global Sourcing and Compliance Department to, among other things, enhance our policies and procedures with respect to addressing compliance with appropriate regulatory bodies, including compliance with the requirements of the Lacey Act of 1900 (as amended, the “Lacey Act”), the California Air Resources Board (“CARB”) and the Environmental Protection Agency (“EPA”). Our Compliance Department also addresses compliance with Floor & Decor’s supplier compliance policies, such as specifications and packaging of the products we purchase. We also utilize third-party consultants for audits, testing and surveillance to ensure product safety and compliance. Additionally, we have invested in technology and personnel to collaborate throughout the entire supply chain process to support our direct sourcing model, which has improved our ability to find, manage and source trend-right merchandise quickly and at lower costs, allowing us to offer products at low prices while maintaining attractive gross margins.
Highly Experienced Management Team with a Proven Track Record. Led by our Chief Executive Officer, Tom Taylor, our management team brings substantial expertise from leading retailers and other companies across various core functions, including store operations, merchandising, marketing, real estate, e-commerce, supply chain management, finance, legal and information technology. Tom Taylor, who joined us in 2012, spent 23 years at The Home Depot, where he served as Executive Vice President of Merchandising and Marketing with responsibility for all stores in the United States and Mexico. Over the course of his career at The Home Depot, Tom Taylor helped expand the store base from fewer than 15 stores to over 2,000 stores. Our President, Lisa Laube, plans to retire this year after a successful career of over 30 years in retail, including the last 10 years at Floor & Decor, where she has led an experienced and successful team of merchants and other leaders. Our Executive Vice President and Chief Financial Officer, Trevor Lang, brings more than 25 years of accounting and finance experience, including 20 years of Chief Financial Officer and Vice President of Finance experience at public companies, including the Chief Financial Officer and Chief Administrative Officer of Zumiez Inc. Our entire management team drives our organization with a focus on strong merchandising, superior customer experience, expanding our store footprint, and fostering a strong, decentralized culture. We believe our management team is an integral component of our achieving strong financial results.
Our Growth Strategy
We expect to continue to drive our strong net sales and profit growth through the following strategies:
Open Warehouse-Format Stores in New and Existing Markets. We believe there is an opportunity to significantly expand our warehouse-format store base to at least 500 in the United States over the next 8 to 10 years from 160 as of December 30, 2021 based on our internal research with respect to housing density, demographic data, competitor concentration and other variables in both new and existing markets. We plan to target new store openings in both new and existing, adjacent and underserved markets. We have a disciplined approach to new store development, based on an analytical, research-driven site selection method and a rigorous real estate approval process. We believe our new store model delivers strong financial results and returns on investment, targeting net sales on average of $14 million to $16 million and a minimum of $2.5 million in four-wall adjusted EBITDA before pre-opening expenses in the first year, pre-tax payback in approximately two and a half to three and a half years and cash-on-cash returns of approximately 50% in the third year. Over the past several years, we have made significant investments in personnel, information technology, supply chain, warehouse infrastructure, Pro, commercial, design and connected customer strategies to support our current growth and the expansion of our stores. We intend to grow our store base by approximately 20% annually for the next several years. The performance of our new stores opened over the last three years, the performance of our older stores over that same time frame, our disciplined real estate strategy, and the track record of our management team in successfully opening retail stores support our belief in the significant store expansion opportunity.
Increase Comparable Store Sales. We expect to grow our comparable store sales by continuing to offer our customers a dynamic and expanding selection of compelling, value-priced hard surface flooring and accessories while maintaining strong service standards for our customers. We regularly introduce new products into our assortment through our category product line review process, including collaboration with our vendors to bring to market innovative products such as waterproof rigid core vinyl and water-resistant laminates. Because almost 60% of our stores have been opened for less than five years, we believe they will continue to drive comparable store sales growth as newer stores ramp up to maturity. We believe that we can continue to enhance our customer experience by focusing on service, optimizing sales and marketing strategies, investing in store staff and infrastructure, remodeling existing stores and improving visual merchandising and the overall aesthetic appeal of our stores. We also believe that growing our proprietary credit offering, Pro and designer strategies, further integrating connected customer strategies, and enhancing other key information technology, will contribute to increased comparable store sales. As we increase awareness of Floor & Decor’s brand, we believe there is a significant opportunity to gain additional market share, especially from independent flooring retailers and large format home improvement retailers. We have also added adjacent categories that align with flooring projects like vanities, bathroom accessories, frameless glass in the bathroom, and customized countertops for the kitchen. We believe the combination of these initiatives plus the expected growth of the hard surface flooring category described in more detail under “Our Industry” below will continue to drive comparable store sales growth.
Expand Our “Connected Customer” Experience. Floor & Decor’s online experience allows our Pro, BIY and DIY customers to explore our product selection and design ideas before and after visiting our stores and offers the convenience of making online purchases for delivery or pick up in-store. We believe our online platform reflects our brand attributes and provides a powerful tool to educate, inspire and engage our consumers, and we view our website and multi-channel strategies as leading our brand. Our research indicates that approximately 80% of customers who shopped at Floor & Decor in the last two years have visited our website. We continuously invest in our connected customer strategies to improve how our customers experience our brand. For example, we regularly enhance our website, which provides our customers with inspirational vignettes, videos, products, a room visualizer, education, and a faster online shopping experience. Additional initiatives include: (i) implementing our new Customer Relationship Management software ("CRM") to obtain a single view of our customers, (ii) developing personalized content based on location, purchase and browsing history, (iii) developing more relevant content and improved search and purchasing tools to help customers add decorative and installation accessories and (iv) creating frequently asked questions to help customers choose the best product for their jobs. We believe this reinforces our unique customer value proposition and ultimately drives sales. Our e-commerce sales represented approximately 16% of our total net sales for fiscal 2021. While the hard surface flooring category has a relatively low penetration of e-commerce sales due to the nature of the product, we believe our connected customer presence represents an attractive growth opportunity to drive consumers to Floor & Decor.
Continue to Invest in the Pro Customer. We believe our differentiated focus on Pro customers has created a competitive advantage for us and will continue to drive our net sales growth. We will invest in gaining and retaining Pro customers due to their frequent and high-ticket purchases, loyalty, and propensity to refer other potential customers. We have made important investments in the Pro services regional team, including the additional Regional Pro Directors, to better recruit and train the Pro services team in each store. We have also invested in technology, such as an integrated CRM, to help us further penetrate and grow our Pro business, dedicated phone lines for our Pro customers to call and text, commercial credit and open account terms, jobsite delivery, a dedicated website for Pro customers, a growing and successful Pro loyalty program, training on technical flooring installation solutions, and tools to facilitate large commercial jobs sourced throughout the store. We plan to further invest in initiatives to increase speed of service, financing solutions, leverage technology, elevate our Pro branding, dedicate additional store staffing to support Pro customers, and enhance the in-store experience for our Pro customers. We continue to invest in refreshing and expanding our Pro Premier Service area in the store to better facilitate our growing Pro business. Additionally, we communicate our value proposition and various Pro-focused offerings by hosting Pro networking events. In 2021, we made a concerted effort to better align our Pro and Design Services offering with technology and personnel. We believe Pro customers will continue to be an integral part of our sales growth.
Expand Our Sales Growth in Commercial Flooring. Building on our success in serving the Pro customer, in 2016, we entered the adjacent commercial sales channel, thereby increasing the size of the addressable market we serve. We believe the same attributes that have allowed us to be successful in selling residential retail hard surface flooring, which include high quality, trend-right hard surface flooring sourced at a low cost directly from the manufacturer, will allow us to grow in the commercial flooring market. We estimate our domestic addressable commercial flooring market, inclusive of installation categories, to be approximately $16 billion. We estimate that approximately 60% of the commercial market utilizes architectural and design firms as the primary decision maker for their hard surface flooring purchasing decisions, while the other 40% are owners, builders, developers, general contractors, and commercial flooring installers that make the primary decisions for hard surface flooring purchases. Prior to 2021, Floor & Decor sales representatives targeted corporate customers, large scale multi-family developers, large home builders, hotels, restaurants, and retailers and focused primarily on the 40% of the market described above. On June 4, 2021, we acquired Spartan Surfaces, Inc. (“Spartan”), a commercial specialty hard-surface flooring distribution company. Spartan focuses primarily on the architectural and design market mentioned above. We intend to continue to add commercial sales representatives to address the entire commercial flooring market.
Continue to Invest in Design Services. Our Design Services offer a unique to large format retail experience, which leads our customers through a seamless, inspirational design process to complete their projects. Our research tells us when a designer is involved, customer satisfaction is higher, the average ticket is approximately three times higher compared with customers who do not use a designer, and design appointments close at a higher rate than typical transactions. We position our designers as experts through our inspirational content and promote design services through all channels. We intend to continue to invest in recruiting top design talent, training, tools and technology. Design-focused training is a priority to ensure our teams are knowledgeable and prepared to deliver a start-to-finish consultative selling experience. We believe the planned rollout of our CRM technology to our design teams this year will enhance communication and workflow, from initial customer interaction through securing the close of the sale and beyond. Recent realignment within the regional store leadership organization to support design is expected to amplify the effectiveness of influence and high-level strategic execution. Additionally, we intend to continue to test advanced service options in various markets to further set us apart.
Enhance Margins Through Increased Operating Leverage. Since 2011, we have invested significantly in our sourcing and distribution network, integrated IT systems and corporate overhead to support our growth. Over time, we expect to leverage these investments as we grow our net sales. Additionally, we believe operating margin improvement opportunities will include enhanced product sourcing processes and overall leveraging of our store-level fixed costs, existing infrastructure, supply chain, corporate overhead and other fixed costs resulting from increased sales productivity. We anticipate that the planned expansion of our store base and growth in comparable store sales will also support increasing economies of scale over the long-term.
Our Industry
Floor & Decor operates in the large, growing and highly fragmented $24 billion U.S. floor coverings market (in manufacturers’ dollars) based on internal and external research, including 2021 reports by Market Insights, LLC, and Catalina Research, Inc., leading providers of market research for the floor coverings industry. We estimate that, after retail markup, the addressable hard surface flooring market for Floor & Decor is approximately $30 billion. Inclusive of installation materials and tools, which we internally estimate at $11 billion, our combined total addressable market (“TAM”) is approximately $41 billion. We estimate that the $41 billion TAM comprises approximately $25 billion in residential remodel and repair spending and $16 billion in commercial spending. The TAM does not include adjacent categories, which we estimate could represent another $8 billion to $13 billion.
We believe we benefit from growth in the overall hard surface flooring market, which increased on average 4% per year from 2016 to 2021. The market declined about 2% in 2020 due to the COVID-19 pandemic. The market is estimated to grow on average 4% through 2026, assuming supportive housing and economic metrics remain intact. We believe that growth in the hard surface flooring market will continue to be driven by several home remodeling demand drivers. These include a large supply of aging homes, millennials entering their household formation years, existing-home sales growth from the low supply of housing inventory, rising home equity values, and the secular shift from carpet to hard surface flooring. In addition, we believe we have an opportunity to increase our market share as many of our competitors are unable to effectively compete with our combination of price, service, and broad in-stock assortment. The competitive landscape of the hard surface flooring market includes big-box home improvement centers, national and regional specialty flooring retailers, and independent flooring retailers. We estimate we represented approximately 8% of the TAM in 2021, increasing from approximately 6% in 2020.
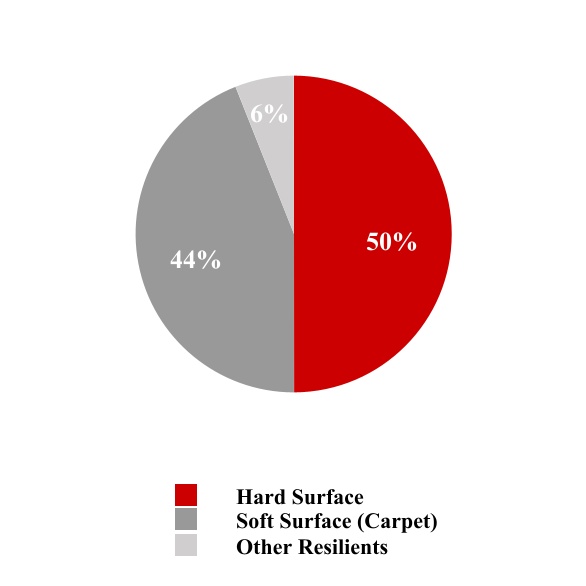
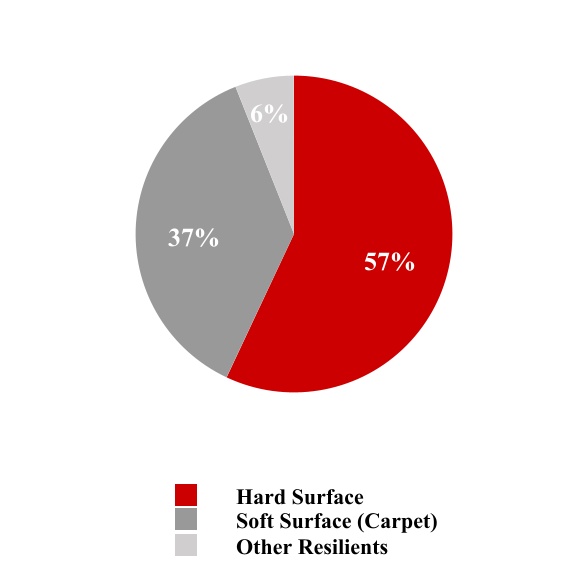
Over the last decade, hard surface flooring has consistently taken market share from carpet as a percentage of the total floor coverings market, increasing from 50% in 2016 to 57% in 2021. Historically, the mix shift towards hard surface flooring has been driven by product innovation, changing consumer preferences, better hygiene qualities, increasing ease of installation, and higher durability. Product innovation, which has been aided by the increasing use of technology such as inkjet tile printing, waterproof wood-look flooring, and water-resistant laminates, and non-traditional uses of hard surface flooring including walls, fireplaces, and patios, has increased the size of the hard surface flooring market.
We believe we have an opportunity to continue to gain share in the hard surface flooring market with the largest selection of tile, wood, laminate, vinyl, natural stone, decorative accessories, and installation materials. Our strong focus on the customer experience drives us to remain innovative and locally relevant while maintaining low prices and in-stock merchandise in a one-stop shopping destination.
Our Products
We offer an assortment of tile, wood, laminate, vinyl, and natural stone flooring along with decorative accessories and wall tiles, installation materials, and adjacent categories at everyday low prices. Our objective is to carry a broad and deep in-stock product offering in order to be the one-stop destination for our customer’s entire project needs. We seek to showcase products in our stores and online to provide multiple avenues for inspiration throughout a customer’s decision-making process.
Our strategy is to fulfill the product needs of our Pro, DIY and BIY customers with our extensive assortment, in-stock inventory and merchandise selection across a broad range of price points. We offer bestseller products in addition to the more unique, hard to find items that we believe our customers have come to expect from us. We source our products from around the world, constantly seeking new and exciting merchandise to offer our customers. Our goal is to be at the forefront of hard surface flooring trends in the market, while offering low prices given our ability to source directly from manufacturers and quarries.
We utilize a regional merchandising strategy in order to carry products in our stores that cater to the preferences of our local customer base. This strategy is executed by our experienced merchandising team, which consists of category merchants and regional merchants, who work with our individual stores to ensure they have the appropriate product mix for their location. Our category merchants are constantly seeking new products and following trends by attending trade shows and conferences, as well as by meeting with vendors around the world. We schedule regular meetings to review information gathered and make future product decisions. This constant connectivity between our stores, regional merchants, category merchants, and our vendors allows us to quickly bring new, innovative, and compelling products to market.
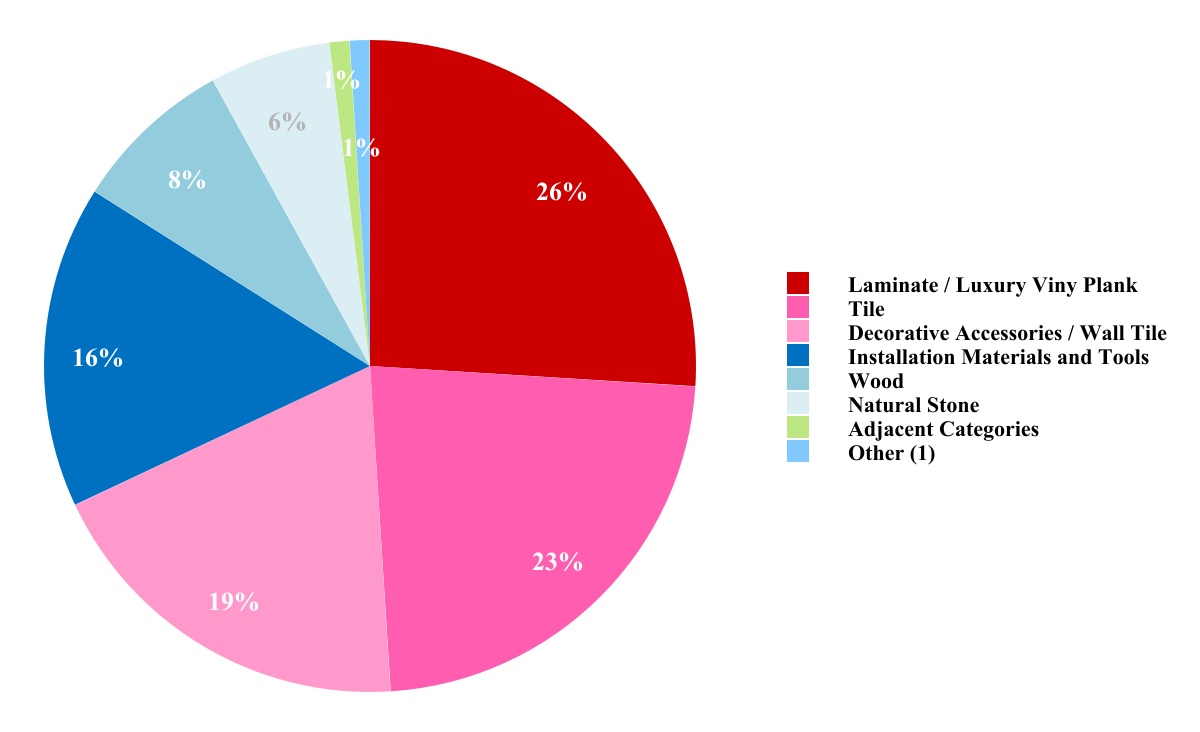
Our fiscal 2021 net sales by major product category are set forth below:
| | | | | | | | | | | | | | |
| Category | | Products Offered | | Select Product Highlights |
| Laminate / Luxury Vinyl Plank | | Wood-based Laminate Flooring, Luxury Vinyl, Engineered/Composite (Rigid Core) Vinyl | | Laminate, AquaGuard® water-resistant laminate, NuCore®, DuraLux® Rigid and Luxury Vinyl plank flooring is offered in styles that mimic our bestselling tile and wood species, colors and finishes. Our product offers a full range of installation methods, many are water-resistant to waterproof, and all are great for customers who want the beauty of real hardwood and stone but the ease of maintenance and durability that laminate and luxury vinyl offer. |
| Tile | | Porcelain, White Body, Ceramic | | We offer a wide selection of Porcelain and Ceramic tiles from 4”x4” all the way up to 60”x120”. We source many products directly from Italy, where many design trends in tile originate. We offer traditional stone looks as well as wood-looking planks and contemporary products like cement-look and vein cut styles. We work with many factories in the United States, Spain, Turkey, Italy, Mexico, Brazil, and other countries to bring the most in-demand styles at low prices. |
| Decorative Accessories / Wall Tile | | Glass, Natural Stone, Tile Mosaics and Decorative Tiles, Decorative Trims, Prefabricated Countertops, Medallions, Wall Tile | | With over 700 choices in glass, tile and stone mosaics and decoratives, we can customize nearly any look or style a customer desires. This trend-forward and distinctive category is a favorite of our designers and offers customers an inexpensive way to quickly update a backsplash or shower. |
| Installation Materials and Tools | | Grout, Mortar, Backer Board, Power Tools, Adhesives, Underlayments, Moldings, Stair Treads | | This category offers everything a customer needs to complete his or her project, including backer board, mortar, grout, wood adhesives, underlayment, molding and tools. We sell top brands, which we believe are highly valued by our customers. |
| | | | | | | | | | | | | | |
| Category | | Products Offered | | Select Product Highlights |
| Wood | | Solid Prefinished Hardwood, Solid Unfinished Hardwood, Engineered Hardwood, Bamboo, Cork | | We sell common species such as Oak, Walnut, Birch, Hickory and Maple but also exotics such as Bamboo, Mahogany, Acacia, Ash, and Hevea all in multiple colors, sizes, and thicknesses. Our wood flooring comes in multiple widths from 21/4” up to 11” wide planks. We also offer wide and long planks and thick veneer options in the engineered wood as well as water resistant wood and bamboo options. Customers have the option of buying prefinished or unfinished flooring in many of our stores. |
| Natural Stone | | Marble, Limestone, Travertine, Slate, Granite, Ledger | | Natural stone is quarried around the world, and we typically buy directly from the source. For example, we buy natural stones from Italy, Greece, Spain, Turkey, Portugal, India, China, Indonesia, and Vietnam. We work with quarry owners and factories in these countries and others to cut stone tiles in many sizes, finishes and colors. |
| Adjacent categories | | Vanities, Shower doors, Bath Accessories, Faucets, Sinks, Custom Countertops, Bathroom Mirrors, Bathroom Lighting | | We offer products designed with ease and function in mind to complete kitchen and bathroom projects. Our product line of Studio Design branded vanities, bathroom accessories and more offer stylish options at everyday low prices. |
(1) Other includes delivery, sample, and other product revenue and adjustments for deferred revenue, sales returns reserves, customer rewards under our Pro Premier Loyalty program, and other revenue related adjustments that are not allocated on a product-level basis. Refer to Note 2, “Revenue” of the notes to our consolidated financial statements included in this Annual Report for more information.
Stores
We operate 160 warehouse-format stores across 33 states and two small-format design studios. Most of our stores are situated in highly visible retail and industrial locations. Our warehouse-format stores average approximately 78,000 square feet and carry on average approximately 4,200 flooring, decorative and installation accessory SKUs, which equates to approximately 1.1 million square feet of flooring products or $2.3 million of inventory at cost.
Each of our stores is led by a store manager who holds the title CEM and is supported by an operations manager, product category department managers, a design team, and a Pro sales and support team. Our store management focuses on providing superior customer service and creating customized store offerings that are tailored to meet the specific needs of their stores. Beyond the store managers, each store is staffed with associates, the number of whom vary depending on sales volume and size of the store. We dedicate significant resources to training our new store managers through our CEM Training Workshop and in the field across all product areas, with store-level associates receiving certification on specific product areas. Ongoing training and continuing education are provided for all employees throughout the year.
We believe there is an opportunity to significantly expand our store base in the United States from our 160 warehouse-format stores currently to at least 500 nationwide over the next 8 to 10 years based on our internal research with respect to housing density, demographic data, competitor concentration and other variables in both new and existing markets. For the next several years, we plan to grow our store base by approximately 20% per year, with a mix being opened in existing geographies and the others being opened in new markets. We have developed a disciplined approach to new store development, based on an analytical, research-driven method to site selection and a rigorous real estate review and approval process. By focusing on key demographic characteristics for new site selection, such as aging of homes, length of home ownership and median income, we expect to open new stores with attractive returns.
When opening new stores, inventory orders are placed several months prior to a new store opening. Significant investment is made in building out or constructing the site, hiring and training employees in advance, and advertising and marketing the new store through pre-opening events to draw the flooring industry community together. Each new store is thoughtfully designed with store interiors that include interchangeable displays on wheels, racking to access products and stand-up visual displays to allow ease of shopping and an exterior highlighted by a large, bold Floor & Decor sign. The majority of our stores have design studios that showcase project ideas to further inspire our customers, and, in all of our stores, we employ experienced designers to provide design consulting to our customers free of charge. Additionally, we have rolled out “Pro Zones”, which are dedicated areas offering a variety of services to Pro customers, in a majority of our stores.
Our new store model targets a store size of 70,000-80,000 square feet, total initial net cash investment of approximately $8 million to $10 million, which could increase as we have the ability to own and self-develop more new stores, net sales on average of $14 million to $16 million and a minimum of $2.5 million in four-wall adjusted EBITDA before pre-opening expenses in the first year, pre-tax payback in approximately two and a half to three and a half years and cash-on-cash returns of approximately 50% in the third year. We believe the success of our stores across geographies and vintages supports the portability of Floor & Decor into a wide range of markets. The performance of our new stores is inherently uncertain and is subject to numerous factors that are outside of our control. As a result, we cannot assure you that our new stores will achieve our target results.
Connected Customer
We aim to elevate the total customer experience through our website FloorandDecor.com. Growing our e-commerce sales provides us with additional opportunity to enhance our connected customer experience. Home renovation and remodeling projects typically require significant investments of time and money from our DIY customers, and they consequently plan their projects carefully and conduct extensive research online. FloorandDecor.com is an important tool for engaging our DIY customers throughout this process, educating them on our product offerings and providing them with design ideas. Our Pro customers use the website and our Pro app to browse our broad product assortment, to continually educate themselves on new techniques and trends and to share our virtual catalogue and design ideas with their customers and utilize tools such as our calculators to aid with shopping. In addition, sales associates at our call center are available to assist our customers with their projects and questions. We designed the website to be a reflection of our stores and to promote our wide selection of high quality products and low prices. To this end, we believe the website provides not only the same region-specific product selection that customers can expect in our stores, but also the opportunity to extend our assortment by offering our entire portfolio of products.
In addition to highlighting our broad product selection, we believe FloorandDecor.com offers a convenient opportunity for customers to purchase products online and pick them up in our stores. Approximately 79% of our e-commerce sales are picked up in-store. As we continue to grow, we believe connected customer will become an increasingly important part of our strategy, and the investments we made in our connected customer strategy were particularly beneficial during the COVID-19 pandemic.
Marketing and Advertising
We use a multi-platform approach to increasing Floor & Decor’s brand awareness, while historically maintaining a low average advertising to net sales ratio of approximately 3%. We use traditional advertising media, combined with social media and online marketing, to share the Floor & Decor story with a growing audience. We take the same customized approach with our marketing as we do with our product selection; each region has a varied media mix based on local trends and what we believe will most efficiently drive sales. To further enhance our targeting efforts, our store managers have input into their respective stores’ marketing spend.
A key objective of our messaging is to make people aware of our stores, products and services. Based on our internal research, we estimate the conversion rate from a customer visiting one of our stores or our website to purchasing our products is 84%.
As part of our focus on local markets, our stores have events that promote Floor & Decor as a hub for the local home improvement community. We feature networking events for Pro customers, giving them a chance to meet our sales teams, interact with others in the home improvement industry and learn about our newest products. For DIY customers, we regularly offer how-to classes on product installation. We believe these events serve to raise the profile of the Floor & Decor stores in our communities while showcasing our tremendous selection of products and services.
We want our customers to have a great experience at their local Floor & Decor store. Through our TV and radio commercials, print and outdoor ads, in-store flyers, online messaging and community events, we show our customers that we are a trusted resource with a vast selection, all at a low price.
Sourcing
Floor & Decor has a well-developed and geographically diverse supplier base. We source our industry leading merchandise assortment from over 240 suppliers in 24 countries. Our largest supplier accounted for 17% of our net sales in fiscal 2021, while no other individual supplier accounted for more than 6% of our net sales. We are focused on bypassing agents, brokers, distributors, and other middlemen in our supply chain in order to reduce costs and lead time. We believe that our direct sourcing model and the resulting relationships we have developed with our suppliers are distinct competitive advantages. The cost savings we achieve by directly sourcing our merchandise enable us to offer our customers low prices.
We have established a Global Sourcing and Compliance Department to, among other things, develop and implement policies and procedures in order to address compliance with appropriate regulatory bodies, including compliance with the requirements of the Lacey Act, CARB, and the EPA. We utilize third-party consultants for audits, testing, and surveillance to ensure product safety and compliance. We have invested in technology and personnel to collaborate throughout the entire supply chain process. Additionally, our close relationships with suppliers allow us to collaborate with them directly to develop and quickly introduce innovative and quality products that meet our customers’ evolving tastes and preferences at low prices.
Distribution and Order Fulfillment
Merchandise inventory is our most significant working capital asset and is considered “in-transit” or “available for sale”, based on whether we have physically received the products at an individual store location or in one of our four distribution centers. In-transit inventory generally varies due to contractual terms, country of origin, transit times, international holidays, weather patterns and other factors, but approximately 25% of our inventory is in-transit, while roughly 75% is available for sale in our stores or at one of our four distribution centers.
We have invested significant resources to develop and enhance our distribution network. We have four distribution centers strategically located across the United States in port cities near Savannah, Georgia; Houston, Texas; Los Angeles, California; and Baltimore, Maryland. Third-party brokers arrange the shipping of our international and domestic purchases to our distribution centers and stores and bill us for shipping costs according to the terms of the purchase agreements with our suppliers. We are typically able to transport inventory from our distribution centers to our stores in less than one week. This turnaround time enhances our ability to maintain project-ready quantities of the products stocked in our stores. All of our distribution centers are Company-operated facilities, and we have implemented a warehouse management and transportation management system tailored to our unique needs across all four distribution centers. We believe this system helps service levels, reduces shrinkage and damage, helps us better manage our inventory, and allows us to better implement our connected customer initiatives.
We began operating a 1.5 million square foot leased distribution center in Baltimore, Maryland in the fourth quarter of fiscal 2019. We completed the relocation of our existing distribution center near Houston, Texas to a larger distribution center in the Houston area in January of fiscal 2022. We plan to continue to seek further opportunities to enhance our distribution capabilities and align them with our strategic growth initiatives.
Management Information Systems
We believe that technology plays a crucial role in the continued growth and success of our business. We have sought to integrate technology into all facets of our business, including supply chain, merchandising, store operations, point-of-sale, e-commerce, finance, accounting and human resources. The integration of technology allows us to analyze the business in real time and react accordingly. Our sophisticated inventory management system is our primary tool for forecasting, placing orders and managing in-stock inventory. The data-driven platform includes sophisticated forecasting tools based on historical trends in sales, inventory levels and vendor lead times at the store and distribution center level by SKU, allowing us to support store managers in their regional merchandising efforts. We rely on the forecasting accuracy of our system to maintain the in-stock, project-ready quantities that our customers rely on. In addition, our employee training certifications are entirely electronic, allowing us to effectively track the competencies of our staff and manage talent across stores. We believe that our systems are sufficiently scalable to support the continued growth of the business.
Competition
The retail hard surface flooring market is highly fragmented and competitive. We face significant competition from large home improvement centers, national and regional specialty flooring chains and independent flooring retailers. Some of our competitors are organizations that are larger, are better capitalized, have existed longer, have product offerings that extend beyond hard surface flooring and related accessories, and have a more established market presence with substantially greater financial, marketing, personnel and other resources than we have. In addition, while the hard surface flooring category has a relatively low threat of new internet-only entrants due to the nature of the product, the growth opportunities presented by e-commerce could outweigh these challenges and result in increased competition in this portion of our connected customer strategy. Further, because the barriers to entry into the hard surface flooring industry are relatively low, manufacturers and suppliers of flooring and related products, including those whose products we currently sell, could enter the market and start directly competing with us.
We believe that the key competitive factors in the retail hard surface flooring industry include:
•product assortment;
•product innovation;
•in-store availability of products in project-ready quantities;
•product sourcing;
•product presentation;
•customer service;
•store management;
•store location; and
•low prices.
We believe that we compete favorably with respect to each of these factors by providing a highly diverse selection of products to our customers, at an attractive value, in appealing and convenient retail stores.
Our Structure
Floor & Decor Holdings, Inc. was incorporated as a Delaware corporation in October 2010 in connection with the acquisition of Floor & Decor Outlets of America, Inc. (“F&D”) in November 2010 by our previous sponsor owners.
The following chart illustrates our current corporate structure:
Human Capital
We have built a strong team of employees to support our continued success. Each of our stores is led by a CEM and is supported by an operations manager, product category department managers, a design team, a Pro sales and support team, and a number of additional associates. Outside of our stores, we have employees dedicated to corporate, store support, infrastructure, e-commerce, call center and similar functions as well as support for our distribution centers and sourcing office. We dedicate significant resources to training our employees and believe they are key to our success. Our Chief Human Resources Officer, supported by the entire executive team, is responsible for developing and executing our human capital strategy. This includes the attraction, acquisition, development and engagement of talent and the design of associate compensation and benefits programs.
As of December 30, 2021, we had 10,566 employees, 7,986 of whom were full-time and none of whom were represented by a union. Of the total employees, 9,201 work in our stores, 921 work in corporate, store support, customer care or similar functions, 432 work in distribution centers, and 12 work in our Asia sourcing office in Shanghai, China. We believe that we have good relations with our employees.
We look at a variety of measures and objectives related to the development, attraction, safety, engagement, and retention of our employees, including:
•Store Staffing. In order to provide the level of customer service that we expect, it is important that we adequately staff our stores with trained employees. During fiscal 2021, we faced challenges recruiting staff for certain of our stores due to the ongoing impact of the COVID-19 pandemic and a challenging labor market. In response, we invested in Divisional Managers of Workforce & Talent to focus on supporting our stores in their staffing needs. As of December 30, 2021, the majority of our stores were staffed at a level that we deem appropriate.
•Diversity, Equity & Inclusion. We are mindful of the benefits of diversity, equity and inclusion in all aspects of the employment cycle and believe they are key to our culture and long-term success. We seek to build a diverse and inclusive workplace where we can leverage our collective talents, striving to ensure that all associates are treated with dignity and respect. In 2021, we significantly expanded the size of our Diversity, Equity & Inclusion team to lead our diversity and inclusion efforts.
•Training. We believe that training associates is also important to ensuring appropriate levels of customer service. We have a Learning Department, and in 2021, associates engaged in approximately 162,360 hours of training.
•Internal Advancement Opportunities. We believe our growth opportunities are a critical way to attract and retain employees, and we encourage a promote-from-within environment when internal resources permit. In 2021, 1,674 employees were promoted to more senior positions.
•Safety. Maintaining a safe shopping environment is very important to us. We have worked to ensure our stores are safe environments for both our customers and employees and in response to the COVID-19 pandemic, we introduced various safety measures and protocols consistent with guidance from the Centers for Disease Control and state and local health authorities.
•Rewards. We believe in rewarding our associates for their hard work on behalf of Floor & Decor and provide a variety of incentives to allow associates to share in the Company’s success, including (i) incentive compensation plans for all associates, (ii) a 401(k) plan with Company-sponsored match, (iii) health care benefits for full-time associates, (iv) an employee stock purchase plan that facilitates purchases of Company stock by eligible associates, and (v) other benefits such as an employee assistance program.
Government Regulation
We are subject to extensive and varied federal, state and local laws and regulations, including those relating to employment, the environment, protection of natural resources, import and export, advertising, labeling, public health and safety, product safety, zoning and fire codes. We operate our business in accordance with standards and procedures designed to comply with applicable laws and regulations. Compliance with these laws and regulations has not historically had a material effect on our financial condition or operating results; however, the effect of compliance in the future cannot be predicted.
Our operations and properties are also subject to federal, state and local laws and regulations governing the environment, environmental protection of natural resources and health and safety, including the use, storage, handling, generation, transportation, treatment, emission, release, discharge and disposal of hazardous materials, substances and wastes and relating to the investigation and clean-up of contaminated properties. Except to the extent of the capital expenditures related to our initiatives described below, compliance with these laws and regulations has not historically had a material effect on our financial condition or operating results, but we cannot predict the effect of compliance in the future.
In particular, certain of our products are subject to laws and regulations relating to the importation, exportation, acquisition or sale of certain plants and plant products, including those illegally harvested (which is prohibited by the Lacey Act), and the emissions of hazardous materials (which in California is governed by regulations promulgated by CARB and federally by regulations promulgated by the EPA). We have established a Global Sourcing and Compliance Department to, among other things, address these requirements, and we work with third-party consultants to assist us in designing and implementing compliance programs relating to the requirements of the Lacey Act, CARB and the EPA. Further, we could incur material compliance costs or be subject to compliance liabilities or claims in the future, especially in the event new laws or regulations are adopted or there are changes in existing laws and regulations or in their interpretation.
Our suppliers are also subject to the laws and regulations of their home countries, including in particular laws regulating forestry and the environment. We also support social and environmental responsibility among our supplier community and endeavor to enter into vendor agreements with our suppliers that contain representations and warranties concerning environmental, labor and health and safety matters.
Insurance and Risk Management
We use a combination of insurance and self-insurance to provide for potential liability for workers’ compensation, general liability, product liability, director and officers’ liability, team member healthcare benefits, and other casualty and property risks. Changes in legal trends and interpretations, variability in inflation rates, changes in workers’ compensation and general liability premiums and deductibles, changes in the nature and method of claims settlement, benefit level changes due to changes in applicable laws, insolvency of insurance carriers, and changes in discount rates could all affect ultimate settlements of claims. We evaluate our insurance requirements on an ongoing basis to ensure we maintain adequate levels of coverage.
Legal Proceedings
We are engaged in various legal actions, claims and proceedings arising in the ordinary course of business, including claims related to breach of contracts, products liabilities, intellectual property matters and employment related matters resulting from our business activities. As with most actions such as these, an estimation of any possible and/or ultimate liability cannot always be determined. Regardless of the outcome, litigation can have an adverse impact on us because of defense and settlement costs, diversion of management resources, and other factors.
Trademarks and other Intellectual Property
As of February 24, 2022, we have 76 registered marks and several pending trademark applications in the United States. We regard our intellectual property, including our over 60 proprietary brands, as having significant value, and our brand is an important factor in the marketing of our products. Accordingly, we have taken, and continue to take, appropriate steps to protect our intellectual property.
Available Information
We maintain a website at www.FloorandDecor.com. The information on or available through our website is not, and should not be considered, a part of this Annual Report. You may access our annual reports on Form 10-K, quarterly reports on Form 10-Q, current reports on Form 8-K and amendments to those reports, as well as other reports relating to us that are filed with, or furnished to, the SEC free of charge on our website as soon as reasonably practicable after such material is electronically filed with, or furnished to, the SEC.
Summary of Risk Factors
The following is a summary of the principal risks that you should carefully consider before investing in our securities. In addition, see “Risk Factors” set forth in Item 1A. of this Annual Report and other reports and documents filed by us with the SEC for a more detailed discussion of the principal risks as well as certain other risks you should carefully consider before deciding to invest in our securities.
•The hard surface flooring industry depends on the overall health of the economy, including home remodeling activity and other important factors.
•We may not be able to offset higher costs associated with inflation and other general cost increases.
•Our growth and profitability depend on the levels of consumer confidence and spending.
•Any disruption in our distribution capabilities, supply chain or our related planning and control processes may adversely affect our business, financial condition, and operating results.
•Any failure by us to successfully anticipate trends may lead to loss of consumer acceptance of our products, resulting in reduced net sales.
•If we fail to successfully manage the challenges that our planned new store growth poses or encounter unexpected difficulties during our expansion, our operating results and future growth opportunities could be adversely affected.
•Our future success is dependent on our ability to execute our business strategy effectively and deliver value to our customers.
•If we are unable to enter into leases for additional stores on acceptable terms or renew or replace our current store leases, or if one or more of our current leases is terminated prior to expiration of its stated term, and we cannot find suitable alternate locations, our growth and profitability could be adversely affected.
•Our success depends upon our ability to attract, train, and retain highly qualified managers and staff.
•Our success depends substantially upon the continued retention of our key personnel, including our executive officers.
•The COVID-19 pandemic may negatively impact our business and results of operations. Additional governmental restrictions on business operations, including as a result of a further resurgence of the COVID-19 pandemic, could have a negative impact on our net sales, results of operations, financial position, store operations, new store openings and earnings.
•U.S. policies related to global trade and tariffs, including with respect to antidumping and countervailing duties, could adversely affect our business, financial condition and results of operations.
•Our net sales growth could be adversely affected if comparable store sales growth is less than we expect.
•We depend on a number of suppliers, and any failure by any of them to supply us with quality products on attractive terms and prices may adversely affect our business, financial condition and operating results.
•We procure the majority of our products from suppliers located outside of the United States, and as a result, we are subject to risks associated with obtaining products from abroad that could adversely affect our business, financial condition and results of operations.
•Our ability to offer compelling products, particularly products made of more exotic species or unique stone, depends on the continued availability of sufficient suitable natural products.
•If the use of “cookie” tracking technologies is further restricted, the amount of internet user information we collect would decrease, which could require additional marketing efforts and harm our business and operating results.
•Our business exposes us to personal injury, product liability and warranty claims and related governmental investigations, which could result in negative publicity, harm our brand and adversely affect our business, financial condition and operating results.
•Unfavorable allegations, government investigations and legal actions surrounding our products and us could harm our reputation, impair our ability to grow or sustain our business, and adversely affect our business, financial condition and operating results.
•Federal, state or local laws and regulations, or our failure to comply with such laws and regulations, could increase our expenses, restrict our ability to conduct our business and expose us to legal risks.
•Labor activities could cause labor relations difficulties for us.
•If our efforts to protect the privacy and security of information related to our customers, us, our associates, our suppliers and other third parties are not successful, we could become subject to litigation, investigations, liability and negative publicity that could significantly harm our reputation and relationships with our customers and adversely affect our business, financial condition and operating results.
• We may not be able to successfully maintain effective internal controls over financial reporting, which could have an adverse effect on our business and stock price.
•Changes in tax laws, trade policies and regulations or in our operations and newly enacted laws or regulations may impact our effective tax rate or may adversely affect our business, financial condition and operating results.
•We are subject to payments-related risks that could increase our operating costs, expose us to fraud, subject us to potential liability and potentially disrupt our business.
•Our facilities and systems, as well as those of our suppliers, are vulnerable to natural disasters and other unexpected events, and as a result we may lose merchandise and be unable to effectively deliver it to our stores.
•Our intellectual property rights are valuable, and any failure to protect them could reduce the value of our products and brand and harm our business.
•The effectiveness of our advertising strategy is a driver of our future success.
•We are a holding company with no business operations of our own and depend on cash flow from our subsidiaries to meet our obligations.
•We face risks related to our indebtedness.
•We are exposed to credit risk on certain of our receivables and the inability or failure to collect outstanding credit, specifically from our existing customers under our commercial credit program, could result in losses and adversely affect our operating results.
•Our business, financial condition and operating results are dependent on general economic conditions and discretionary spending by our customers, which in turn are affected by a variety of factors beyond our control. If such conditions deteriorate, our business, financial condition, and operating results may be adversely affected.
•We are engaged in various legal actions, claims and proceedings arising in the ordinary course of business, and while we cannot predict the outcomes of such proceedings and other contingencies with certainty, this litigation and any potential future litigation could have an adverse impact on us.
•We are subject to risks related to corporate social responsibility.
ITEM 1A. RISK FACTORS.
You should carefully consider the risks described below, together with all of the other information included in this Annual Report, including our consolidated financial statements and the related notes thereto, before making an investment decision. The risks and uncertainties set out below are not the only risks we face. Additional risks and uncertainties not currently known to us or that we currently deem to be immaterial also may materially and adversely affect our business, financial condition, and operating results. If any of the following events occur, our business, financial condition, and operating results could be materially and adversely affected. In that case, the trading price of our common stock could decline, and you may lose all or part of your investment.
Risks Related to our Business
The hard surface flooring industry depends on the overall health of the economy, including home remodeling activity and other important factors.
The hard surface flooring industry is highly dependent on the remodeling of existing homes, businesses and, to a lesser extent, new home construction. In turn, remodeling and new home construction depend on a number of factors that are beyond our control, including interest rates, inflation, tax policy, trade policy, employment levels, consumer confidence, credit availability, real estate prices, existing home sales, demographic trends, trends in response to the COVID-19 pandemic, weather conditions, natural disasters and general economic conditions. In particular:
•interest rates and inflation could continue to rise, undermining consumer confidence and eroding discretionary income;
•home-price appreciation could slow or turn negative;
•regions where we have stores that could be impacted by hurricane, fire, or other natural disasters (including those due to the effects of climate change such as increased storm severity, drought, wildfires, and potential flooding due to rising sea levels and storm surges);
•increased demand for home improvement products could lessen as the COVID-19 pandemic subsides, causing consumers to spend discretionary income in other ways;
•credit could become less available;
•tax rates and/or health care costs could increase; or
•fuel costs or utility expenses could increase.
Any one or a combination of these factors could result in decreased demand for our products, reduce spending on homebuilding or remodeling of existing homes or cause purchases of new and existing homes to decline. While the vast majority of our net sales are derived from home remodeling activity as opposed to new home construction, a decrease in any of these areas would adversely affect our business, financial condition and operating results.
We may not be able to offset higher costs associated with inflation and other general cost increases.
We are subject to inflationary and other general cost increases, including with regard to our labor costs and purchases of raw materials and transportation services. General economic conditions may result in higher inflation, which may increase our exposure to higher costs. If we are unable to offset these cost increases by price increases, growth, and/or cost reductions in our operations, these inflationary and other general cost increases could have a material adverse effect on our operating cash flows, profitability, and liquidity.
Our growth and profitability depend on the levels of consumer confidence and spending.
Our results of operations are sensitive to changes in overall economic and political conditions that impact consumer spending, including discretionary spending. Many economic factors outside of our control, including inflation, conditions in the housing market, interest rates, energy costs, consumer credit availability and terms, consumer debt levels, tax rates and policy, salaries and wage rates, unemployment trends, geopolitical events and uncertainty, influence consumer confidence and spending. Declines in the level of consumer confidence and spending, a general slowdown in the U.S. economy or an uncertain economic outlook could adversely affect consumer spending habits, which may result in, among other things, reduced demand for our products, which would have an adverse effect on our sales and operations results.
Any disruption in our distribution capabilities, supply chain or our related planning and control processes may adversely affect our business, financial condition, and operating results.
Our success is highly dependent on our planning and distribution infrastructure, which includes the ordering, transportation, and distribution of products to our stores and the ability of suppliers to meet distribution requirements. We also need to ensure that we continue to identify and improve our processes and supply chain and that our distribution infrastructure and supply chain keep pace with our anticipated growth and increased number of stores. The cost of these enhanced processes could be significant and any failure to maintain, grow, or improve them could adversely affect our business, financial condition, and operating results. Due to our rapid expansion, we have had to significantly increase the size of our distribution centers, including opening a 1.5 million square foot distribution center in Maryland in the fourth quarter of fiscal 2019, an expanded distribution center in Houston in the first quarter of 2022, and a new transload facility in Los Angeles in fiscal 2021. Based on our growth intentions, we plan to add additional distribution centers or increase the size of our existing distribution centers in the future. Increasing the size of our distribution centers may decrease the efficiency of our distribution costs.
We manage our four distribution centers internally rather than rely on independent third-party logistics providers. If we are not able to manage our distribution centers successfully or at a lower cost than with third-party logistics providers, it could adversely affect our business, financial condition, and operating results. As we continue to add distribution centers, we may incur unexpected costs, and our ability to distribute our products may be adversely affected. Any disruption in the transition to or operation of our distribution centers could have an adverse impact on our business, financial condition, and operating results. For example, the landlord for our Maryland distribution center has identified a construction defect with that facility that we are working with the landlord to address. While we are unable to predict the impact such defect could have on our business, any necessary repairs could cause disruption in the operation of that distribution center, which could negatively impact the in-stock positions in the stores served by such distribution center and could have an adverse impact on our business, financial condition, and operating results.
A disruption within our logistics or supply chain network could adversely affect our ability to deliver inventory in a timely manner, which could impair our ability to meet customer demand for products and result in lost sales, increased supply chain costs, or damage to our reputation. Such disruptions may result from damage or destruction to our distribution centers; weather-related events; natural disasters; international trade disputes or trade policy changes or restrictions; tariffs or import-related taxes; third-party strikes, lock-outs, work stoppages or slowdowns; shortages of supply chain labor, including truck drivers; shipping capacity constraints, including shortages of related equipment; third-party contract disputes; supply or shipping interruptions or costs; military conflicts; acts of terrorism; public health issues, including pandemics or quarantines (such as the COVID-19 pandemic) and related shut-downs, re-openings, or other actions by the government; civil unrest; or other factors beyond our control. In recent years, U.S. ports have been impacted by capacity constraints, port congestion and delays, periodic labor disputes, security issues, weather-related events, and natural disasters, which have been further exacerbated by the pandemic. Disruptions to our supply chain due to any of the factors listed above could negatively impact our financial performance or financial condition.
Accordingly, we have assessed and are implementing supply chain continuity plans. While to date there has been no material impact on supply for most of our sourced merchandise, COVID-19-related labor shortages and supply chain disruptions continue to cause logistical challenges for us and the entire hard surface flooring industry. In particular, the significant congestion at ports of entry to the United States is increasing the time and cost to ship goods to our stores. Additionally, customer demand for certain products has also fluctuated as the COVID-19 pandemic has progressed and customer behaviors have changed, which has challenged our ability to anticipate and/or adjust inventory levels to meet that demand. These factors have resulted in certain of our products having in-stock levels below our goals. In certain cases, we are also experiencing delays in delivering those products to our distribution centers, stores or customers. Recently, we have seen a significant increase in supply chain costs, and we do not know how long this will last. It is our belief that we can pass along these costs. While we are working closely with our suppliers and transportation partners to mitigate the impact of these disruptions, future capacity shortages or shipping cost increases could have an adverse impact upon our business. Our success is also dependent on our ability to provide timely delivery to our customers. Our business could also be adversely affected if fuel prices increase or there are delays in product shipments due to freight difficulties, inclement weather, strikes by our associates or associates of third parties involved in our supply chain, or other difficulties. If we are unable to deliver products to our customers on a timely basis, they may decide to purchase products from our competitors instead of from us, which would adversely affect our business, financial condition, and operating results.
Any failure by us to successfully anticipate trends may lead to loss of consumer acceptance of our products, resulting in reduced net sales.
Each of our stores is stocked with a customized product mix based on consumer demands in a particular market. Our success therefore depends on our ability to anticipate and respond to changing trends and consumer demands in these markets in a timely manner. If we fail to identify and respond to emerging trends, consumer acceptance of our merchandise and our image with current or potential customers may be harmed, which could reduce our net sales. Additionally, if we misjudge market trends, we may significantly overstock unpopular products, incur excess inventory costs and be forced to reduce the sales price of such products or incur inventory write-downs, which would adversely affect our operating results. Conversely, shortages of products that prove popular could also reduce our net sales through missed sales and a loss of customer loyalty.
If we fail to successfully manage the challenges that our planned new store growth poses or encounter unexpected difficulties during our expansion, our operating results and future growth opportunities could be adversely affected.
We have 160 warehouse-format stores and two small-format standalone design studios located throughout the United States as of December 30, 2021. We plan to open 32 warehouse-format stores during fiscal 2022 and to increase the number of new stores that we open during each of the next several years thereafter. This growth strategy and the investment associated with the development of each new store may cause our operating results to fluctuate and be unpredictable or decrease our profits. We cannot ensure that store locations will be available to us, or that they will be available on terms acceptable to us. If additional retail store locations are unavailable on acceptable terms, we may not be able to carry out a significant part of our growth strategy or our new stores’ profitability may be lower. Certain of our new store openings are expected to be smaller stores in smaller markets. We have limited experience executing this strategy, and we cannot guarantee that we will be successful in this strategy. Our future operating results and ability to grow will depend on various other factors, including our ability to:
•successfully select new markets and store locations;
•attract, train and retain highly qualified managers and staff;
•maintain our reputation of providing quality, safe and compliant products; and
•manage store opening costs.
In addition, consumers in new markets may be less familiar with our brand, and we may need to increase brand awareness in such markets through additional investments in advertising or high cost locations with more prominent visibility. Stores opened in new markets may have higher construction, occupancy or operating costs, or may have lower net sales, than stores opened in the past. In addition, laws or regulations in these new markets may make opening new stores more difficult or cause unexpected delays. Newly opened stores may not succeed or may reach profitability more slowly than we expect, and the ramp-up to profitability may become longer in the future as we enter more markets and add stores to markets where we already have a presence. Future markets and stores may not be successful and, even if they are successful, our comparable store sales may not increase at historical rates. To the extent that we are not able to overcome these various challenges, our operating results and future growth opportunities could be adversely affected.
Increased competition could cause price declines, decrease demand for our products and decrease our market share.
We operate in the hard surface flooring industry, which is highly fragmented and competitive. We face competition from large home improvement centers, national and regional specialty flooring chains, internet-based companies and independent flooring retailers. Among other things, we compete on the basis of breadth of product assortment, low prices, and the in-store availability of the products we offer in project-ready quantities, as well as the quality of our products and customer service. As we expand into new and unfamiliar markets, we may experience different competitive conditions than in the past.
Some of our competitors are organizations that are larger, are better capitalized, have existed longer, have product offerings that extend beyond hard surface flooring and related accessories and have a more established market presence with substantially greater financial, marketing, delivery, customer loyalty, personnel and other resources than we have. In addition, while the hard surface flooring category has a relatively low threat of new internet-only entrants due to the nature of the product, the growth opportunities presented by e-commerce could outweigh these challenges and result in increased competition. Competitors may forecast market developments more accurately than we do, offer similar products at a lower cost, have better delivery offerings, or adapt more quickly to new trends and technologies or evolving customer requirements than we do. Further, because the barriers to entry into the hard surface flooring industry are relatively low, manufacturers and suppliers of flooring and related products, including those whose products we currently sell, could enter the market and start directly competing with us. Intense competitive pressures from any of our present or future competitors could cause price declines, decrease demand for our products and decrease our market share. Also, if we continue to grow and become more well-known, other companies may change their strategies to present new competitive challenges. Moreover, in the future, changes in consumer preferences may cause hard surface flooring to become less popular than other types of floor coverings. Such a change in consumer preferences could lead to decreased demand for our products.
All of these factors may harm us and adversely affect our net sales, market share, and operating results.
Our operating results may be adversely affected by increases in material, energy and transportation costs beyond our control, including increases in costs due to inflation.
Our operating results may be affected by the wholesale prices of hard surface flooring products, setting and installation materials, and the related accessories that we sell. These prices may increase based on a number of factors beyond our control, including the price of raw materials used in the manufacture of hard surface flooring, transportation costs, energy costs, changes in supply and demand, concerns about inflation, general economic conditions, labor costs, competition, import duties, tariffs, currency exchange rates, government regulation, the impact of natural disasters (including those due to the effects of climate change), duty and other import costs. In particular, energy costs have increased dramatically in the past and may fluctuate in the future. These increases may result in an increase in our transportation and supply chain costs for distribution from the manufacturer to our distribution centers and from our distribution centers to our retail stores, utility costs for our distribution centers and retail stores, and overall costs to purchase products from our suppliers. A material component of the cost of our product includes transportation costs to move the product from the manufacturer to our stores, and there have been recent capacity constraints. These costs could increase and have a material impact on inventory and cost of sales. Recently, there has been a substantial rise in international container and, to a lesser extent, domestic trucking costs, and if we are not able to raise retail prices, it could have a negative impact on our cost of sales.
We may not be able to adjust the prices of our products, especially in the short-term, to recover these cost increases, and a continual rise in such costs could adversely affect consumer spending and demand for our products and increase our operating costs, both of which could adversely affect our business, financial condition and operating results.
Our future success is dependent on our ability to execute our business strategy effectively and deliver value to our customers.
We believe our future success will depend on our ability to execute our business strategy effectively and deliver value to our customers. We believe that our breadth of product assortment across a variety of hard surface flooring categories, low prices, and in-store availability of the products we offer in project-ready quantities, as well as the quality of our products and customer service, are among the key competitive advantages and important elements of our total value proposition. If we are unsuccessful in staying competitive with our current value proposition, the demand for our products would decrease, and customers may decide to purchase products from our competitors instead of us. If this were to occur, our net sales, market share, and operating results would be adversely affected.
Our operating results may be adversely affected if we are not successful in managing our inventory.
We currently maintain a high level of inventory consisting of on average approximately 4,200 SKUs per store and an average inventory per store of approximately $2.3 million at cost in order to have a broad assortment of products across a wide variety of hard surface flooring categories in project-ready quantities. We also carry an additional $595.6 million of inventory outside our stores, primarily at our distribution centers, as of the end of fiscal 2021. The investment associated with this high level of inventory is substantial, and efficient inventory management is a key component of our business success and profitability. If we fail to adequately project the amount or mix of our inventory, we may miss sales opportunities or have to take unanticipated markdowns or hold additional clearance events to dispose of excess inventory, which will adversely affect our operating results.
In the past, we have incurred costs associated with inventory markdowns and obsolescence. Due to the likelihood that we will continue to incur such costs in the future, we generally include an allowance for such costs in our projections. However, the costs that we actually incur may be substantially higher than our estimate and adversely affect our operating results.
If we are unable to enter into leases for additional stores on acceptable terms or renew or replace our current store leases, or if one or more of our current leases is terminated prior to expiration of its stated term, and we cannot find suitable alternate locations, our growth and profitability could be adversely affected.
We currently lease the majority of our store locations and our store support center. Our growth strategy largely depends on our ability to identify and open future store locations, which can be difficult because our warehouse-format stores in major metropolitan markets generally require at least 60,000 square feet of floor space. Our ability to negotiate acceptable lease terms for these store locations, to re-negotiate acceptable terms on expiring leases or to negotiate acceptable terms for suitable alternate locations could depend on conditions in the real estate market, competition for desirable properties, our relationships with current and prospective landlords, or on other factors that are not within our control. We also intend to purchase the real property for a small number of new locations, and such strategy may not be successful. Any or all of these factors and conditions could adversely affect our growth and profitability.
Our success depends upon our ability to attract, train, and retain highly qualified managers and staff.
Our success depends in part on our ability to attract, hire, train and retain qualified managers and staff. Purchasing hard surface flooring is an infrequent event for consumers, and the typical consumer in these groups has limited knowledge of the range, characteristics and suitability of the products available before starting the purchasing process. Therefore, consumers in the hard surface flooring market expect to have sales associates serving them who are knowledgeable about the entire assortment of products offered by the retailer and the process of choosing and installing hard surface flooring.
Each of our stores is managed by a store manager who has the flexibility (with the support of regional managers) to use his or her knowledge of local market dynamics to customize each store in a way that is most likely to increase net sales and profitability. Our store managers are also expected to anticipate, gauge and quickly respond to changing consumer demands in these markets. Further, it generally takes a substantial amount of time for our store managers to develop the entrepreneurial skills that we expect them to have in order to make our stores successful.
There is an increased level of competition for qualified regional managers, store managers and sales associates among home improvement and flooring retailers in local markets, and as a result, we may not succeed in attracting and retaining the personnel we require to conduct our current operations and support our plans for expansion. In addition, we compete with other retail businesses for many of our associates in hourly positions, and we invest significant resources in training and motivating them to maintain a high level of job satisfaction. These positions have historically had high turnover rates, which can lead to increased training and retention costs, particularly in a tight labor market.
The COVID-19 pandemic has exacerbated staffing complexities for us and most retailers, creating a number of factors that may adversely affect our ability to acquire and retain personnel and our related costs, including: challenges staffing store associate positions, federal unemployment subsidies and benefits offered in response to the COVID-19 pandemic, wage inflation and pressure to improve benefits, increased associate absenteeism due to illness and quarantine and increased associate attrition. These factors led to associate shortages and increased labor costs on a relative basis in fiscal 2021.
If our recruiting and retention efforts are not successful, we may have or continue to have a shortage of qualified associates in future periods. Any such shortage would decrease our ability to effectively serve our customers. Such a shortage would also likely lead to higher wages for associates and a corresponding reduction in our operating results. In addition, as we expand into new markets, we may find it more difficult to hire, develop, and retain qualified associates and may experience increased labor costs. Any failure by us to attract, train, and retain highly qualified managers and staff could adversely affect our operating results and future growth opportunities, and any increased labor costs due to competition, increased minimum wage, associate benefit costs (including various federal, state, and location actions to increase minimum wages), unionization activity, or other factors would adversely impact our operating expenses.
Our success depends substantially upon the continued retention of our key personnel, including our executive officers.
We believe that our success has depended and continues to depend to a significant extent on the efforts and abilities of our key personnel, including our executive officers. Our failure to retain members of that team could impede our ability to build on the efforts they have undertaken with respect to our business.
In August 2021, we announced that Lisa G. Laube, our President, intends to retire on April 30, 2022, and we have launched a succession process but have not yet finalized those plans. We may incur significant costs, and our businesses may experience disruption in the process of recruiting any new key personnel and during the subsequent transition period.
The COVID-19 pandemic may negatively impact, our business and results of operations. Additional governmental restrictions on business operations, including as a result of a further resurgence of the COVID-19 pandemic, could have a negative impact on our net sales, results of operations, financial position, store operations, new store openings and earnings.
On March 11, 2020, the World Health Organization announced that infections of COVID-19 had become a pandemic, and on March 13, 2020, the U.S. President announced a National Emergency relating to the COVID-19 pandemic. The extent of the impact of the pandemic, on the Company’s business and financial results will depend on future developments, including the duration of the pandemic, the success of vaccination programs, the spread of COVID-19, including its developing variants, within the markets in which the Company operates, as well as the countries from which the Company sources inventory, fixed assets, and other supplies, the effect of the pandemic on consumer confidence and spending, and actions taken by government entities in response to the pandemic, all of which are highly uncertain. Even after the COVID-19 pandemic subsides, the U.S. economy and most other major global economies may experience or continue to experience a recession, and our business and operations could be materially adversely affected by a prolonged recession in the U.S. and other major markets.
The COVID-19 pandemic and initial responses had an adverse effect on our customer traffic, sales, operating costs, and profit during the first two quarters of fiscal 2020 and may have such an impact again in the future. We cannot predict how long the COVID-19 pandemic will last, whether we will be required to re-close stores or what other government responses may occur. The COVID-19 pandemic has also adversely affected our ability to staff our existing stores and open new stores, and we have experienced construction delays. While our stores saw increased sales and order activity in the final two quarters of fiscal 2020 and all quarters of fiscal 2021, those results, as well as those of other metrics such as net revenues, gross margins and other financial and operating data, may not be indicative of results for future periods. Additionally, such increased demand may increase beyond manageable levels, may fluctuate significantly, or may not continue, including the possibility that demand may decrease from historical levels.
Our operations have been and could be further disrupted if more of our associates are diagnosed with COVID-19 since this could require us to quarantine some or all of a store’s associates. If a significant percentage of our workforce is unable to work, whether because of illness, quarantine, limitations on travel or other government restrictions in connection with COVID-19, our operations may be negatively impacted, potentially affecting our liquidity, financial condition or results of operations. In addition, the COVID-19 pandemic has made it difficult to hire and retain a sufficient number of store associates in many of our stores. If we are unable to hire and retain a sufficient number of store associates or if there are insufficient existing store associates not subject to quarantine, we may need to reduce store hours or temporarily close stores.
Our suppliers have been and could also be further adversely impacted by the COVID-19 pandemic. If our suppliers’ associates are unable to work, whether because of illness, quarantine, limitations on travel or other government restrictions in connection with the COVID-19 pandemic, we could face further shortages of inventory at our stores, and our operations and sales could be adversely impacted by such supply interruptions.
Our business may be further negatively impacted by the fear of exposure to or actual effects of the COVID-19 pandemic or another disease pandemic, epidemic, or similar widespread public health concern; these impacts may include but are not limited to:
•reduced workforces, which may be caused by, but not limited to, the temporary inability of the workforce to work due to illness, quarantine, or government mandates or the inability to sufficiently staff our stores;
•global inflationary pressures, particularly on energy costs and commodities, which could continue to negatively impact our supply chain costs and the cost of the products we sell;
•additional temporary store closures due to reduced workforces or government mandates or the need to utilize a curbside pickup model or otherwise modify our operations;
•failure of third parties on which we rely, including our suppliers, contract manufacturers, contractors, commercial banks and external business partners to meet their obligations to the company, or significant disruptions in their ability to do so which may be caused by their own financial or operational difficulties and may adversely impact our operations;
•supply chain risks such as scrutiny or embargoing of goods produced in infected areas;
•construction delays or halts, preventing us from opening new stores;
•liquidity strains, which could slow the rate at which we open new stores;
•inability of our key leaders to visit our stores, which could negatively impact customer service and associate morale;
•increased cybersecurity risks due to the number of associates working remotely;
•increased litigation risk as a result of the pandemic; and
•reduced consumer traffic and purchasing, which may be caused by, but not limited to, the temporary inability of customers to shop with us due to illness, quarantine or other travel restrictions, or financial hardship, shifts in demand away from discretionary spending, or shifts in demand from higher priced products to lower priced products.
Any of the foregoing factors, or other cascading effects of the COVID-19 pandemic or another disease pandemic, epidemic, or similar widespread public health concern, including effects that are not currently foreseeable, could materially increase our costs, negatively impact our sales and damage our financial condition, results of operations, cash flows and our liquidity position, possibly to a significant degree. The duration of any such impacts cannot be predicted, and while it is not clear whether our current insurance policies will provide recovery for any of the impacts of the COVID-19 pandemic or any future disease pandemic, epidemic, or similar widespread public health concern, we do not anticipate that such policies will provide adequate coverage for the impacts of COVID-19 or any future disease pandemic, epidemic, or similar widespread public health concern.
U.S. policies related to global trade and tariffs, including with respect to antidumping and countervailing duties, could adversely affect our business, financial condition and results of operations.
The current domestic and international political environment, including existing and potential changes to U.S. policies related to global trade and tariffs, have resulted in uncertainty surrounding the future state of the global economy. In particular, the ongoing trade dispute between the U.S. and China has resulted in the U.S. imposing tariffs of 25% on the vast majority of the products we import from China. Approximately 30% of the products we sold in fiscal 2021 were produced in China, the majority of which are impacted by these tariffs. Any further expansion in the types or levels of tariffs implemented on China or other countries has the potential to negatively impact our business, financial condition and results of operations. Additionally, there is a risk that the U.S. tariffs on imports are met with tariffs on U.S. produced exports and that a further trade conflict could ensue, which has the potential to significantly impact global trade and economic conditions, including the imposition of new measures with little notice. Potential costs and any attendant impact on pricing arising from these tariffs and any further expansion in the types or levels of tariffs implemented could require us to modify our current business practices and could adversely affect our business, financial condition, and results of operations.
Our net sales growth could be adversely affected if comparable store sales growth is less than we expect.
While future net sales growth will depend substantially on our plans for new store openings, our comparable store sales growth is a significant driver of our net sales, profitability, cash flow, and overall business results. Because numerous factors affect our comparable store sales growth, including, among others, economic conditions, the retail sales environment, the home improvement spending environment, housing turnover, housing appreciation, interest rates, inflation, the hard surface flooring industry and the impact of competition, the ability of our customers to obtain credit, changes in our product mix, the in-stock availability of products that are in demand, changes in staffing at our stores, cannibalization resulting from the opening of new stores in existing markets, greater cannibalization than we modeled for new stores, lower than expected ramp-up in new store net sales, changes in advertising and other operating costs, weather conditions, retail trends, and our overall ability to execute our business strategy and planned growth effectively, it is possible that we will not achieve our targeted comparable store sales growth or that the change in comparable store sales could be negative. If this were to happen, it is likely that overall net sales growth would be adversely affected.
If we fail to identify and maintain relationships with a sufficient number of suppliers, our ability to obtain products that meet our high quality standards at attractive prices could be adversely affected.
We purchase flooring and other products directly from suppliers located around the world. We do not have long-term contractual supply agreements with our suppliers that obligate them to supply us with products exclusively or at specified quantities or prices. As a result, our current suppliers may decide to sell products to our competitors and may not continue selling products to us. In order to retain the competitive advantage that we believe results from these relationships, we need to continue to identify, develop and maintain relationships with qualified suppliers that can satisfy our high standards for quality and safety and our requirements for delivery of flooring and other products in a timely and efficient manner at attractive prices. The need to develop new relationships will be particularly important as we seek to expand our operations and enhance our product offerings in the future. The loss of one or more of our existing suppliers or our inability to develop relationships with new suppliers could reduce our competitiveness, slow our plans for further expansion and cause our net sales and operating results to be adversely affected.
We depend on a number of suppliers, and any failure by any of them to supply us with quality products on attractive terms and prices may adversely affect our business, financial condition and operating results.
We depend on our suppliers to deliver quality products to us on a timely basis at attractive prices. Additionally, we source the products that we sell from over 240 domestic and international suppliers. Although we purchase from a diverse supplier base, purchases from our largest supplier, which is headquartered in China, accounted for approximately 17% of our net sales in fiscal 2021. No other singular vendor supplied products representing more than 6% of net sales in fiscal 2021. If we are unable to acquire desired merchandise in sufficient quantities on terms acceptable to us, or if we experience a change in business relationship with any of our major suppliers, it could impair our relationship with our customers, impair our ability to attract new customers, reduce our competitiveness, and adversely affect our business, financial condition and operating results.
Additionally, we provide certain of our suppliers access to supply chain financing arrangements with financial institutions with whom we have relationships. The terms of such supply chain financing arrangements could be modified or canceled by such financial institutions at any time. If such programs are modified or cancelled, our suppliers may not be able to obtain alternate financing at all or on acceptable terms. If our suppliers or other participants in our supply chain experience difficulty obtaining financing in the capital and credit markets to purchase raw materials or to finance capital equipment and other general working capital needs, it may result in delays or non-delivery of shipments of our products or require us to pay our suppliers more quickly, which would have a negative impact on our cash balances.
The failure of our suppliers to adhere to the quality standards that we set for our products could lead to investigations, litigation, write-offs, recalls or boycotts of our products, which could damage our reputation and our brand, increase our costs, and otherwise adversely affect our business.
We do not control the operations of our suppliers. Although we conduct initial due diligence prior to engaging our suppliers and require our suppliers to certify compliance with applicable laws and regulations, we cannot guarantee that our suppliers will comply with applicable laws and regulations or operate in a legal, ethical and responsible manner. Additionally, it is possible that we may not be able to identify noncompliance by our suppliers notwithstanding these precautionary measures. Violation of applicable laws and regulations by our suppliers or their failure to operate in a legal, ethical or responsible manner, could expose us to legal risks, cause us to violate laws and regulations and reduce demand for our products if, as a result of such violation or failure, we attract negative publicity. In addition, the failure of our suppliers to adhere to the quality standards that we set for our products could lead to government investigations, litigation, write-offs and recalls, which could damage our reputation and our brand, increase our costs, and otherwise adversely affect our business.
We procure the majority of our products from suppliers located outside of the United States, and as a result, we are subject to risks associated with obtaining products from abroad that could adversely affect our business, financial condition and results of operations.
We procure the majority of our products from suppliers located outside of the United States. As a result, we are subject to risks associated with obtaining products from abroad, including:
•the imposition of new or different duties (including antidumping and countervailing duties), tariffs, taxes and/or other charges on exports or imports, including as a result of errors in the classification of products upon entry or changes in the interpretation or application of rates or regulations relating to the import or export of our products;
•political unrest, acts of war, terrorism and economic instability resulting in the disruption of trade from foreign countries where our products originate;
•disruption due to the public health crises such as the coronavirus;
•currency exchange fluctuations;
•the imposition of new or more stringent laws and regulations, including those relating to environmental, health and safety matters and climate change issues, labor conditions, quality and safety standards, trade restrictions, and restrictions on funds transfers;
•the risk that one or more of our suppliers will not adhere to applicable legal requirements, including fair labor standards, the prohibition on child labor, environmental, product safety or manufacturing safety standards, anti-bribery and anti-kickback laws such as the Foreign Corrupt Practices Act (the “FCPA”) and sourcing laws such as the Lacey Act;
•disruptions or delays in production, shipments, delivery or processing through ports of entry (including those resulting from strikes, lockouts, work-stoppages or slowdowns, or other forms of labor unrest);
•changes in local economic conditions in countries where our suppliers are located; and
•differences in product standards, acceptable business practice and legal environments.
Additionally, approximately 30% of the products we sold in fiscal 2021 were produced in China. The Chinese government has in the past imposed restrictions on manufacturing facilities, including a shut-down of transportation of materials and power plants to reduce air pollution. If, in the future, restrictions are imposed that include our operations, our suppliers’ ability to supply current or new orders would be significantly impacted. In addition, China has been impacted by the coronavirus, which, along with other public health crises, could impact our ability to obtain products in a timely manner. These and other factors beyond our control could disrupt the ability of our suppliers to ship certain products to us cost-effectively or at all, expose us to significant operational and legal risk and negatively affect our reputation, any of which could adversely affect our business, financial condition and results of operations.
Our ability to offer compelling products, particularly products made of more exotic species or unique stone, depends on the continued availability of sufficient suitable natural products.
Our business strategy depends on offering a wide assortment of compelling products to our customers. We sell, among other things, flooring made from various wood species and natural stone from quarries throughout the world. Our ability to obtain an adequate volume and quality of hard-to-find products depends on our suppliers’ ability to furnish those products, which, in turn, could be affected by many things, including events such as forest fires, insect infestation, tree diseases, prolonged drought, other adverse weather and climate conditions and the exhaustion of stone quarries. Government regulations relating to forest management practices also affect our suppliers’ ability to harvest or export timber and other products, and changes to regulations and forest management policies, or the implementation of new laws or regulations, could impede their ability to do so. If our suppliers cannot deliver sufficient products, and we cannot find replacement suppliers, our net sales and operating results may be adversely affected.
Our operating results may be adversely affected by inventory shrinkage and damage.
We are subject to the risk of inventory shrinkage and damage, including the damage or destruction of our inventory by natural disasters, organized retail theft or other causes. We have experienced charges in the past, and we cannot assure you that the measures we are taking will effectively address the problem of inventory shrinkage and damage in the future. Organized retail theft is also increasing, and our efforts to address it may not be successful. Although some level of inventory shrinkage and damage is an unavoidable cost of doing business, we could experience higher-than-normal rates of inventory shrinkage and damage or incur increased security and other costs to combat inventory theft and damage. If we are not successful in managing our inventory balances, our operating results may be adversely affected.
If the use of “cookie” tracking technologies is further restricted, the amount of internet user information we collect would decrease, which could require additional marketing efforts and harm our business and operating results.
Cookies are small data files that are sent by websites and stored locally on an internet user’s computer or mobile device. We, and third parties who work on our behalf, collect data via cookies that is used to track the behavior of visitors to our sites, to provide a more personal and interactive experience, and to increase the effectiveness of our marketing.
Privacy regulations and policies by device operating systems, such as iOS or Android, are increasingly restricting how we deploy our cookies, and this could potentially increase the number of internet users that choose to proactively disable cookies on their systems. In addition, companies such as Google have publicly disclosed their intention to move away from cookies, which would have a negative impact on our ability to find the same anonymous user across different web properties, and would require us to increase our direct customer data capture efforts. If we are not successful, our marketing efforts may be limited, and our business, results of operations, and financial condition could be adversely affected.
Our business exposes us to personal injury, product liability and warranty claims and related governmental investigations, which could result in negative publicity, harm our brand and adversely affect our business, financial condition and operating results.
Our stores and distribution centers are warehouse environments that involve the operation of forklifts and other machinery and the storage and movement of heavy merchandise, all of which are activities that have the inherent danger of injury or death to associates or customers despite safety precautions, training and compliance with federal, state and local health and safety regulations. While we have insurance coverage in place in addition to policies and procedures designed to minimize these risks, we may nonetheless be unable to avoid material liabilities for an injury or death arising out of these activities.
In addition, we face an inherent risk of exposure to product liability or warranty claims or governmental investigations in the event that the use of our products is alleged to have resulted in economic loss, personal injury or property damage or violated environmental or other laws. If any of our products proves to be defective or otherwise in violation of applicable law, we may be required to recall such products and be subject to legal action.
We generally seek contractual indemnification from our suppliers. However, such contractual indemnification may not be enforceable against the supplier, particularly because many of our suppliers are located outside of the United States. Any personal injury, product liability or warranty claim made against us, whether or not it has merit, or governmental investigation related to our products, could be time-consuming and costly to defend or respond to, may not be covered by insurance carried by us, could result in negative publicity, could harm our brand and could adversely affect our business, financial condition and operating results. In addition, any negative publicity involving our suppliers, associates, and other parties who are not within our control could adversely affect us.
In connection with the installation or delivery of our products, customers may engage third parties associated with us to enter their homes. In addition, we intend to pilot in-home design services. While we believe we have appropriate indemnification and risk management practices in place, such activities involve liability and reputational risk, which could adversely affect us.
Unfavorable allegations, government investigations and legal actions surrounding our products and us could harm our reputation, impair our ability to grow or sustain our business, and adversely affect our business, financial condition and operating results.
We rely on our reputation for offering great value, superior service and a broad assortment of high-quality, safe products. If we become subject to unfavorable allegations, government investigations or legal actions involving our products or us, such circumstances could harm our reputation and our brand and adversely affect our business, financial condition and operating results. If this negative impact is significant, our ability to grow or sustain our business could be jeopardized.
For instance, we have previously settled claims related to unfavorable allegations surrounding the product quality of our laminates sourced from China. Although such claims have been resolved, we cannot predict whether we will face additional lawsuits that are not covered by the settlement or the release. If additional lawsuits are filed, we could incur significant costs, be liable to damages, be subject to fines, penalties, injunctive relief, criminal charges or other legal risks, which could reduce demand for our products and adversely affect our business, financial condition and operating results.
Negative publicity surrounding product matters, including publicity about other retailers, may harm our reputation and affect the demand for our products. In addition, if more stringent laws or regulations are adopted in the future, we may have difficulty complying with the new requirements imposed by such laws and regulations, and in turn, our business, financial condition, and operating results could be adversely affected. Moreover, regardless of whether any such changes are adopted, we may become subject to claims or governmental investigations alleging violations of applicable laws and regulations. Any such matter may subject us to fines, penalties, injunctions, litigation and/or potential criminal violations. Any one of these results could negatively affect our business, financial condition, and operating results and impair our ability to grow or sustain our business.
If we violate or are alleged to have violated environmental, health and safety laws and regulations, we could incur significant costs and other negative effects that could reduce demand for our products and adversely affect our business, financial condition and operating results.
Certain portions of our operations are subject to laws and regulations governing the environmental protection of natural resources and health and safety, including formaldehyde emissions and the use, storage, handling, generation, transportation, treatment, emission, release, discharge and disposal of certain hazardous materials and wastes. In addition, certain of our products are subject to laws and regulations relating to the importation, exportation, acquisition or sale of certain plants and plant products, including those that have been illegally harvested, and the emissions of hazardous materials.
We operate our business in accordance with standards and procedures designed to comply with the applicable laws and regulations in these areas and work closely with our suppliers in order to comply with such laws and regulations. If we violate or are alleged to have violated these laws, we could incur significant costs, be liable for damages, experience delays in shipments of our products, be subject to fines, penalties, criminal charges or other legal risks, or suffer reputational harm, any of which could reduce demand for our products and adversely affect our business, financial condition and operating results. In addition, there can be no assurance that such laws or regulations will not become more stringent in the future or that we will not incur additional costs in the future in order to comply with such laws or regulations.
We, and our officers and directors and stockholders, have been and may be the target of securities-related litigation in the future, which could divert our management’s attention and resources, result in substantial costs, and have an adverse effect on our business, results of operations, financial condition and stock price.
We have been and may in the future be the target of securities-related litigation in the future. Litigation can divert our management’s attention and resources, result in substantial costs, and have an adverse effect on our business, results of operations, financial condition and stock price.
We maintain director and officer insurance to mitigate the risks associated with potential claims; however, we are responsible for meeting certain deductibles under such policies, and, in any event, we cannot assure you that the insurance coverage will adequately protect us from all claims made against us. Further, as a result of the litigation, the costs of insurance may increase, and the availability of coverage may decrease. As a result, we may not be able to maintain our current levels of insurance at a reasonable cost, or at all, which might make it more difficult to attract qualified candidates to serve as executive officers or directors. There also may be adverse publicity associated with litigation that could negatively affect customer perception of our business and materially damage our reputation and the value of our brand despite the fact that we deny the allegations or are ultimately found not liable.
Federal, state or local laws and regulations, or our failure to comply with such laws and regulations, could increase our expenses, restrict our ability to conduct our business and expose us to legal risks.
We are subject to a wide range of general and industry-specific laws and regulations imposed by federal, state and local authorities in the countries in which we operate including those related to customs, foreign operations (such as the FCPA), truth-in-advertising, consumer protection (such as the California Consumer Privacy Act and Telephone Consumer Protection Act), privacy, product safety (such as the Formaldehyde Standards in Composite Wood Products Act), the environment (such as the Lacey Act), intellectual property infringement, zoning and occupancy matters as well as the operation of retail stores and distribution facilities. In addition, various federal and state laws govern our relationship with, and other matters pertaining to, our associates, including wage and hour laws, laws governing independent contractor classifications, requirements to provide meal and rest periods or other benefits, family leave mandates, requirements regarding working conditions and accommodations to certain associates, citizenship or work authorization and related requirements, insurance and workers’ compensation rules and anti-discrimination laws. In recent years, we and other parties in the flooring industry have been or currently are parties to litigation involving claims that allege violations of the foregoing laws, including claims related to product safety and patent claims. In addition, there has been an increase in the number of wage and hour class action claims that allege misclassification of overtime eligible workers and/or failure to pay overtime-eligible workers for all hours worked, particularly in the retail industry, and we are currently defending one such claim. Although we believe that we have complied with these laws and regulations, there is nevertheless a risk that we will become subject to additional claims that allege we have failed to do so. Any claim that alleges a failure by us to comply with any of the foregoing laws and regulations may subject us to fines, penalties, injunctions, litigation and/or potential criminal violations, which could adversely affect our reputation, business, financial condition and operating results.
Certain of our products may require us to spend significant time and resources in order to comply with applicable advertising, labeling, importation, exportation, environmental, health and safety laws and regulations because if we violate these laws or regulations, we could experience delays in shipments of our goods, be subject to fines or penalties, be liable for costs and damages or suffer reputational harm, any of which could reduce demand for our merchandise and adversely affect our business, financial condition and operating results.
Any changes to the foregoing laws or regulations or any new laws or regulations that are passed or go into effect may make it more difficult for us to operate our business and in turn adversely affect our operating results.
We may also be subject to audits by various taxing authorities. Similarly, changes in tax laws in any of the multiple jurisdictions in which we operate, or adverse outcomes from tax audits that we may be subject to in any of the jurisdictions in which we operate, could result in an unfavorable change in our effective tax rate, which could adversely affect our business, financial condition and operating results. In addition, given the nature of our business, certain of our sales are exempt from state sales taxes. If we are audited and fail to maintain proper documentation, any adjustments resulting from such audits could increase our tax liability, including any interest or penalties.
Labor activities could cause labor relations difficulties for us.
Currently none of our associates are represented by a union; however, our associates have the right at any time to form or affiliate with a union. As we continue to grow, enter different regions and operate distribution centers, unions may attempt to organize all or part of our associate base at certain stores or distribution centers within certain regions. We cannot predict the adverse effects that any future organizational activities will have on our business, financial condition and operating results. If we were to become subject to work stoppages, we could experience disruption in our operations and increases in our labor costs, either of which could adversely affect our business, financial condition and operating results.
If our efforts to protect the privacy and security of information related to our customers, us, our associates, our suppliers and other third parties are not successful, we could become subject to litigation, investigations, liability and negative publicity that could significantly harm our reputation and relationships with our customers and adversely affect our business, financial condition and operating results.
Our business, like that of most retailers, involves the receipt, storage and transmission of customers’ personal information, consumer preferences and payment card data, as well as other confidential information related to us, our associates, our suppliers and other third parties, some of which is entrusted to third-party service providers and vendors that provide us with technology, systems and services that we use in connection with the receipt, storage and transmission of such information. Techniques used for cyber attacks designed to gain unauthorized access to these types of sensitive information by breaching or sabotaging critical systems of large organizations are constantly evolving and generally are difficult to recognize and react to effectively. We may be unable to anticipate these techniques or to implement adequate preventive or reactive security measures. Notwithstanding widespread recognition of the cyber attack threat and improved data protection methods, high profile electronic security breaches leading to unauthorized release of sensitive information have occurred in recent years with increasing frequency at a number of major U.S. companies, including several large retailers, notwithstanding widespread recognition of the cyber attack threat and improved data protection methods.
Despite our security measures and those of third parties with whom we do business, such as our banks, merchant card processing and other technology vendors, our respective systems and facilities may be vulnerable to criminal cyber-attacks or security incidents due to malfeasance, intentional or inadvertent security breaches by associates, or other vulnerabilities such as defects in design or manufacture. Unauthorized parties may also attempt to gain access to our systems or facilities through fraud, trickery or other forms of deception targeted at our customers, associates, suppliers and service providers. Any such incidents could compromise our networks and the information stored there could be accessed, misused, publicly disclosed, lost or stolen.
As noted above, the techniques used by criminals to obtain unauthorized access to sensitive data change frequently and often are not recognized until launched against a target; accordingly, we may be unable to anticipate these techniques or implement adequate preventative measures. In addition, advances in computer capabilities, new technological discoveries or other developments may also compromise or result in the obsolescence of the technology used to protect sensitive information. An actual or anticipated attack or security incident may cause us to incur additional costs, including costs related to diverting or deploying personnel, implementing preventative measures, training associates and engaging third-party experts and consultants. Further, any security breach incident could expose us to risks of data loss, regulatory and law enforcement investigations, litigation and liability and could seriously disrupt our operations and any resulting negative publicity could significantly harm our reputation and relationships with our customers and adversely affect our business, financial condition and operating results.
A material disruption in our information systems, including our website and call center, could adversely affect our business or operating results and lead to reduced net sales and reputational damage.
We rely on our information systems to process transactions, summarize our results of operations and manage our business. In particular, our website and our call center are important parts of our integrated connected customer strategy and customers use these systems as information sources on the range of products available to them and as a way to order our products. Therefore, the reliability and capacity of our information systems is critical to our operations and the implementation of our growth initiatives. However, our information systems are subject to damage or interruption from planned upgrades in technology interfaces, power outages, computer and telecommunications failures, computer viruses, cyber-attacks or other security breaches and catastrophic events such as fires, floods, earthquakes, tornadoes, hurricanes, acts of war or terrorism and usage errors by our associates. If our information systems are damaged or cease to function properly, we may have to make a significant investment to fix or replace them, and we may suffer losses of critical data and/or interruptions or delays in our operations. In addition, to keep pace with changing technology, we must continuously implement new information technology systems as well as enhance our existing systems. Moreover, the successful execution of some of our growth strategies, in particular the expansion of our connected customer and online capabilities, is dependent on the design and implementation of new systems and technologies and/or the enhancement of existing systems. Any material disruption in our information systems, or delays or difficulties in implementing or integrating new systems or enhancing or expanding current systems, could have an adverse effect on our business (in particular our call center and online operations) and our operating results and could lead to reduced net sales and reputational damage.
We may not be able to successfully maintain effective internal controls over financial reporting, which could have an adverse effect on our business and stock price.
We are required to comply with the SEC’s rules implementing Sections 302 and 404 of the Sarbanes-Oxley Act, which require management to certify financial and other information in our quarterly and annual reports as well as our fiscal year-end assessment of the effectiveness of our internal control over financial reporting. We have in the past identified and remediated a material weakness in our internal controls related to ineffective information technology general controls in the areas of user access and program change-management over certain information technology systems that support the Company’s financial reporting processes. Completion of remediation does not provide assurance that our remediation or other controls will continue to operate properly.
While the previously identified material weakness has been remediated, we may suffer from other material weaknesses in the future. To comply with the requirements of Sections 302 and 404, we may need to undertake various actions, such as implementing new internal controls and procedures and hiring additional accounting or internal audit staff. Testing and maintaining internal controls can divert our management’s attention from other matters that are important to the operation of our business. In addition, when evaluating our internal control over financial reporting, we may identify material weaknesses that we may not be able to remediate in time to meet the applicable deadline imposed upon us for compliance with the requirements of Sections 302 and 404. If we are unable to maintain effective internal control over financial reporting or disclosure controls and procedures, our ability to record, process and report financial information accurately, and to prepare financial statements within required time periods, could be adversely affected. This could subject us to litigation or investigations requiring management resources and payment of legal and other expenses and could result in negative publicity, harm to our reputation and adversely affect our business, financial condition and operating results or adversely affect the market price of our common stock.
We will require significant capital to fund our expanding business, which may not be available to us on satisfactory terms or at all. If we are unable to maintain sufficient levels of cash flow or if we do not have sufficient availability under our asset-based revolving credit facility (as amended, the “ABL Facility”), we may not meet our growth expectations or we may require additional financing, which could adversely affect our financial health and impose covenants that limit our business activities.
We plan to continue investing for growth, including opening new stores, remodeling existing stores, adding staff, adding distribution center capacity and upgrading our information technology systems and other infrastructure. These investments will require significant capital, which we plan on funding with cash flow from operations and borrowings under the ABL Facility.
If our business does not generate sufficient cash flow from operations to fund these activities or if these investments do not yield cash flows in line with past performance or our expectations, we may need additional equity or debt financing. If such financing is not available to us, or is not available on satisfactory terms, our ability to operate and expand our business or respond to competitive pressures would be curtailed, and we may need to delay, limit or eliminate planned store openings or operations or other elements of our growth strategy. If we raise additional capital by issuing equity securities or securities convertible into equity securities, our stockholders’ ownership would be diluted.
Changes in tax laws, trade policies and regulations or in our operations and newly enacted laws or regulations may impact our effective tax rate or may adversely affect our business, financial condition and operating results.
Changes in tax laws in any of the multiple jurisdictions in which we operate, or adverse outcomes from tax audits that we may be subject to in any of the jurisdictions in which we operate, could result in an unfavorable change in our effective tax rate, which could adversely affect our business, financial condition and operating results.
Developments in tax policy or trade relations could have a material adverse effect on our business, results of operations and liquidity. If there are any adverse changes in tax laws or trade policies that result in an increase in our costs, we may not be able to adjust the prices of our products, especially in the short-term, to recover such costs, and a rise in such costs could adversely affect our business, financial condition and operating results.
We are subject to payments-related risks that could increase our operating costs, expose us to fraud, subject us to potential liability and potentially disrupt our business.
We accept payments using a variety of methods, including credit cards, debit cards, gift cards and physical bank checks. These payment options subject us to many compliance requirements, including, but not limited to, compliance with the Payment Card Industry Data Security Standards, which represents a common set of industry tools and measurements to help ensure the safe handling of sensitive information, and compliance with contracts with our third-party processors. These payment options also subject us to potential fraud by criminal elements seeking to discover and take advantage of security vulnerabilities that may exist in some of these payment systems. For certain payment methods, including credit cards and debit cards, we pay interchange and other fees, which may increase over time and raise our operating costs and lower profitability. We rely on third parties to provide payment processing services, including the processing of credit cards, debit cards and gift cards, and it could disrupt or harm our business if these companies become unwilling or unable to provide these services to us, experience a data security incident or fail to comply with applicable rules and industry standards. We are also subject to payment card association operating rules, including data security rules, certification requirements, and rules governing electronic funds transfers, which could change or be reinterpreted to make it difficult or impossible for us to comply. If we fail to comply with these rules or requirements, or if our data security systems or payment card information of our customers are breached or compromised, there is the potential that parties could seek damages from us, we may be liable for card issuing banks’ costs, subject to fines and higher transaction fees, and lose our ability to accept credit cards and debit card payments from our customers, process electronic funds transfers, or facilitate other types of online payments, we could lose the confidence of customers and our business, financial condition, and operating results could be adversely affected. We may also need to expend significant management and financial resources to become or remain compliant with relevant standards and requirements, which could divert resources from other initiatives and adversely affect our business, financial condition and operating results.
Our facilities and systems, as well as those of our suppliers, are vulnerable to natural disasters and other unexpected events, and as a result we may lose merchandise and be unable to effectively deliver it to our stores.
Our retail stores, store support center and distribution centers, as well as the operations of our suppliers from which we receive goods and services, are vulnerable to damage from earthquakes, tornadoes, hurricanes, fires, floods, and similar events. If any of these events result in damage to our facilities, systems or equipment, or those of our suppliers, they could adversely affect our ability to stock our stores and deliver products to our customers, and could adversely affect our net sales and operating results. In addition, we may incur costs in repairing any damage beyond our applicable insurance coverage. In particular, any disruption to any of our distribution centers could have a material adverse impact on our business.
Our intellectual property rights are valuable, and any failure to protect them could reduce the value of our products and brand and harm our business.
We regard our intellectual property as having significant value, and our brand is an important factor in the marketing of our products. However, we cannot assure you that the steps we take to protect our trademarks or intellectual property will be adequate to prevent others from copying or using our trademarks or intellectual property without authorization. If our trademarks or intellectual property are copied or used without authorization, the value of our brand, its reputation, our competitive advantages and our goodwill could be harmed.
We may be involved in disputes from time to time relating to our intellectual property and the intellectual property of third parties.
We are and may continue to become parties to disputes from time to time over rights and obligations concerning intellectual property, and we may not prevail in these disputes. Third parties may raise claims against us alleging infringement or violation of the intellectual property of such third-party. Even if we prevail in such disputes, the costs we incur in defending such dispute may be material and costly. Some third-party intellectual property rights may be extremely broad, and it may not be possible for us to conduct our operations in such a way as to avoid violating any such intellectual property rights. Any such intellectual property claim could subject us to costly litigation and impose a significant strain on our financial resources and management personnel regardless of whether such claim has merit. The liability insurance we maintain may not adequately cover potential claims of this type, and we may be required to pay monetary damages or license fees to third parties, which could have a material adverse effect on our business, financial condition and operating results.
We may, from time to time, consider or engage in strategic transactions. Any such strategic transactions would involve risks, which could have an adverse impact on our financial condition and results of operation, and we may not realize the anticipated benefits of these transactions.
From time to time, we consider strategic transactions, including mergers, acquisitions, investments, alliances, and other growth and market expansion strategies, with the expectation that these transactions will result in increases in sales, cost savings, synergies and various other benefits. Assessing the viability and realizing the benefits of these transactions is subject to significant uncertainty. Additionally, in connection with evaluating potential strategic transactions and assets, we may incur significant expenses for the evaluation and due diligence investigation and negotiation of any potential transaction. We have no prior experience acquiring companies and may not be successful. If we complete an acquisition, we would need to successfully integrate the target company’s products, services, associates and systems into our business operations. On June 4, 2021, we acquired Spartan Surfaces, Inc. (“Spartan”), a commercial flooring specifier, and we may acquire additional commercial flooring companies in the future. As with any acquisition, we need to successfully integrate Spartan’s products, services, associates and systems into our business operations. Integration can be a complex and time-consuming process, and if the integration is not fully successful or is delayed for a material period of time, we may not achieve the anticipated synergies or benefits of the acquisition. Furthermore, even if a target company is successfully integrated, an acquisition may fail to further our business strategy as anticipated, expose us to increased competition or challenges with respect to our products or services, and expose us to additional liabilities. Any impairment of goodwill or other intangible assets acquired in a strategic transaction may reduce our earnings.
The effectiveness of our advertising strategy is a driver of our future success.
We believe that our growth was in part a result of our successful investment in local advertising. As we enter new markets that often have more expensive advertising rates, we may need to increase our advertising expenses to broaden the reach and frequency of our advertising to increase the recognition of our brand. If our advertisements fail to draw customers in the future, or if the cost of advertising or other marketing materials increases significantly, we could experience declines in our net sales and operating results.
We do not maintain “key person” life insurance policies on our key personnel.
We do not have “key person” life insurance policies for any of our key personnel. If we were to obtain “key person” insurance for our key personnel, there can be no assurance that the amounts of such policies would be sufficient to pay losses experienced by us as a result of the loss of any of those personnel.
We are a holding company with no business operations of our own and depend on cash flow from our subsidiaries to meet our obligations.
We are a holding company with no business operations of our own or material assets other than the equity of our subsidiaries. All of our operations are conducted by our subsidiaries. As a holding company, we will require dividends and other payments from our subsidiaries to meet cash requirements.
The terms of our $400.0 million ABL Facility and our approximately $206.6 million senior secured term loan facility (as amended to date, the “Term Loan Facility” and together with the ABL Facility, our “Credit Facilities”), restrict our subsidiaries from paying dividends and otherwise transferring cash or other assets to us except in certain limited circumstances. If we become insolvent or there is a liquidation or other reorganization of any of our subsidiaries, our stockholders likely will have no right to proceed against their assets. Creditors of those subsidiaries will be entitled to payment in full from the sale or other disposal of the assets of those subsidiaries before we, as an equity holder, would be entitled to receive any distribution from that sale or disposal. If our subsidiaries are unable to pay dividends or make other payments to us when needed, we will be unable to satisfy our obligations.
We face risks related to our indebtedness.
As of December 30, 2021, the principal amount of our total indebtedness was approximately $206.6 million related to our indebtedness outstanding under the Term Loan Facility. In addition, as of December 30, 2021, we had the ability to access approximately $377.5 million of unused borrowings available under the ABL Facility without violating any covenants thereunder and had approximately $22.5 million in outstanding letters of credit thereunder.
Our indebtedness, combined with our lease and other financial obligations and contractual commitments, could adversely affect our business, financial condition and operating results by:
•making it more difficult for us to satisfy our obligations with respect to our indebtedness, including restrictive covenants and borrowing conditions, which may lead to an event of default under the agreements governing our debt;
•making us more vulnerable to adverse changes in general economic, industry and competitive conditions and government regulation;
•requiring us to dedicate a substantial portion of our cash flow from operations to payments on our indebtedness, thereby reducing the availability of cash flows to fund current operations and future growth;
•exposing us to the risk of increased interest rates as our borrowings under our Credit Facilities are at variable rates;
•restricting us from making strategic acquisitions or causing us to make non-strategic divestitures;
•requiring us to comply with financial and operational covenants, restricting us, among other things, from placing liens on our assets, making investments, incurring debt, making payments to our equity or debt holders and engaging in transactions with affiliates;
•limiting our ability to borrow additional amounts for working capital, capital expenditures, acquisitions, debt service requirements, execution of our business and growth strategies or other purposes; and
•limiting our ability to obtain credit from our suppliers and other financing sources on acceptable terms or at all.
We may also incur substantial additional indebtedness in the future, subject to the restrictions contained in our Credit Facilities. If such new indebtedness is in an amount greater than our current debt levels, the related risks that we now face could intensify. However, we cannot give assurance that any such additional financing will be available to us on acceptable terms or at all. Moreover, for taxable years beginning after December 31, 2017, the deductibility of net business interest expenses on our indebtedness for each taxable year could be limited under the Tax Cuts and Jobs Act.
Additionally, in July 2017, the United Kingdom’s Financial Conduct Authority (“FCA”), the authority that regulates London Interbank Offered Rate (“LIBOR”), announced it intends to stop compelling banks to submit rates for the calculation of LIBOR after 2021. On March 5, 2021, the ICE Benchmark Administration Limited (“IBA”), which is regulated by the FCA confirmed that it would cease the publication of the one-week and two-month U.S. dollar LIBOR settings immediately following the LIBOR publication on December 31, 2021, and the U.S. dollar LIBOR settings (overnight and 12 months) immediately following the LIBOR publication on June 30, 2023. Accordingly, in the near future LIBOR will cease being a widely used benchmark interest rate. The current and any future reforms and other pressures may cause LIBOR to be replaced with a new benchmark or to perform differently than in the past, including during the transition period. The Company has material debt contracts that are indexed to USD-LIBOR and is currently working on a transition plan. We believe all our material agreements have appropriate language to negotiate a transition to an alternative index rate and are continuing to monitor this activity and evaluate the related risks. However, the consequences of these market developments cannot be entirely predicted and a transition from LIBOR, even if administered consistent with the provisions of our material agreements, may require us to amend or restructure our existing LIBOR-based debt instruments and any related hedging arrangements that extend beyond 2021, which may be difficult, costly and time consuming. We cannot give assurance that our financial condition and operating results will not be adversely affected.
Both New York State and federal legislation in the U.S. is under consideration that if enacted could result, upon the unavailability of LIBOR, in the replacement of certain fallback provisions in LIBOR-based financing agreements. Under the proposed legislation, some of these existing fallback provisions would be replaced by a provision specifying that the replacement rate and related adjustments recommended by the Alternative Reference Rates Committee (“ARRC”), the committee in the United States convened to ensure a successful transition from LIBOR, would be used to establish the interest-rate on the financing. The legislation would also require the use of the benchmark replacement rate and related adjustments recommended by the ARRC in the event that there are no fallback provisions in a financing. The legislation would not impact credit agreements that already include fallbacks to the changes recommended by the ARRC. Any such legislation adopted in New York State would have applicability only to agreements governed by New York law. There can be no assurance as to the final form of any such New York or federal legislation or as to whether any such legislation will be adopted.
In the event that one or more LIBOR-based interest rate derivatives are entered into to hedge variable rate indebtedness, the LIBOR rate specified therein will be determined from time to time by reference to a publication page specified in the relevant definitions of the International Swaps and Derivatives Association, Inc. (“ISDA”). However, if such rate does not appear on the relevant page, and the above-referenced legislation is not adopted that would address the replacement of LIBOR under such derivatives, LIBOR will be determined in accordance with dealer polls conducted by the calculation agent under the agreement governing the derivative. This dealer polling mechanism may not be successful in arriving at a replacement interest rate for LIBOR. Even if the dealer polling mechanism successfully arrives at a replacement interest rate for derivatives, that rate could differ significantly from the interest rates used for our variable-rate indebtedness.
Significant amounts of cash are required to service our indebtedness and operating lease obligations, and any failure to meet our debt service obligations could adversely affect our business, financial condition and operating results.
Our ability to pay interest on and principal of our debt obligations will primarily depend upon our future operating performance. As a result, prevailing economic conditions and financial, business and other factors, many of which are beyond our control, will affect our ability to make these payments.
If we do not generate sufficient cash flow from operations to satisfy our debt service obligations, we may have to undertake alternative financing plans, such as refinancing or restructuring our indebtedness, selling our assets, reducing or delaying capital investments, or seeking to raise additional capital. Our ability to restructure or refinance our debt will depend on the condition of the capital markets and our financial condition at such time. From time to time, capital markets may experience periods of disruption and instability. For example, between 2008 and 2009, the global capital markets were unstable as evidenced by periodic disruptions in liquidity in the debt capital markets, significant write-offs in the financial services sector, the re-pricing of credit risk in the broadly syndicated credit market and the failure of major financial institutions. Despite actions of the U.S. federal government and foreign governments, these events contributed to worsening general economic conditions that materially and adversely impacted the broader financial and credit markets and reduced the availability of debt and equity capital for the market as a whole. While market conditions have largely recovered from the events of 2008 and 2009, there have been continuing periods of volatility, some lasting longer than others. There can be no assurance these market conditions will not continue or worsen in the future. More recently, we observed an increase in the cost of obtaining debt financing due to the impact of the COVID-19 pandemic on capital markets as evidenced by the higher cost of our term loan B-1 facility (refer to Note 10, “Debt” of the notes to the consolidated financial statements for additional details related to our credit facilities).
Any refinancing of our debt could therefore be at higher interest rates and may require us to comply with more onerous covenants, which could further restrict our business operations. The terms of existing or future debt instruments may restrict us from adopting some of these alternatives. In addition, any failure to make payments of interest and principal on our outstanding indebtedness on a timely basis would likely result in a reduction of our credit rating, which could harm our ability to incur additional indebtedness on acceptable terms. See “Management’s Discussion and Analysis of Financial Condition and Results of Operations—Liquidity and Capital Resources—Our Credit Facilities-” for more information.
Our inability to generate sufficient cash flow to satisfy our debt obligations, or to refinance our obligations at all or on acceptable terms, could have an adverse effect on our business, financial condition and operating results.
We cannot assure you that our business will generate sufficient cash flow from operations or that future borrowings will be available to us in amounts sufficient to enable us to make payments on our indebtedness or to fund our operations.
Our debt agreements contain restrictions that may limit our flexibility in operating our business.
We are a holding company, and accordingly, substantially all of our operations are conducted through our subsidiaries. The credit agreements governing our Credit Facilities contain, and any future indebtedness would likely contain, a number of restrictive covenants that impose significant operating and financial restrictions, including restrictions on our ability to engage in acts that may be in our best long-term interests. The credit agreements governing our Credit Facilities include covenants that, among other things, restrict our and our subsidiaries’ ability to:
•incur additional indebtedness;
•create liens;
•make investments, loans, or advances;
•merge or consolidate;
•sell assets, including capital stock of subsidiaries, or make acquisitions;
•pay dividends on capital stock or redeem, repurchase or retire capital stock, or make other restricted payments;
•enter into transactions with affiliates;
•repurchase certain indebtedness; and
•exceed a certain total net leverage ratio or, in certain cases, maintain less than a certain fixed charge coverage ratio.
Based on the foregoing factors, the operating and financial restrictions and covenants in our current debt agreements and any future financing agreements could adversely affect our ability to finance future operations or capital needs or to engage in other business activities.
In addition, a breach of any of the restrictive covenants in our Credit Facilities may constitute an event of default, permitting the lenders to declare all outstanding indebtedness under both our Credit Facilities to be immediately due and payable or to enforce their security interest, which could adversely affect our ability to respond to changes in our business and manage our operations. Upon the occurrence of an event of default under any of the agreements governing our Credit Facilities, the lenders could elect to declare all amounts outstanding to be due and payable and exercise other remedies as set forth in such credit agreements. If any of our indebtedness under either of our Credit Facilities were to be accelerated, there can be no assurance that our assets would be sufficient to repay this indebtedness in full, which could adversely affect our ability to continue to operate as a going concern. See “Management’s Discussion and Analysis of Financial Condition and Results of Operations—Liquidity and Capital Resources—Our Credit Facilities” for more information.
We are exposed to credit risk on certain of our receivables and the inability or failure to collect outstanding credit, specifically from our existing customers under our commercial credit program, could result in losses and adversely affect our operating results.
As an added convenience to our customers, we began offering limited credit to our commercial customers, a portion of which is not covered by collateral, third-party bank support, or credit insurance. Our exposure to credit and collectability risk makes us susceptible to potential losses, and our ability to mitigate such risks may be limited, especially if our customers are adversely affected by a market downturn or periods of economic uncertainty. While we monitor individual customer payment capability and maintain adequate reserves to cover our exposure, there can be no assurance that such procedures will be effective in reducing our credit risks.
Our fixed lease obligations could adversely affect our operating results.
We are required to use a significant portion of cash generated by our operations to satisfy our fixed lease obligations, which could adversely affect our ability to obtain future financing to support our growth or other operational investments. We will require substantial cash flows from operations to make our payments under our operating leases, all of which provide for periodic increases in rent. As of December 30, 2021, our minimum annual lease payments under long-term operating leases for the fiscal years ending December 29, 2022 and December 28, 2023 are approximately $163.9 million and $170.3 million, respectively. If we are not able to make payments under our operating leases, this could trigger defaults under other leases or, in certain circumstances, under our Credit Facilities, which could cause the counterparties or lenders under those agreements to accelerate the obligations due thereunder.
Risks Related to the Ownership of Our Common Stock
Our stock price may continue to be volatile, which could result in a significant loss or impairment of your investment.
On May 2, 2017, we completed our initial public offering (the “IPO”). Since the IPO, the price of our common stock as reported by The New York Stock Exchange (“NYSE”) has ranged from a low closing sales price of $24.00 on December 24, 2018 to a high closing sales price of $143.31 on November 4, 2021. In addition, the trading price of our common stock has been, and may continue to be, subject to wide price fluctuations in response to various factors, many of which are beyond our control, including those described above in “—Risks Related to our Business” and the following:
•actual or anticipated fluctuations in our quarterly or annual financial results;
•the financial guidance we may provide to the public, any changes in such guidance or our failure to meet such guidance;
•failure of industry or securities analysts to maintain coverage of us, changes in financial estimates by any industry or securities analysts that follow us or our failure to meet such estimates;
•downgrades in our credit ratings or the credit ratings of our competitors;
•market factors, including rumors, whether or not correct, involving us or our competitors;
•unfavorable market reactions to allegations regarding the safety of products sold by us or our competitors that are similar to products that we sell and costs or negative publicity arising out of any potential litigation and/or government investigations resulting therefrom;
•fluctuations in stock market prices and trading volumes of securities of similar companies;
•short selling of our common stock by investors;
•additions or departures of key personnel;
•announcements of new store openings, commercial relationships, acquisitions, or entry into new markets by us or our competitors;
•failure of any of our initiatives, including our growth strategy, to achieve commercial success;
•regulatory or political developments;
•changes in accounting principles or methodologies;
•litigation or governmental investigations;
•negative publicity about us in the media and online; and
•general financial market conditions or events.
Furthermore, the stock markets have experienced extreme price and volume fluctuations that have affected and continue to affect the market prices of equity securities of many companies, including ours. These fluctuations sometimes have been unrelated or disproportionate to the operating performance of those companies. These and other factors may cause the market price and demand for our common stock to fluctuate substantially, which may limit or prevent investors from readily selling their shares of common stock and may otherwise adversely affect the price or liquidity of our common stock.
In addition, in the past, when the market price of a stock has been volatile, holders of that stock have sometimes instituted securities class action litigation against the company that issued the stock. Such litigation and any other similar litigation that could be brought in the future, could cause us to incur substantial costs associated with defending such litigation or paying for settlements or damages. Such lawsuits could also divert the time and attention of our management from our operating business. Regardless of whether lawsuits are resolved in our favor or if we are the plaintiff or the defendant in any litigation, any lawsuits to which we are or may become a party will likely be expensive and time consuming to defend or resolve. As a result, such litigation may adversely affect our business, financial condition and operating results.
If securities or industry analysts do not publish or cease publishing research or reports about us, our business, our market, or our competitors, or if they change their recommendations regarding our common stock in a negative way, the price and trading volume of our common stock could decline.
The trading market for our common stock is influenced by the research and reports that industry or securities analysts publish about us, our business, our market, or our competitors. If any of the analysts who cover us change their recommendation regarding our common stock in a negative way, or provide more favorable relative recommendations about our competitors, the price of our common stock would likely decline. If any analyst who covers us were to cease coverage of us or fail to regularly publish reports on us, we could lose visibility in the financial markets, which in turn could cause our common stock price or trading volume to decline.
We may issue stock options, restricted stock and/or other forms of stock-based compensation, which have the potential to dilute stockholders’ value and cause the price of our common stock to decline.
We may offer stock options, restricted stock and/or other forms of stock-based compensation to our eligible associates, consultants and directors. If we grant more equity awards to attract and retain key personnel, the expenses associated with such additional equity awards could materially adversely affect our results of operations and may also result in additional dilution to our stockholders. If any options that we issue are exercised or any restrictions on restricted stock that we issue lapse and those shares are sold into the public market, the market price of our common stock may decline. In addition, the availability of shares of common stock for award under our stock incentive plans or the grant of stock options, restricted stock or other forms of stock-based compensation may adversely affect the market price of our common stock.
Our ability to raise capital in the future may be limited.
Our business and operations may consume resources faster than we anticipate. In the future, we may need to raise additional funds through the issuance of new equity securities, debt or a combination of both. Additional financing may not be available on favorable terms or at all. If adequate funds are not available on acceptable terms, we may be unable to fund our capital requirements. If we issue new debt securities, the debt holders would have rights senior to holders of our common stock to make claims on our assets and the terms of any debt could restrict our operations, including our ability to pay dividends on our common stock. If we issue additional equity securities or securities convertible into equity securities, existing stockholders will experience dilution and the new equity securities could have rights senior to those of our common stock. Because our decision to issue securities in any future offering will depend on market conditions and other factors beyond our control, we cannot predict or estimate the amount, timing, or nature of our future offerings. Thus, you bear the risk of our future securities offerings reducing the market price of our common stock and diluting their interest.
We do not currently expect to pay any cash dividends.
The continued operation and growth of our business will require substantial funding. Accordingly, we do not currently expect to pay any cash dividends on shares of our common stock. Any determination to pay dividends in the future will be at the discretion of our Board or directors (the “Board”) and will depend upon our operating results, financial condition, contractual restrictions, restrictions imposed by applicable law and other factors our Board deems relevant. Additionally, under our Credit Facilities, our subsidiaries are currently restricted from paying cash dividends except in limited circumstances, and we expect these restrictions to continue in the future. Accordingly, realization of a gain on your investment in our common stock will depend on the appreciation of the price of our common stock, which may never occur. Investors seeking cash dividends in the foreseeable future should not purchase our common stock. See Item 5, “Market for Registrant’s Common Equity- Related Stockholder Matters and Issuer Purchases of Equity” for more information.
As a public company, we incur significant costs, and our management is required to devote substantial time, to comply with public company regulations, which could negatively impact our financial performance and could cause our results of operations or financial condition to suffer.
Since becoming a public company in 2017, we have incurred and we will continue to incur legal, accounting, insurance and other expenses, including costs associated with public company reporting requirements, the Sarbanes-Oxley Act, Dodd-Frank Wall Street Reform and Consumer Protection Act and related rules implemented by the SEC. The expenses incurred by public companies generally for reporting and corporate governance purposes have been increasing. These rules and regulations increase our legal and financial compliance costs and make some activities more time-consuming and costly. These laws and regulations can also make it more difficult or costly for us to obtain certain types of insurance, including director and officer liability insurance, and we may be forced to accept reduced policy limits and coverage or incur substantially higher costs to obtain the same or similar coverage. These laws and regulations can also make it more difficult for us to attract and retain qualified persons to serve on our Board, our Board committees or as our executive officers. Furthermore, if we are unable to satisfy our obligations as a public company, we could be subject to delisting of our Class A common stock, fines, sanctions, and other regulatory action and potentially civil litigation.
Anti-takeover provisions could impair a takeover attempt and adversely affect existing stockholders and the market value of our common stock.
Certain provisions of our certificate of incorporation and bylaws and applicable provisions of Delaware law may have the effect of rendering more difficult, delaying or preventing an acquisition of the Company, even when this would be in the best interest of our stockholders. These provisions include:
•the sole power of a majority of our Board to fix the number of directors;
•the requirement that certain advance notice procedures be followed for our stockholders to submit nominations of candidates for election to our Board and to bring other proposals before a meeting of the stockholders;
•the power of our Board to amend our bylaws without stockholder approval;
•the sole power of the Board to fill any vacancy on the Board, whether such vacancy occurs as a result of an increase in the number of directors or otherwise;
•the ability of a majority of our Board (even if less than a quorum) to designate one or more series of preferred stock and issue shares of preferred stock without stockholder approval;
•a requirement that, to the fullest extent permitted by law, certain proceedings against or involving us or our directors, officers, or associates be brought exclusively in the Court of Chancery in the State of Delaware; and
•the lack of cumulative voting rights for the holders of our Class A common stock with respect to the election of directors.
Further, Delaware law imposes conditions on the voting of “control shares” and on certain business combination transactions with “interested stockholders.”
Our issuance of shares of preferred stock could delay or prevent a change of control of the Company. Our Board has the authority to cause us to issue, without any further vote or action by our stockholders, shares of preferred stock, par value $0.001 per share, in one or more series, to designate the number of shares constituting any series and to fix the rights, preferences, privileges, and restrictions thereof, including dividend rights, voting rights, rights and terms of redemption, redemption price or prices, and liquidation preferences of such series. The issuance of shares of preferred stock may have the effect of delaying, deferring, or preventing a change in control of our Company without further action by our stockholders, even where stockholders are offered a premium for their shares.
In addition, the issuance of shares of preferred stock with voting rights may adversely affect the voting power of the holders of our other classes of voting stock either by diluting the voting power of our other classes of voting stock if they vote together as a single class, or by giving the holders of any such preferred stock the right to block an action on which they have a separate class vote even if the action were approved by the holders of our other classes of voting stock.
These provisions could delay or prevent hostile takeovers and changes in control or changes in our management. Also, the issuance of shares of preferred stock with dividend or conversion rights, liquidation preferences, or other economic terms favorable to the holders of preferred stock could adversely affect the market price for our common stock by making an investment in our common stock less attractive. For example, a conversion feature could cause the trading price of our common stock to decline to the conversion price of the preferred stock. Any provision of our certificate of incorporation or bylaws or Delaware law that has the effect of delaying or deterring a change in control or otherwise makes an investment in our common stock less attractive could limit the opportunity for our stockholders to receive a premium for their shares of our common stock and could also affect the price that some investors are willing to pay for our common stock.
General Risk Factors
Our business, financial condition and operating results are dependent on general economic conditions and discretionary spending by our customers, which in turn are affected by a variety of factors beyond our control. If such conditions deteriorate, our business, financial condition, and operating results may be adversely affected.
Our business, financial condition, and operating results are affected by general economic conditions and discretionary spending by our customers. Such general economic conditions and discretionary spending are beyond our control and are affected by, among other things:
•consumer confidence in the economy;
•interest rates and inflation;
•the COVID-19 pandemic;
•trade relations and tariffs;
•unemployment trends;
•consumer debt levels;
•consumer credit availability;
•data security and privacy concerns;
•the housing market, including housing turnover and whether home values are rising or declining;
•energy prices;
•slower rates of growth in real disposable personal income;
•natural disasters and unpredictable weather;
•national security concerns and other geopolitical risks;
•uncertain U.S. political conditions;
•protests, demonstrations, riots and other political unrest;
•tax rates and tax policy; and
•other matters that influence consumer confidence and spending.
If such conditions deteriorate, our business, financial condition, and operating results may be adversely affected. In addition, increasing volatility in financial and capital markets may cause some of the above factors to change with a greater degree of frequency and magnitude than in the past.
We are engaged in various legal actions, claims and proceedings arising in the ordinary course of business and, while we cannot predict the outcomes of such proceedings and other contingencies with certainty, this litigation and any potential future litigation could have an adverse impact on us.
We are engaged in various legal actions, claims and proceedings arising in the ordinary course of business, including claims related to breach of contract, product liabilities, intellectual property matters and employment related matters resulting from our business activities. As with most actions such as these, an estimate of any possible and/or ultimate liability cannot always be determined. Regardless of the outcome, litigation can have an adverse impact on us because of defense and settlement costs, diversion of management resources, and other factors. Additionally, we cannot guarantee that we will not become engaged in additional legal actions, claims, proceedings or governmental investigations in the future. Any such action could result in negative publicity, harm to our reputation and adversely affect our business, financial condition and operating results.
Our ability to control higher health care costs is limited and could adversely affect our business, financial condition and operating results.
Under the U.S. Patient Protection and Affordable Care Act (as amended, the “Affordable Care Act”), we are required to provide affordable coverage, as defined in the Affordable Care Act, to all associates, or otherwise be subject to a payment per associate based on the affordability criteria in the Affordable Care Act. Additionally, some states and localities have passed state and local laws mandating the provision of certain levels of health benefits by some employers. These requirements limit our ability to control associate health care costs. If health care costs rise, we may experience increased operating costs, which may adversely affect our business, financial condition and operating results.
We are subject to risks related to corporate social responsibility.
Our business faces increasing public scrutiny related to environmental, social and governance (“ESG”) activities. We risk damage to our brand and reputation if we fail to act responsibly in a number of areas, such as diversity and inclusion, environmental stewardship, support for local communities, corporate governance and transparency and considering ESG factors in our business operations. Adverse incidents could impact the value of our brand, the cost of our operations and relationships with investors, all of which could adversely affect our business and results. We will incur additional and potentially significant expenses as we continue to execute our ESG framework in the coming years.
Changes to accounting rules or regulations could adversely affect our operating results.
Our consolidated financial statements are prepared in accordance with accounting principles generally accepted in the United States. New accounting rules or regulations and changes to existing accounting rules or regulations have occurred and may occur in the future. Future changes to accounting rules or regulations, such as changes to revenue recognition or lease accounting guidance or a requirement to convert to international financial reporting standards, could adversely affect our operating results through increased cost of compliance.
Proposed changes in U.S. taxation of businesses could adversely affect us.
The current Presidential Administration has proposed changes to tax law that would, among other things, increase the corporate tax rate, impose a 15% minimum tax on corporate book income, and strengthen the GILTI regime imposed by the Tax Cuts and Jobs Act while eliminating related tax exemptions. Any such tax changes could materially increase the amount of taxes we would be required to pay, which could adversely affect our business, financial condition and operating results. For example, increases in the corporate tax rate may adversely impact our cash flow, which would in turn negatively impact our performance and liquidity. Other changes that may be enacted in the future, including changes to tax laws enacted by state or local governments in jurisdictions in which we operate, could result in further changes to state and local taxation and materially adversely affect our financial position and results of operations.
ITEM 1B. UNRESOLVED STAFF COMMENTS.
None.
ITEM 2. PROPERTIES.
We have 160 U.S. warehouse-format stores located in 33 states, as shown in the chart below:
| | | | | | | | |
| State | | Number of
Stores |
| Alabama | | 1 |
| Arizona | | 6 |
| California | | 25 |
| Colorado | | 4 |
| Connecticut | | 2 |
| Florida | | 23 |
| Georgia | | 9 |
| Illinois | | 8 |
| Indiana | | 2 |
| Iowa | | 1 |
| Kansas | | 2 |
| Kentucky | | 1 |
| Louisiana | | 1 |
| Maryland | | 1 |
| Massachusetts | | 4 |
| Michigan | | 2 |
| Missouri | | 2 |
| Nevada | | 3 |
| New Hampshire | | 1 |
| New Jersey | | 5 |
| New Mexico | | 1 |
| New York | | 3 |
| North Carolina | | 3 |
| Ohio | | 3 |
| Oklahoma | | 2 |
| Pennsylvania | | 2 |
| South Carolina | | 3 |
| Tennessee | | 3 |
| Texas | | 24 |
| Utah | | 3 |
| Virginia | | 6 |
| Washington | | 3 |
| Wisconsin | | 1 |
| Total | | 160 |
We opened 27 new warehouse-format stores during fiscal 2021. In addition to our warehouse-format stores, we operate two separate small-format design studios located in New Orleans, Louisiana and Dallas, Texas. Our headquarters, which we refer to as our store support center, is approximately 185,473 square feet and is located in Atlanta, Georgia. Additionally, we operate an approximately 37,000 square foot product review center in Marietta, GA, as well as a 20,400 square foot sample fulfillment center in Marietta, GA.
We lease our store support center, all of our stores, and our distribution centers. Most of our leases provide for a minimum rent and typically include escalating rent increases. Our leases also generally require us to pay insurance, utilities, real estate taxes and repair and maintenance expenses. See the information disclosed under the “Lease Commitments” caption in Note 9, “Commitments and Contingencies” of the notes to our consolidated financial statements included in this Annual Report for further detail on our leases.
ITEM 3. LEGAL PROCEEDINGS.
We are engaged in various legal actions, claims and proceedings arising in the ordinary course of business, including claims related to breach of contracts, product liabilities, intellectual property matters and employment related matters resulting from our business activities. As with most actions such as these, an estimation of any possible and/or ultimate liability cannot always be determined. Regardless of the outcome, litigation can have an adverse impact on us because of defense and settlement costs, diversion of management resources, and other factors. See the information disclosed under the “Litigation” caption in Note 9, “Commitments and Contingencies” to our consolidated financial statements included in this Annual Report for further detail on legal proceedings.
ITEM 4. MINE SAFETY DISCLOSURES.
Not applicable.
PART II
ITEM 5. MARKET FOR REGISTRANT’S COMMON EQUITY, RELATED STOCKHOLDER MATTERS AND ISSUER PURCHASES OF EQUITY SECURITIES.
Market Information
Our common stock has been listed on the NYSE under the symbol “FND” since our IPO on April 27, 2017. Prior to that date, there was no public market for our common stock. On February 21, 2022, there were 22 stockholders of record of our Class A common stock. The actual number of stockholders is greater than the number of record holders stated above, and includes stockholders who are beneficial owners, but whose shares are held in “street name” by brokers and other nominees. This number of holders of record also does not include stockholders whose shares may be held in trust by other entities.
Dividend Policy
No dividends have been declared or paid on our common stock. We intend to continue to retain all available funds and any future earnings for use in the operation and growth of our business, and therefore we do not currently expect to pay any cash dividends on our common stock. Any future determination to pay dividends will be at the discretion of our Board and will depend on then existing conditions, including our operating results, financial condition, contractual restrictions, capital requirements, business prospects and other factors that our Board may deem relevant.
Stock Performance Graph
The following graph shows a comparison of cumulative total return to holders of common stock against the cumulative total return of the S&P 500 Index and the S&P 500 Home Improvement Retail Index from April 27, 2017 (the date our common stock commenced trading on the NYSE) through December 30, 2021. The comparison of the cumulative total returns for each investment assumes that $100 was invested in our Class A common stock and the respective indices on April 27, 2017 through December 30, 2021, including reinvestment of any dividends. Historical share price performance should not be relied upon as an indication of future share price performance.
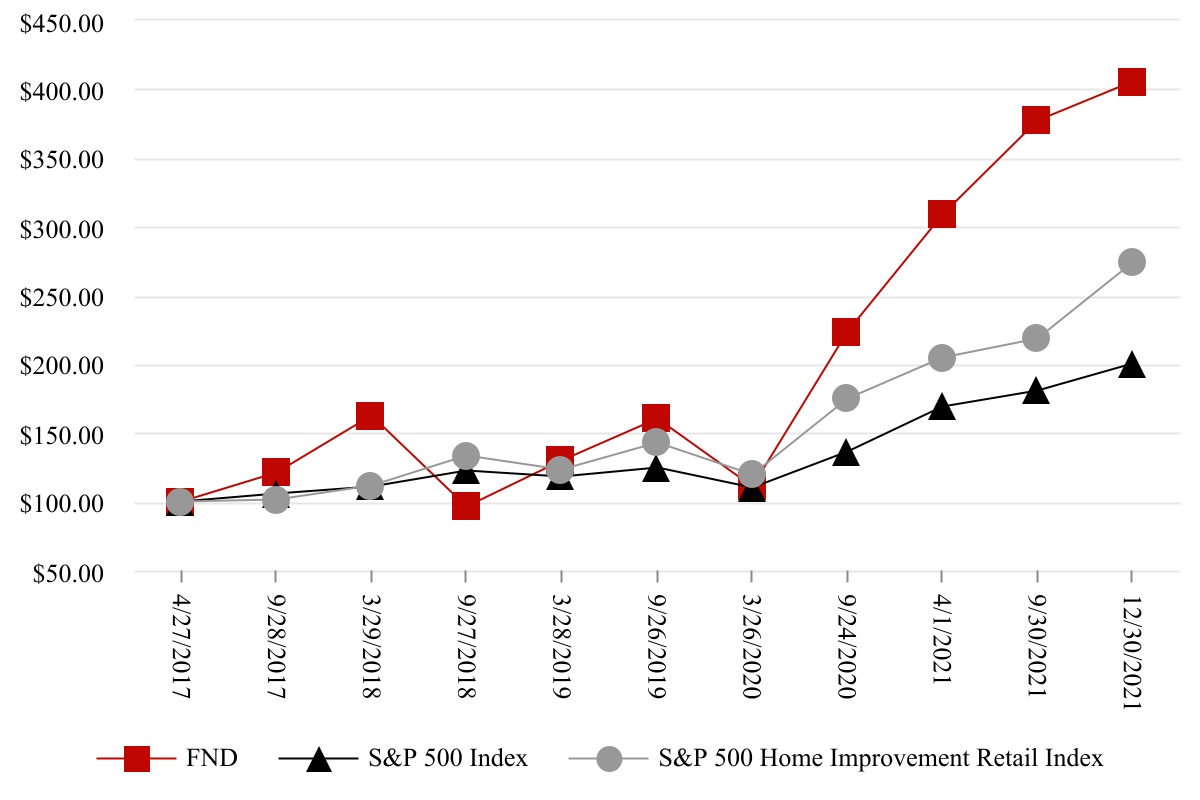
| | | | | | | | | | | | | | | | | | | | | | | | | | | | | | | | | | | |
| 4/27/2017 | 9/28/2017 | 3/29/2018 | 9/27/2018 | 3/28/2019 | 9/26/2019 | 3/26/2020 | 9/24/2020 | 4/1/2021 | 9/30/2021 | 12/30/2021 |
| FND | $ 100.00 | $ 120.81 | $ 162.62 | $ 95.85 | $ 129.52 | $ 160.03 | $ 110.61 | $ 223.24 | $ 308.55 | $ 376.88 | $ 405.55 |
| S&P 500 Index | $ 100.00 | $ 105.28 | $ 110.77 | $ 122.22 | $ 118.09 | $ 124.89 | $ 110.31 | $ 136.17 | $ 168.60 | $ 180.67 | $ 200.43 |
| S&P 500 Home Improvement Retail | $ 100.00 | $ 101.10 | $ 111.16 | $ 133.16 | $ 123.40 | $ 142.54 | $ 119.16 | $ 174.76 | $ 204.88 | $ 218.15 | $ 273.41 |
Unregistered Sales of Equity Securities and Use of Proceeds
None.
Repurchases of our Common Stock
None.
ITEM 6. RESERVED
ITEM 7. MANAGEMENT’S DISCUSSION AND ANALYSIS OF FINANCIAL CONDITION AND RESULTS OF OPERATIONS.
You should read the following discussion and analysis of our financial condition and results of operations together with our consolidated financial statements and the related notes thereto and other financial information included elsewhere in this filing. This discussion and analysis contains forward-looking statements that involve risks and uncertainties. Our actual results could differ materially from those anticipated in these forward-looking statements as a result of certain factors, including those discussed in “Item 1A. Risk Factors.” See the cautionary note regarding forward-looking statements set forth at the beginning of Part I of this Annual Report.
Overview
Founded in 2000, Floor & Decor is a high-growth, differentiated, multi-channel specialty retailer of hard surface flooring and related accessories with 160 warehouse-format stores across 33 states as of December 30, 2021. We believe that we offer the industry’s broadest assortment of tile, wood, laminate, vinyl, and natural stone flooring along with decorative and installation accessories and adjacent categories at everyday low prices positioning us as the one-stop destination for our customers’ entire hard surface flooring needs. We appeal to a variety of customers, including professional installers and commercial businesses (“Pro”), Do it Yourself customers (“DIY”), and customers who buy the products for professional installation (“Buy it Yourself” or “BIY”). Our warehouse-format stores, which average approximately 78,000 square feet, carry on average approximately 4,200 flooring and decorative and installation accessory SKUs, 1.1 million square feet of flooring products, and $2.3 million of inventory at cost. We believe that our inspiring design studios and creative and informative visual merchandising also greatly enhance our customers’ renovation experience. In addition to our stores, our website FloorandDecor.com showcases our products.
We believe our strong financial results are a reflection of a growing domestic hard surface flooring market, a unique approach to selling hard surface flooring, and our consistent and disciplined culture of innovation and reinvestment, together creating a differentiated business model in the hard surface flooring category. In fiscal 2021, we experienced our thirteenth year of comparable store sales growth, averaging 14.2% over this time period and 12.4% over the past three years.
| | | | | | | | | | | | | | | | | | | | | | | | | | | | |
| Fiscal Year Ended | | | | | |
| 12/30/2021 | | 12/31/2020 | | 12/26/2019 | | | | | CAGR |
| Comparable store sales (% change) (1) | 27.6 | % | | 5.5 | % | | 4.0 | % | | | | | N/A |
| Number of warehouse-format stores | 160 | | 133 | | 120 | | | | | 15.5 | % |
| Net sales (in thousands) | $ | 3,433,533 | | $ | 2,425,788 | | $ | 2,045,456 | | | | | 29.6 | % |
| Net income (in thousands) | $ | 283,230 | | $ | 194,981 | | $ | 150,631 | | | | | 37.1 | % |
(1) Fiscal 2020 comparable store sales exclude sales from the 53rd week.
During fiscal 2021, we continued to make key long-term strategic investments, including:
•investing in new solutions for new and existing commercial customers through our purchase of Spartan, a specialty hard-surface flooring distribution company that primarily serves the architectural and design community, end-users, and commercial flooring contractors (refer to Note 14, “Acquisition” for additional details);
•supporting our stores and distribution centers during this heightened period of sales, with particular emphasis on increasing staffing levels and working collaboratively throughout our supply chain to improve our in-stock inventory levels;
•opening 27 new warehouse-format stores, ending the year with 160 warehouse-format stores and two design studios;
•focusing on innovative new products and localized assortments, supported by inspirational in-store and online visual merchandising solutions;
•investing in our connected customer, in-store designer, and customer relationship and store focused technology;
•adding more resources dedicated to serving our Pro customers, including hiring a professional external sales staff to drive more commercial sales;
•providing proprietary credit offerings, including through our non-recourse Pro credit card; and
•investing capital to continue enhancing the in-store shopping experience for our customers.
COVID-19 Update
As the COVID-19 pandemic continues into fiscal 2022, we remain focused on five priorities while navigating through this period of volatility and uncertainty:
•First, protect the health and safety of our employees and customers through enhanced safety and sanitation measures at our stores, distribution centers, and store support center.
•Second, keep our brand strong and support all of our customers, including the numerous small businesses that rely upon us such as general contractors and flooring installers.
•Third, invest in store and distribution center staffing to support the heightened demand.
•Fourth, work with all of our supply chain partners to increase our in-stock inventory positions.
•Fifth, position Floor & Decor to emerge strong from this event.
We are working hard to continue monitoring and quickly responding to the ongoing impacts of the COVID-19 pandemic, including communicating often throughout the organization and adapting our operations to follow evolving federal, state, and local ordinances as well as health guidelines on mitigating the risk of COVID-19 transmission. We have teams in place monitoring this evolving situation and recommending risk mitigation actions, and we are encouraging social distancing practices.
We have also assessed and continue to implement supply chain continuity plans. While sales have remained strong as we continue to maintain a broad assortment of in-stock inventory, labor shortages and supply chain disruptions continue to cause logistical challenges for us and the entire hard surface flooring industry. In particular, there is significant congestion at ports of entry to the United States, which is increasing the time and cost to ship goods to our distribution centers and stores and has resulted in a decrease in our in-stock levels for certain products. While we have passed some of these higher transportation costs to our customers, we remain focused on providing exceptional value to our customers through our broad assortment and “everyday low price” strategy. We believe that our strong relationships with our suppliers and transportation partners have been instrumental in helping us to navigate this difficult supply chain environment; however, the potential significance and duration of these supply chain disruptions is uncertain, and future capacity shortages or cost increases could have an adverse impact upon our business.
There remains substantial uncertainty regarding the potential duration and severity of the COVID-19 pandemic, including how public health restrictions imposed to slow the spread of the virus may evolve. There may also be future “waves” or new variants of COVID-19 infections despite vaccines and other measures implemented to mitigate its spread. Although our stores are currently open to the public, we may face future closure requirements and other operational restrictions at some or all of our physical locations for prolonged periods of time if federal, state, and local authorities impose new and potentially more stringent restrictions such as shelter-in-place orders. We also may face store closures due to staffing challenges, including if store and distribution center associates are in quarantine due to the COVID-19 pandemic. In addition, changes in consumer behavior due to financial, health, or other concerns may continue even after the COVID-19 pandemic and may reduce consumer demand for our products. Further, some of the countries from which we source inventory and other necessary supplies are not vaccinating their populations as quickly or effectively as the U.S., which could further constrain our ability to obtain inventory and other necessary supplies. As a result of these and other uncertainties, the full financial impact of the pandemic cannot be reasonably estimated at this time.
Fiscal 2022 – A Look At The Upcoming Year
We believe that our compelling business model, in addition to the projected growth of the large and highly fragmented hard surface flooring market, provides us with an opportunity to significantly expand our store base in the U.S. from 160 warehouse-format stores as of December 30, 2021 to at least 500 stores nationwide within the next 8 to 10 years based on our past success as well as internal research with respect to housing density, demographic data, competitor concentration, and other variables in both new and existing markets. In 2022, we plan to grow our warehouse store base by approximately 20% and add four small design studios. In addition to opening new stores, our focus will be on executing our core strategies, expanding our commercial business by adding Floor & Decor commercial sales representatives and growing sales at our Spartan subsidiary, and continuing to make other investments that we believe will support our long-term growth, as outlined in “Item 1. Business - Our Growth Strategy.” Our ability to open profitable new stores depends on many factors, including the successful selection of new markets and store locations, our ability to negotiate leases on acceptable terms, and our ability to attract highly qualified managers and staff. For further information, see “Risk Factors—Risks Related to Our Business.”
Key Performance Indicators
We consider a variety of performance and financial measures in assessing the performance of our business. The key measures we use to determine how our business is performing are comparable store sales, the number of new store openings, gross profit and gross margin, operating income, and EBITDA and Adjusted EBITDA.
Comparable Store Sales
Our comparable store sales growth is a significant driver of our net sales, profitability, cash flow, and overall business results. We believe that comparable store sales growth is generated by continued focus on providing a dynamic and expanding product assortment in addition to other merchandising initiatives, quality of customer service, enhancing sales and marketing strategies, improving visual merchandising and overall aesthetic appeal of our stores and our website, effectively serving our Pro customers, continued investment in store staff and infrastructure, growing our proprietary credit offering, and further integrating connected customer strategies and other key information technology enhancements.
Comparable store sales refer to period-over-period comparisons of our net sales among the comparable store base and are based on when the customer obtains control of the product, which is typically at the time of sale. A store is included in the comparable store sales calculation on the first day of the thirteenth full fiscal month following a store’s opening, which is when we believe comparability has been achieved. Changes in our comparable store sales between two periods are based on net sales for stores that were in operation during both of the two periods. Any change in the square footage of an existing comparable store, including for remodels and relocations within the same primary trade area of the existing store being relocated, does not eliminate that store from inclusion in the calculation of comparable store sales. Stores that are closed for a full fiscal month or longer are excluded from the comparable store sales calculation for each full fiscal month that they are closed. Since our e-commerce, regional account manager, and design studio sales are fulfilled by individual stores, they are included in comparable store sales only to the extent the fulfilling store meets the above mentioned store criteria. Sales through our Spartan subsidiary do not involve our stores and are therefore excluded from the comparable store sales calculation.
Our fiscal 2020 year, which ended December 31, 2020, includes a 53rd week. When presenting comparable store sales for fiscal 2020, we have excluded the last week of fiscal 2020.
Definitions and calculations of comparable store sales differ among companies in the retail industry; therefore, comparable store metrics disclosed by us may not be comparable to the metrics disclosed by other companies.
We believe that comparable store sales is a useful measure as it allows management as well as analysts, investors, and other interested parties to evaluate the sales performance of our retail stores. In addition, comparable store sales highlights our sales and market share growth. Management uses comparable store sales to evaluate the effectiveness of our selling strategies, to make budgeting decisions, and to compare our performance against that of other peer companies using similar measures.
Various factors affect comparable store sales, including:
•national and regional economic conditions;
•the retail sales environment and other retail trends;
•the home improvement spending environment;
•the hard surface flooring industry trends;
•the impact of competition;
•changes in our product mix;
•changes in staffing at our stores;
•cannibalization resulting from the opening of new stores in existing markets;
•changes in pricing;
•changes in advertising and other operating costs; and
•weather conditions.
Number of New Stores
The number and timing of new store openings, and the costs and fixed lease obligations associated with those openings, have had, and are expected to continue to have, a significant impact on our results of operations. The number of new stores reflects the number of stores opened during a particular reporting period. Before we open new stores, we incur pre-opening expenses, which are defined below. While net sales at new stores are generally lower than net sales at our stores that have been open for more than one year, our new stores have historically been profitable in their first year. Generally, our newer stores have also averaged higher comparable store sales growth than our total store average. Our ability to open new, profitable stores is important to our long-term sales and profit growth goals.
Gross Profit and Gross Margin
Our gross profit is variable in nature and generally follows changes in net sales. Our gross profit and gross margin can also be impacted by changes in our prices, our merchandising assortment, shrink, damage, selling of discontinued products, the cost to transport our products from the manufacturer to our stores, and our distribution center costs. With respect to our merchandising assortment, certain of our products tend to generate somewhat higher margins than other products within the same product categories or among different product categories. We have experienced inflation increases in certain of our product categories but historically have been able to source from a different manufacturer or pass increases onto our consumers. Our gross profit and gross margin, which reflect our net sales and our cost of sales and any changes to the components thereof, allow us to evaluate our profitability and overall business results.
Gross profit is calculated as net sales less cost of sales. Gross profit as a percentage of net sales is referred to as gross margin. Cost of sales consists of merchandise costs, as well as freight costs to transport inventory to our distribution centers and stores, and duty and other costs that are incurred to distribute the merchandise to our stores. Cost of sales also includes shrinkage, damage product disposals, distribution, warehousing costs, sourcing and compliance costs. We receive cash consideration from certain vendors related to vendor allowances and volume rebates, which is recorded as a reduction of costs of sales as the inventory is sold or as a reduction of the carrying value of inventory while the inventory is still on hand. Costs associated with arranging and paying for freight to deliver products to customers is included in cost of sales. The components of our cost of sales may not be comparable to the components of cost of sales, or similar measures, of other retailers. As a result, data in this filing regarding our gross profit and gross margin may not be comparable to similar data made available by other retailers.
We believe that gross profit and gross margin are useful measures as they allow management and analysts, investors, and other interested parties to evaluate the cost and profitability of our products and overall cost of sales, which is our largest expense. Gross profit and gross margin are also important indicators of our ability to grow profits and leverage our expenses on a growing sales base. Management uses gross profit and gross margin, among other measures, to make decisions related to product, pricing, supplier, and distribution strategies as well as other areas affecting the products we offer to our customers.
Operating Income, EBITDA, Adjusted EBITDA
Operating income, EBITDA, and Adjusted EBITDA are key metrics used by management and our Board to assess our financial performance and enterprise value. We believe that operating income, EBITDA, and Adjusted EBITDA are useful measures, as they eliminate certain expenses that are not indicative of our core operating performance and facilitate a comparison of our core operating performance on a consistent basis from period to period. We also use Adjusted EBITDA as a basis to determine covenant compliance with respect to our Credit Facilities, to supplement GAAP measures of performance to evaluate the effectiveness of our business strategies, to make budgeting decisions, and to compare our performance against that of other peer companies using similar measures. Operating income, EBITDA and Adjusted EBITDA are also frequently used by analysts, investors and other interested parties as performance measures to evaluate companies in our industry.
EBITDA and Adjusted EBITDA are supplemental measures of financial performance that are not required by, or presented in accordance with, GAAP. We define EBITDA as net income before interest, (gain) loss on early extinguishment of debt, taxes, depreciation and amortization. We define Adjusted EBITDA as net income before interest, (gain) loss on early extinguishment of debt, taxes, depreciation and amortization, adjusted to eliminate the impact of certain items that we do not consider indicative of our core operating performance.
EBITDA and Adjusted EBITDA are non-GAAP measures of our financial performance and should not be considered as alternatives to net income as a measure of financial performance or any other performance measure derived in accordance with GAAP and they should not be construed as an inference that our future results will be unaffected by unusual or non-recurring items. Additionally, EBITDA and Adjusted EBITDA are not intended to be measures of liquidity or free cash flow for management's discretionary use. In addition, these non-GAAP measures exclude certain non-recurring and other charges. Each of these non-GAAP measures has its limitations as an analytical tool, and you should not consider them in isolation or as a substitute for analysis of our results as reported under GAAP. In evaluating EBITDA and Adjusted EBITDA, you should be aware that in the future we will incur expenses that are the same as or similar to some of the items eliminated in the adjustments made to determine EBITDA and Adjusted EBITDA, such as stock-based compensation expense, losses on asset impairments and disposals, and other adjustments. Our presentation of EBITDA and Adjusted EBITDA should not be construed to imply that our future results will be unaffected by any such adjustments. Definitions and calculations of EBITDA and Adjusted EBITDA differ among companies in the retail industry, and therefore EBITDA and Adjusted EBITDA disclosed by us may not be comparable to the metrics disclosed by other companies.
Other Key Financial Definitions
Net Sales
The retail and commercial sectors in which we operate are cyclical, and consequently our sales are affected by general economic conditions. Purchases of our products are sensitive to trends in the levels of consumer spending, which are affected by a number of factors such as consumer disposable income, housing market conditions, unemployment trends, stock market performance, consumer debt levels and consumer credit availability, interest rates and inflation, tax rates and overall consumer confidence in the economy.
Net sales reflect our sales of merchandise, less discounts and estimated returns and include our in-store sales and e-commerce sales. In certain cases, we arrange and pay for freight to deliver products to customers and bill the customer for the estimated freight cost, which is also included in net sales. Revenue is recognized when we satisfy the performance obligations in contracts with our customers. Our performance obligations for our retail store sales, as well as for orders placed through our website and shipped to our customers, are satisfied at the point at which the customer obtains control of the inventory, which is typically at the point-of-sale.
Selling and Store Operating Expenses
We expect that our selling and store operating expenses will increase in future periods with future growth. Selling and store operating expenses consist primarily of store personnel wages, bonuses and benefits, rent and infrastructure expenses, supplies, depreciation and amortization, training expenses, and advertising costs. Credit card fees, insurance, personal property taxes, and other miscellaneous operating costs are also included.
The components of our selling and store operating expenses may not be comparable to the components of similar measures of other retailers.
General and Administrative Expenses
We expect that our general and administrative expenses will increase in future periods with future growth and in part due to additional legal, accounting, insurance, and other expenses that we expect to incur as a result of being a public company, including compliance with the Sarbanes-Oxley Act. General and administrative expenses include both fixed and variable components, and therefore, are not directly correlated with net sales.
General and administrative expenses consist primarily of costs incurred outside of our stores and include administrative personnel wages in our store support center and regional functions, bonuses and benefits, supplies, depreciation and amortization, and store support center expenses. Insurance, legal expenses, information technology costs, consulting, and other miscellaneous operating costs are also included.
The components of our general and administrative expenses may not be comparable to the components of similar measures of other retailers.
Pre-opening Expenses
We account for non-capital operating expenditures incurred prior to opening a new store or relocating an existing store as “pre-opening” expenses in our Consolidated Statements of Operations and Comprehensive Income. Our pre-opening expenses begin, on average, three months to one year in advance of a store opening or relocating due to, among other things, the amount of time it takes to prepare a store for its grand opening. The majority of pre-opening expenses are incurred during the three months before a store opens. Pre-opening expenses primarily include the following: rent, advertising, training, staff recruiting, utilities, personnel, and equipment rental. A store is considered to be relocated if it is closed temporarily and re-opened within the same primary trade area.
Segments
We have two operating segments and one reportable segment. For additional segment information, refer to Note 1, “Summary of Significant Accounting Policies” of the notes to the consolidated financial statements included in this Annual Report.
Results of Operations
The comparison of the fiscal years ended December 31, 2020 and December 26, 2019 can be found in our annual report on Form 10-K for the fiscal year ended December 31, 2020 (the “2020 Annual Report”) located within Part II, Item 7. Management's Discussion and Analysis of Financial Condition and Results of Operations.
Results of operations for prior periods should not be considered indicative of future results. While our revenue and earnings were strong during fiscal 2021 compared to fiscal 2020, the full impact that the COVID-19 pandemic could have on our business remains highly uncertain. See “Management’s Discussion and Analysis of Financial Condition and Results of Operations - COVID-19 Update” and Item 1A., “Risk Factors” for more information about the potential impacts that the COVID-19 pandemic may have on our results of operations and overall financial performance for future periods.
For the fiscal years ended December 30, 2021 and December 31, 2020
The following table summarizes key components of our results of operations for the periods indicated, in dollars and as a percentage of net sales (actuals in thousands, dollar changes in millions; certain numbers may not sum due to rounding):
| | | | | | | | | | | | | | | | | | | | | | | | | | | | | | | | | | | | | | |
| | Fiscal Year Ended | | | | |
| | 12/30/2021 | | 12/31/2020 | |
| | |
| | Actual | | % of Sales | | Actual | | % of Sales | | $ Increase/(Decrease) | | % Increase/(Decrease) |
| Net sales | | $ | 3,433,533 | | | 100.0 | % | | $ | 2,425,788 | | | 100.0 | % | | $ | 1,007.7 | | | 41.5 | % |
| Cost of sales | | 2,011,267 | | | 58.6 | | | 1,390,896 | | | 57.3 | | | 620.4 | | | 44.6 | |
| Gross profit | | 1,422,266 | | | 41.4 | | | 1,034,892 | | | 42.7 | | | 387.4 | | | 37.4 | |
| Operating expenses: | | | | | | | | | | | | |
| Selling and store operating | | 849,440 | | | 24.7 | | | 654,100 | | | 27.0 | | | 195.3 | | | 29.9 | |
| General and administrative | | 199,401 | | | 5.8 | | | 144,715 | | | 6.0 | | | 54.7 | | | 37.8 | |
| Pre-opening | | 34,433 | | | 1.0 | | | 21,498 | | | 0.9 | | | 12.9 | | | 60.2 | |
| Total operating expenses | | 1,083,274 | | | 31.5 | | | 820,313 | | | 33.8 | | | 263.0 | | | 32.1 | |
| Operating income | | 338,992 | | | 9.9 | | | 214,579 | | | 8.8 | | | 124.4 | | | 58.0 | |
| Interest expense, net | | 4,924 | | | 0.1 | | | 8,389 | | | 0.3 | | | (3.5) | | | (41.3) | |
| Gain on early extinguishment of debt | | — | | | — | | | (1,015) | | | — | | | 1.0 | | | NM |
| Income before income taxes | | 334,068 | | | 9.7 | | | 207,205 | | | 8.5 | | | 126.9 | | | 61.2 | |
| Provision for income taxes | | 50,838 | | | 1.5 | | | 12,224 | | | 0.5 | | | 38.6 | | | 315.9 | |
| Net income | | $ | 283,230 | | | 8.2 | % | | $ | 194,981 | | | 8.0 | % | | $ | 88.2 | | | 45.3 | % |
NM- Not Meaningful
| | | | | | | | | | | | | | |
| | Fiscal Year Ended |
| | 12/30/2021 | | 12/31/2020 |
| Comparable store sales (% change) (1) | | 27.6% | | 5.5% |
| Comparable average ticket (% change) (1) | | 7.2% | | 0.7% |
| Comparable customer transactions (% change) (1) | | 19.1% | | 4.8% |
Number of warehouse-format stores | | 160 | | 133 |
| Adjusted EBITDA (in thousands) (2) | | $ | 485,100 | | $ | 322,995 |
Adjusted EBITDA margin | | 14.1% | | 13.3% |
(1) Comparable store sales, comparable average ticket, and comparable customer transactions exclude sales from the 53rd week in fiscal 2020.
(2) Refer to “Reconciliation of Non-GAAP Measures” further below for reconciliation of Adjusted EBITDA to net income.
Impact of the 53rd Week in Fiscal 2020
The 53rd week in fiscal 2020 added approximately $41.8 million in net sales as well as an estimated $8.5 million in operating income, $6.4 million in net income, $0.06 in diluted earnings per share, $8.5 million in EBITDA, and $8.8 million in adjusted EBITDA. When presenting comparable store sales for fiscal 2020, we have excluded the last week of fiscal 2020.
Net Sales
Net sales during fiscal 2021 increased $1,007.7 million, or 41.5%, compared to fiscal 2020 primarily due to an increase in comparable store sales of 27.6% and the addition of 27 new warehouse stores during the year. The comparable store sales increase during the period of 27.6%, or $657.9 million, was driven by a 19.1% increase in comparable customer transactions and a 7.2% increase in comparable average ticket. Comparable sales increased among all of our product categories during fiscal 2021. Non-comparable store sales increased $349.8 million during the same period primarily due to the increase in new stores and sales from our Spartan subsidiary, acquired in June 2021.
We believe the increase in sales for fiscal 2021 is also due in part to (i) unprecedented government intervention to help mitigate the negative impacts of the COVID-19 pandemic and (ii) customers investing in home improvements while spending less on leisure activities like travel, eating out, sporting events, and hotels. We also believe that our business model, with its focus on substantial amounts of trend-right, in-stock inventory, is also contributing to the sales increase. In addition, our total sales growth and associated comparable store sales growth for fiscal 2021 were particularly strong because in late March of fiscal 2020, we closed the interior of our stores to the public as a precautionary measure due to COVID-19. We began re-opening our stores in early May of fiscal 2020, and by early June, all of our stores were fully open to the public. Further, the addition of a 53rd-week in fiscal 2020, which was the last week in December, a historically low volume week, shifted the beginning of fiscal 2021 to January and modestly benefited fiscal 2021 comparable store sales growth.
Gross Profit and Gross Margin
Gross profit during fiscal 2021 increased $387.4 million, or 37.4%, compared to fiscal 2020. The increase in gross profit was primarily driven by the 41.5% increase in net sales, partially offset by a decrease in gross margin to 41.4%, down approximately 130 basis points from 42.7% in fiscal 2020. The decrease in gross margin was primarily due to higher freight costs.
Selling and Store Operating Expenses
Selling and store operating expenses during fiscal 2021 increased $195.3 million, or 29.9%, compared to fiscal 2020, primarily driven by the opening of 27 new warehouse stores during the year as well as additional staffing to satisfy sales growth. As a percentage of net sales, our selling and store operating expenses decreased by approximately 230 basis points to 24.7%, down from 27.0% in fiscal 2020. Comparable store selling and store operating expenses as a percentage of comparable store sales decreased by approximately 300 basis points. The decreases in selling and store operating expenses as a percentage of both overall sales and comparable store sales were primarily due to leverage of occupancy, payroll, and advertising costs driven by significantly higher sales during fiscal 2021 compared with fiscal 2020 when our stores were limited to curbside services and not fully open to the public during the first and second quarters.
General and Administrative Expenses
General and administrative expenses increased $54.7 million, or 37.8%, during fiscal 2021 compared to fiscal 2020 due to higher incentive compensation expense and costs to support store growth, including increased store support staff, higher depreciation related to technology and other store support center investments, and expenses related to the Spartan acquisition. Our general and administrative expenses as a percentage of net sales decreased approximately 20 basis points to 5.8%, down from 6.0% in the prior year. The decline as a percentage of net sales was primarily driven by sales growing faster than increases in store support staffing and occupancy costs, partially offset by acquisition-related expenses and intangible asset amortization resulting from our purchase of Spartan in the second quarter of fiscal 2021 (refer to Note 14, “Acquisition” for additional information regarding the Spartan acquisition).
Pre-Opening Expenses
Pre-opening expenses during fiscal 2021 increased $12.9 million, or 60.2%, compared to fiscal 2020. The increase is primarily the result of an increase in the number of stores that we either opened or were preparing for opening compared to the prior year period. We opened 27 warehouse stores during fiscal 2021 as compared to opening 13 warehouse stores and one design studio in fiscal 2020.
Interest Expense
Net interest expense in fiscal 2021 decreased $3.5 million, or 41.3%, compared to fiscal 2020. The decrease in interest expense was primarily due to lower revolver and term loan borrowings and a decrease in term loan interest rates compared to the prior year.
Income Taxes
The provision for income taxes was $50.8 million in fiscal 2021 compared to $12.2 million in fiscal 2020. The effective tax rate was 15.2% for fiscal 2021 compared to 5.9% for fiscal 2020. The increase in the effective tax rate was primarily due to the recognition of income tax benefits in connection with the CARES Act during fiscal 2020 and higher earnings in fiscal 2021.
Reconciliation of Non-GAAP Financial Measures
EBITDA and Adjusted EBITDA
For the periods presented, the following table reconciles EBITDA and Adjusted EBITDA to net income, the most directly comparable financial measure calculated and presented in accordance with GAAP:
| | | | | | | | | | | | | | | | |
| | Fiscal Year Ended | | |
| in thousands | | 12/30/2021 | | 12/31/2020 | | |
| Net income | | $ | 283,230 | | | $ | 194,981 | | | |
| Depreciation and amortization (a) | | 115,223 | | | 90,520 | | | |
| Interest expense, net | | 4,924 | | | 8,389 | | | |
| Gain on early extinguishment of debt (b) | | — | | | (1,015) | | | |
| Income tax expense | | 50,838 | | | 12,224 | | | |
| EBITDA | | 454,215 | | | 305,099 | | | |
| Stock-based compensation expense (c) | | 20,528 | | | 16,115 | | | |
| Acquisition and integration expense (d) | | 3,392 | | | — | | | |
| Tariff refund adjustments (e) | | 1,728 | | | (3,660) | | | |
| COVID-19 costs (f) | | 1,154 | | | 3,562 | | | |
| Other (g) | | 4,083 | | | 1,879 | | | |
| Adjusted EBITDA | | $ | 485,100 | | | $ | 322,995 | | | |
(a) Excludes amortization of deferred financing costs, which is included as part of interest expense, net in the table above.
(b) Represents gain on partial debt extinguishment in connection with the May 2020 amendment to the senior secured term loan credit facility.
(c) Non-cash charges related to stock-based compensation programs, which vary from period to period depending on the timing of awards and forfeitures.
(d) Represents third-party transaction, legal, and consulting costs directly related to the acquisition of Spartan.
(e) Represents a reduction in estimated tariff refund receivables during fiscal 2021 and income for incremental tariff refunds recognized for certain bamboo and other flooring products during fiscal 2020. Interest income for tariff refunds is included within interest expense, net in the table above.
(f) Amounts are comprised of sanitation, personal protective equipment, and other costs directly related to efforts to mitigate the impact of the COVID-19 pandemic on our business.
(g) Other adjustments include amounts management does not consider indicative of our core operating performance. Amounts for fiscal 2021 primarily relate to relocation expenses for our Houston distribution center and changes in the fair value of the contingent earn-out liability associated with the Spartan acquisition. Amounts for fiscal 2020 primarily relate to relocation expenses for our Houston distribution center, costs associated with two secondary public offerings of the Company’s Class A common stock by certain of our stockholders, and legal fees associated with the February 2020 amendment to our senior secured term loan credit facility. The Company did not sell any shares in the offerings and did not receive any proceeds from the sale of shares by the selling stockholders.
Seasonality
Historically, our business has had very little seasonality. Our specialty hard surface flooring and decorative home product offering makes us less susceptible to holiday shopping seasonal patterns compared to other retailers. However, we generally conduct a clearance event during our third fiscal quarter followed by a smaller clearance event towards the end of the year. The timing of these clearance events is driven by operational considerations rather than customer demand and could change from year to year.
Liquidity and Capital Resources
Liquidity is provided primarily by our cash flows from operations and our $400.0 million ABL Facility. Unrestricted liquidity based on our December 30, 2021 financial data was $516.9 million, consisting of $139.4 million in cash and cash equivalents and $377.5 million immediately available for borrowing under the ABL Facility without violating any covenants thereunder. Our liquidity is not generally seasonal, and our uses of cash are primarily tied to when we open stores and make other capital expenditures.
Our primary cash needs are for merchandise inventories, payroll, store rent, and other operating expenses and capital expenditures associated with opening new stores and remodeling existing stores, as well as information technology, e-commerce, and store support center infrastructure. We also use cash for the payment of taxes and interest and, as applicable, acquisitions.
The most significant components of our operating assets and liabilities are merchandise inventories and accounts payable, and, to a lesser extent, accounts receivable, prepaid expenses and other assets, other current and non-current liabilities, and tax payables and receivables. Merchandise inventory is considered “in-transit” or “available for sale” based on whether we have physically received the products at an individual store location or in one of our four distribution centers. In-transit inventory generally varies due to contractual terms, country of origin, transit times, international holidays, weather patterns, and other factors.
Impact of the COVID-19 Pandemic on Liquidity
While our primary sources of funds for business activities are typically cash flows from operations and our existing credit facilities, the full potential impact of the pandemic on our sources of funds and liquidity cannot be reasonably estimated at this time due to uncertainty regarding the potential severity and duration of the pandemic and its future effect on our business. For additional discussion of the impact of the COVID-19 pandemic on our business, refer to “Management’s Discussion and Analysis of Financial Condition and Results of Operations - COVID-19 Update.”
We continue to monitor the impact of the COVID-19 pandemic on our business and may, as necessary, reduce expenditures, borrow additional amounts under our Term Loan Facility and ABL Facility, or pursue other sources of capital that may include other forms of external financing in order to increase our cash position and preserve financial flexibility. The pandemic may continue to drive volatility and uncertainty in financial and credit markets. Our continued access to external sources of liquidity depends on multiple factors, including the condition of debt capital markets, our operating performance, and maintaining strong credit ratings. If the impacts of the pandemic continue to create severe disruptions or turmoil in the financial markets, or if rating agencies lower our credit ratings, it could adversely affect our ability to access the debt markets, our cost of funds, and other terms for new debt or other sources of external liquidity. We expect that cash generated from operations together with cash on hand, the availability of borrowings under our credit facilities, and if necessary, additional funding through other forms of external financing, will be sufficient to meet liquidity requirements, anticipated capital expenditures, and payments due under our credit facilities for the next twelve months and the foreseeable future.
The exact scope of our capital plans is evolving and will ultimately depend on a variety of factors, including the impact of the COVID-19 pandemic on our business. Total capital expenditures in fiscal 2022 are planned to be between approximately $550 million to $590 million and will be funded primarily by cash generated from operations and borrowings under the ABL Facility. Our capital needs may change in the future due to changes in our business, including in response to the COVID-19 pandemic, or new opportunities that we choose to pursue. We currently expect the following for capital expenditures in fiscal 2022:
•open 32 warehouse-format stores and four small-format design studios, relocate stores, and begin construction on stores opening in fiscal 2023 using approximately $405 million to $430 million of cash;
•invest in existing store remodeling projects and our distribution centers using approximately $100 million to $110 million of cash; and
•invest in information technology infrastructure, e-commerce, and other store support center initiatives using approximately $45 million to $50 million of cash.
Cash Flow Analysis
A summary of our operating, investing, and financing activities are shown in the following table:
| | | | | | | | | | | | | | |
| | Fiscal Year Ended |
in thousands | | 12/30/2021 | | 12/31/2020 |
Net cash provided by operating activities | | $ | 301,342 | | | $ | 406,164 | |
Net cash used in investing activities | | (471,238) | | | (212,448) | |
| Net cash provided by financing activities | | 1,568 | | | 87,019 | |
| Net (decrease) increase in cash and cash equivalents | | $ | (168,328) | | | $ | 280,735 | |
Net Cash Provided By Operating Activities
Cash provided by operating activities consists primarily of (i) net income adjusted for non-cash items, including depreciation and amortization, deferred income taxes, and stock-based compensation and (ii) changes in working capital.
Net cash provided by operating activities was $301.3 million for fiscal 2021 and $406.2 million for fiscal 2020. The decrease in net cash provided by operating activities was primarily the result of a net increase in inventory and other working capital items to support our operations that more than offset the increase in cash earnings.
Net Cash Used In Investing Activities
Investing activities typically consist primarily of capital expenditures for new store openings, existing store remodels (including leasehold improvements, new racking, new fixtures, new product and display vignettes, and enhanced design studios) and new infrastructure and information systems. Cash payments to acquire a business are also included in investing activities.
Net cash used in investing activities was $471.2 for fiscal 2021 and $212.4 for fiscal 2020. The increase in net cash used in investing activities was driven by a $258.8 million increase in capital expenditures and $63.6 million in cash paid as part of the purchase price to acquire Spartan (refer to Note 14, "Acquisition" for additional details). The year-over-year growth in capital expenditures was primarily driven by (i) an increase in new stores that opened or were under construction, as we generally incur significant capital expenditures for new stores a few to several months in advance of opening, (ii) ongoing construction for the Houston distribution center relocation, and (iii) an increase in existing store remodels. During fiscal 2021, approximately 68% of non-acquisition related capital expenditures were for new stores and 27% were for existing stores and distribution centers, while the remaining spending was primarily associated with information technology, e-commerce, and store support center investments to support our growth.
Net Cash Provided by Financing Activities
Financing activities consist primarily of borrowings and related repayments under our credit agreements as well as proceeds from the exercise of stock options and our employee share purchase program.
Net cash provided by financing activities was $1.6 million for fiscal 2021 compared to $87.0 million for fiscal 2020. The decrease was primarily driven by the repayment of a portion of our Term Loan Facility during fiscal 2021 compared with net proceeds from the Term Loan Facility during fiscal 2020.
Our Credit Facilities
As of December 30, 2021, total Term Loan Facility debt was $197.9 million, while no amounts were outstanding under our ABL Facility. For details regarding our Term Loan Facility and ABL Facility, including applicable covenants, please refer to Note 10, “Debt.”
On February 9, 2021 (the “Effective Date”), we entered into a fifth amendment to the credit agreement governing our senior secured term loan facility (as amended, the “Term Loan Facility”). The fifth amendment provided for, among other things, a supplemental term loan in the aggregate principal amount of $65.0 million (the "Supplemental Term Loan Facility") that increased the term loan B facility. The Supplemental Term Loan Facility has the same maturity date (February 14, 2027) and terms as the term loan B facility, except that voluntary prepayments made within six months after the Effective Date are subject to a 1% soft call prepayment premium. The other terms of loans under the Term Loan Facility remain unchanged, including the applicable margin for loans under the term loan B facility. The proceeds of the Supplemental Term Loan Facility, together with cash on hand, were used to (i) repay the $75.0 million term loan B-1 facility and (ii) pay fees and expenses incurred in connection with the Supplemental Term Loan Facility.
In July 2017, the Financial Conduct Authority (the authority that regulates LIBOR) announced it intends to stop compelling banks to submit rates for the calculation of LIBOR after 2021. The Alternative Reference Rates Committee (“ARRC”) has proposed that the Secured Overnight Financing Rate (“SOFR”) is the rate that represents best practice as the alternative to USD-LIBOR for use in derivatives and other financial contracts that are currently indexed to USD-LIBOR. ARRC has proposed a paced market transition plan to SOFR from USD-LIBOR and organizations are currently working on industry wide and company specific transition plans as it relates to derivatives and cash markets exposed to USD-LIBOR. Both of our debt facilities are indexed to USD-LIBOR, and we believe all our material agreements have appropriate language to negotiate a transition to an alternative index rate. While we are continuing to monitor this activity and evaluate the potential risks, we do not expect this transition to have a material impact on interest due under our existing credit facilities.
Credit Ratings
Our credit ratings are periodically reviewed by rating agencies. In November 2021, Moody's reaffirmed the Company's issuer corporate family rating of Ba3 and changed its outlook for the Company to positive from stable. In December 2021, Standard & Poor's reaffirmed the Company's corporate credit rating of BB- and the Company’s positive outlook. These ratings and our current credit condition affect, among other things, our ability to access new capital. Negative changes to these ratings may result in more stringent covenants and higher interest rates under the terms of any new debt. Our credit ratings could be lowered or rating agencies could issue adverse commentaries in the future, which could have a material adverse effect on our business, financial condition, results of operations, and liquidity. In particular, a weakening of our financial condition, including an increase in our leverage or decrease in our profitability or cash flows, could adversely affect our ability to obtain necessary funds, result in a credit rating downgrade or change in outlook, or otherwise increase our cost of borrowing.
Supply Chain Finance Program
As part of our ongoing efforts to improve cash flow and liquidity, we facilitate a voluntary supply chain finance program (the “Finance Program”) for certain of our suppliers. Suppliers that participate in the Finance Program extend our payment terms by approximately 40 days on average. Under with the Finance Program, participating suppliers may choose to sell receivables due from us to a participating financial institution at the sole discretion of both the suppliers and the financial institution. The Finance Program is administered by a third-party financial institution, and the Company's responsibility is limited to making payment on the terms originally negotiated with participating suppliers, regardless of whether such suppliers sell receivables to the financial institution. Suppliers who choose to participate in the Finance Program may, at their sole discretion, make offers to the financial partners who administer the Finance Program to finance one or more payment obligations of the Company prior to their scheduled due dates at a discounted price to the third party financial institution.
Accordingly, amounts due to our suppliers that elected to participate in the Finance Program totaled $160.4 million and $88.2 million as of December 30, 2021 and December 31, 2020, respectively, and are included in trade accounts payable in our Consolidated Balance Sheets. Payments made under the Finance Program are reflected in net cash provided by operating activities in our Consolidated Statements of Cash Flows.
Material Cash Requirements, including Contractual Obligations to Third Parties
We enter into long-term obligations and commitments in the normal course of business, primarily debt obligations and non-cancelable operating leases. The following table summarizes our material cash requirements over the next several periods from known contractual or other obligations as of December 30, 2021:
| | | | | | | | | | | | | | | | | | | | | | | | | | | | | | | | | | | | | | | | | | | | |
| | Payments due by period |
| in thousands | | Total | | 12/29/2022 | | 12/28/2023 | | 12/26/2024 | | 12/25/2025 | | 12/31/2026 | | Thereafter |
| Operating leases (1) | | $ | 1,657,614 | | | $ | 163,924 | | | $ | 170,295 | | | $ | 161,516 | | | $ | 151,944 | | | $ | 143,693 | | | $ | 866,242 | |
| Purchase obligations (2) | | 821,569 | | | 819,587 | | | 1,833 | | | 149 | | | — | | | — | | | — | |
| Term loans | | 206,602 | | | 2,103 | | | 2,103 | | | 2,103 | | | 2,103 | | | 2,629 | | | 195,561 | |
| Estimated interest (3) | | 25,311 | | | 5,426 | | | 5,140 | | | 5,107 | | | 4,391 | | | 4,215 | | | 1,032 | |
| Letters of credit | | 22,460 | | | 22,460 | | | — | | | — | | | — | | | — | | | — | |
| Total | | $ | 2,733,556 | | | $ | 1,013,500 | | | $ | 179,371 | | | $ | 168,875 | | | $ | 158,438 | | | $ | 150,537 | | | $ | 1,062,835 | |
(1)We enter into operating leases during the normal course of business. Most lease arrangements provide us with the option to renew the leases at defined terms. The future operating lease obligations set forth above would change if we were to exercise these options or enter into additional operating leases.
(2)Purchase obligations include all legally binding contracts such as firm commitments for inventory purchases, container commitments, software and license commitments, and legally binding service contracts. Purchase orders that are not binding agreements are excluded from the table above.
(3)For purposes of this table, interest has been estimated based on interest rates in effect for our indebtedness as of December 30, 2021 and estimated borrowing levels in the future. Actual borrowing levels and interest costs may differ.
For fiscal 2021, we were not party to any material off-balance sheet arrangements that are reasonably likely to have a current or future effect on our financial condition, net sales, expenses, results of operations, liquidity, capital expenditures, or capital resources. We do not have any relationship with unconsolidated entities or financial partnerships for the purpose of facilitating off-balance sheet arrangements or for other contractually narrow or limited purposes.
U.S. Tariffs and Global Economy
The current domestic and international political environment, including existing and potential changes to U.S. policies related to global trade and tariffs, have resulted in uncertainty surrounding the future state of the global economy. In particular, the ongoing trade dispute between the U.S. and China has resulted in the U.S. imposing tariffs of 25% on many products from China. While exclusions from tariffs were granted for certain products from China, nearly all of these exclusions have expired. In fiscal 2021, approximately 30% of the products we sold were produced in China. As we continue to manage the impact these tariffs may have on our business, we continue taking steps to mitigate some of these cost increases through negotiating lower costs from our vendors, increasing retail pricing as we deem appropriate, and sourcing from alternative countries. While our efforts have mitigated a substantial portion of the overall effect of increased tariffs, the enacted tariffs have increased our inventory costs and associated cost of sales for the remaining products still sourced from China.
Tariff Refunds
In November 2019, the U.S. Trade Representative (“USTR”) made a ruling to retroactively exclude certain flooring products imported from China from the Section 301 tariffs that were implemented at 10% beginning in September 2018 and increased to 25% in June 2019. The granted exclusions apply to certain “click” vinyl and engineered products that we have sold and continue to sell. As these exclusions were granted retroactively, we are entitled to a refund from U.S. Customs for the applicable Section 301 tariffs previously paid on these goods. Tariff refund claims are subject to the approval of U.S. Customs, and the Company currently expects to recover $22.0 million, including interest, related to these Section 301 tariff payments. Of the expected refunds, $14.6 million has been received as of December 30, 2021. Refer to Note 1, “Summary of Significant Accounting Policies” of the notes to the consolidated financial statements included in this Annual Report for additional details regarding tariff refunds.
Recently Adopted and Recently Issued Accounting Pronouncements
Refer to Note 1, “Summary of Significant Accounting Policies” of the notes to the consolidated financial statements included in this Annual Report for information on the recently adopted and recently issued accounting pronouncements that are applicable to the Company.
Critical Accounting Policies and Estimates
The preparation of financial statements in accordance with accounting principles generally accepted in the United States requires management to make estimates and assumptions about future events that affect amounts reported in our consolidated financial statements and related notes as well as the related disclosure of contingent assets and liabilities at the date of the financial statements. Management evaluates its accounting policies, estimates, and judgments on an ongoing basis. Management bases its estimates and judgments on historical experience and various other factors that are believed to be reasonable under the circumstances. Actual results may differ under different assumptions and conditions, and such differences could be material to the consolidated financial statements.
Management evaluated the development and selection of its critical accounting policies and estimates and believes that the following accounting policies are critical as they involve a higher degree of judgment or complexity and are the most significant to reporting our results of operations and financial position. The following critical accounting policies reflect the significant estimates and judgments used in the preparation of our consolidated financial statements. With respect to critical accounting policies, even a relatively minor variance between actual and expected experience can potentially have a materially favorable or unfavorable impact on subsequent results of operations. All of our significant accounting policies are discussed in “Note 1. Summary of Significant Accounting Policies” to our audited consolidated financial statements included in this Annual Report.
Revenue Recognition
Description. We recognize revenue and the related cost of sales when we satisfy the performance obligations in contracts with our customers in accordance with Accounting Standards Update (“ASU”) No. 2014-09, “Revenue from Contracts with Customers” (“Topic 606”). Our performance obligations for our retail store sales, as well as for orders placed through our website and shipped to our customers, are satisfied at the point-of-sale, which is typically the point at which the customer obtains control of the inventory. In some cases, merchandise is not physically ready for transfer to the customer at the point-of-sale, and revenue recognition is deferred until the customer has control of the inventory. Shipping and handling activities are accounted for as activities to fulfill the promise to transfer goods rather than as separate performance obligations as outlined within Topic 606. Payment is generally due from the customer immediately at the point-of-sale for both retail store sales and website sales.
Judgments and uncertainties involved in the estimate. Our customers have the right to return the goods sold to them within a reasonable time period, typically 90 days. The right of return is an element of variable consideration as defined within Topic 606. We estimate a reserve for future returns of previously sold goods based on historical experience and various other assumptions that we believe to be reasonable. Merchandise exchanges of similar product and price are not considered merchandise returns and, therefore, are excluded when calculating the sales returns reserve. While we believe that our current sales returns reserves are adequate, there can be no assurances that historical data and trends will accurately predict returns or that future developments might not lead to a significant change in the reserve.
Effect if actual results differ from assumptions. A 10% change in our sales returns reserves and related return asset accruals at December 30, 2021 would have had a net impact of approximately $1.6 million on operating income in fiscal 2021. Sales returns reserves and related return asset accruals have increased primarily in proportion to our sales growth over the last few years.
Gift Cards and Merchandise Credits
Description. We sell gift cards to our customers in our stores and through our website and issue merchandise credits in our stores. We account for the programs by recognizing a liability at the time the gift card is sold or the merchandise credit is issued. The liability is relieved and revenue is recognized upon redemption. Additionally, we recognize breakage income in proportion to the pattern of rights exercised by the customer when we expect to be entitled to breakage. Net sales related to the estimated breakage are included in net sales in the Consolidated Statement of Operations and Comprehensive Income. We have an agreement with an unrelated third-party who is the issuer of the Company's gift cards and also assumes the liability for unredeemed gift cards. The Company is not subject to claims under unclaimed property statutes, as the agreement effectively transfers the ownership of such unredeemed gift cards and the related future escheatment liability, if any, to the third-party.
Judgments and uncertainties involved in the estimate. Our gift card breakage assumptions require judgments in assessing the level at which we group gift cards for analysis of breakage rates, redemption patterns, and the ultimate value of gift cards which we do not expect to be redeemed.
Effect if actual results differ from assumptions. A 10% change in our accrual for estimated gift card breakage at December 30, 2021 would have affected operating income by approximately $1.2 million in fiscal 2021. Accruals for estimated gift card breakage have increased approximately in proportion to growth in gift card sales over the last few years.
Loyalty Program
Description. Our Pro Premier loyalty program allows customers to earn points through purchases in our stores and our website. Loyalty points are typically awarded at 1%, but may be awarded at up to 3% percent for our higher volume customers, of the relative standalone selling price of the merchandise sold and are recognized at the time of sale as a liability with a corresponding reduction to net sales. Additionally, loyalty breakage is recognized based on our estimate of the balance of loyalty points for which the likelihood of redemption by the customer is deemed remote.
Judgments and uncertainties involved in the estimate. With assistance from the third party servicer that manages the loyalty program, we estimate and recognize loyalty breakage based on historical redemption trends, market benchmarks for the pattern of redemptions for other retail loyalty programs, and other assumptions related to the likelihood of customer redemptions.
Effect if actual results differ from assumptions. The loyalty program was rolled out to all stores in late fiscal 2018. As the program matures, we may find that actual customer redemption patterns differ significantly from our estimated breakage rates. A 10% change in our accrual for estimated loyalty breakage at December 30, 2021 would have affected operating income by approximately $0.5 million in fiscal 2021. Accruals for estimated loyalty breakage have increased approximately in proportion to our sales growth over the last few years.
Inventory Valuation and Shrinkage
Description. Inventories consist of merchandise held for sale and are stated at the lower of cost or net realizable value. When evidence exists that the net realizable value of inventory is lower than its cost, the difference is recorded in cost of sales in the Consolidated Statements of Operations and Comprehensive Income as a loss in the period in which it occurs. We determine inventory costs using the moving weighted average cost method. We capitalize transportation, duties, and other costs to get product to our retail locations.
Judgments and uncertainties involved in the estimate. We provide provisions for losses related to shrinkage and other amounts that are otherwise not expected to be fully recoverable. These provisions are calculated based on historical shrinkage, selling price, margin, and current business trends. The estimates have calculations that require management to make assumptions based on the current rate of sales, age, salability and profitability of inventory, historical percentages that can be affected by changes in our merchandising mix, customer preferences, rates of sell through, and changes in actual shrinkage trends.
Effect if actual results differ from assumptions. A 10% change in our inventory valuation and shrinkage reserves at December 30, 2021 would have affected operating income by approximately $0.7 million in fiscal 2021. Inventory valuation and shrinkage reserves have increased approximately in proportion to our inventory growth over the last few years.
Vendor Rebates and Allowances
Description. Vendor allowances consist primarily of volume rebates that are earned as a result of reaching certain inventory purchase levels and advertising allowances or incentives for the promotion of vendors' products. These vendor allowances are accrued as earned and are estimated based on annual projections. Vendor allowances earned are initially recorded as a reduction to the carrying value of inventory and a subsequent reduction in cost of sales when the related product is sold. Certain incentive allowances that are reimbursements of specific, incremental, and identifiable costs incurred to promote vendors’ products are recorded as an offset against these promotional expenses.
Judgments and uncertainties involved in the estimate. For vendor allowances, we develop accrual rates based on the provisions of the agreements in place. Due to the complexity and diversity of the individual vendor agreements, we perform analyses and review historical purchase trends and volumes throughout the year, adjust accrual rates as appropriate, and confirm actual amounts with select vendors to ensure the amounts earned are appropriately recorded. Amounts accrued throughout the year could be impacted if actual purchase volumes differ from projected purchase volumes, especially in the case of programs that provide for increased funding when graduated purchase volumes are met.
Effect if actual results differ from assumptions. We have not made any material changes in the methodology used to recognize vendor allowances during the past three fiscal years. If actual results are not consistent with the assumptions and estimates used, we could be exposed to additional adjustments that could positively or negatively impact gross margin and inventory. However, substantially all receivables associated with vendor rebates and allowances do not require subjective long-term estimates because they are collected soon after quarter end, primarily within the first two months. Adjustments to gross margin and inventory in the following fiscal year have historically not been material.
Leases
Description. We recognize lease assets and corresponding lease liabilities for all operating leases on our Consolidated Balance Sheets, excluding short-term leases (leases with terms of 12 months or less) as described under ASU No. 2016-02, “Leases (Topic 842).” The majority of our long-term operating lease agreements include options to extend, which are also factored into the recognition of their respective assets and liabilities when appropriate based on management’s assessment of the probability that the options will be exercised. Lease payments are discounted using the rate implicit in the lease, or, if not readily determinable, a third-party secured incremental borrowing rate based on information available at lease commencement. The secured incremental borrowing rate is estimated based on yields obtained from Bloomberg for U.S. consumers with a BB- credit rating and is adjusted for collateralization as well as inflation. Additionally, certain of our lease agreements include escalating rents over the lease terms which, under Topic 842, results in rent being expensed on a straight-line basis over the life of the lease that commences on the date we have the right to control the property.
Judgments and uncertainties involved in the estimate. The determination of an appropriate secured incremental borrowing rate requires judgments in selecting an appropriate yield curve and estimating adjustments for collateralization and inflation.
Effect if actual results differ from assumptions. Based on the volume of new store leases that we enter into each year, a significant increase or decrease in the incremental borrowing rates used to discount lease payments could have a significant impact on the value of operating lease liabilities and right-of-use assets subsequently reported on our Consolidated Balance Sheets.
ITEM 7A. QUANTITATIVE AND QUALITATIVE DISCLOSURES ABOUT MARKET RISK.
Market risk represents the risk of changes in the value of market risk sensitive instruments caused by fluctuations in foreign exchange rates, interest rates and commodity prices. Changes in these factors could cause fluctuations in the results of our operations and cash flows. In the ordinary course of business, we are primarily exposed to foreign currency, interest rate risks, and risks from the impact of inflation or deflation. Uncertainty with respect to the economic effects of the COVID-19 pandemic has introduced significant volatility in the financial markets, including interest rates and foreign currency exchange rates. The COVID-19 pandemic is expected to have a continued adverse impact on market conditions and may trigger a period of global economic slowdown for an unknown duration. See further discussion in Item 7, “Management’s Discussion and Analysis of Financial Condition and Results of Operations” for additional details.
Foreign Currency Risk
We contract for production with third parties primarily in Asia and Europe. While substantially all of these contracts are stated in U.S. dollars, there can be no assurance that the cost for the future production of our products will not be affected by exchange rate fluctuations between the U.S. dollar and the local currencies of these contractors. Due to the number of currencies involved, we cannot quantify the potential impact of future currency fluctuations on net income or loss in future years. To date, such exchange fluctuations have not had a material impact on our financial condition or results of operations.
Interest Rate Risk
Our operating results are subject to risk from interest rate fluctuations on our Credit Facilities, which carry variable interest rates. As of December 30, 2021, our senior secured term loan facility, which has a variable interest rate, had a remaining principal balance of $206.6 million. A 1.0% increase in the effective interest rate for this debt would cause an increase in interest expense of approximately $2.1 million over the next twelve months. To lessen our exposure to changes in interest rate risk, we entered into two $75.0 million interest rate cap agreements in May 2021. The contracts capped our LIBOR at 1.75% beginning in May 2021. Our $102.5 million interest rate cap agreement entered into during November 2016 that capped our LIBOR at 2.0% expired on December 31, 2021, just after our fiscal 2021 year-end. We do not anticipate that our outstanding interest rate cap agreements will significantly impact interest expense in the immediate near term as interest rates are currently near historic lows; however, the U.S. Federal Reserve has recently signaled an intent to begin raising interest rates in fiscal 2022, in which case these agreements could partially offset increases in interest expense on our variable rate debt if rates were to increase to a level above the specified 1.75% LIBOR cap.
Impact of Inflation/Deflation
Substantial increases in costs, including the price of raw materials, labor, energy, transportation, and other inputs used in the production and distribution of our merchandise, could have a significant impact on our business and the industry. Additionally, while deflation could positively impact our merchandise costs, it could have an adverse effect on our average unit retail price, resulting in lower net sales and operating results.
Commodity Price Risk
We experience inflation and deflation related to our purchase of certain commodity products. There can be no assurance that this price volatility will not affect our financial condition and/or our results of operations. In order to mitigate price volatility, we monitor commodity price fluctuations and may adjust our selling prices accordingly; however, our ability to recover higher costs through increased pricing may be limited by the competitive environment in which we operate. To date, such fluctuations have not had a material impact on our financial condition or results of operations.
ITEM 8. FINANCIAL STATEMENTS AND SUPPLEMENTARY DATA.
Report of Independent Registered Public Accounting Firm
The Board of Directors and Stockholders of
Floor & Decor Holdings, Inc. and Subsidiaries
Opinion on the Financial Statements
We have audited the accompanying consolidated balance sheets of Floor & Decor Holdings, Inc. and Subsidiaries (the Company) as of December 30, 2021 and December 31, 2020, the related consolidated statements of operations and comprehensive income, stockholders’ equity and cash flows for each of the three years in the period ended December 30, 2021, and the related notes (collectively referred to as the “consolidated financial statements”). In our opinion, the consolidated financial statements present fairly, in all material respects, the financial position of the Company at December 30, 2021 and December 31, 2020, and the results of its operations and its cash flows for each of the three years in the period ended December 30, 2021, in conformity with U.S. generally accepted accounting principles.
We also have audited, in accordance with the standards of the Public Company Accounting Oversight Board (United States) (PCAOB), the Company’s internal control over financial reporting as of December 30, 2021, based on criteria established in Internal Control-Integrated Framework issued by the Committee of Sponsoring Organizations of the Treadway Commission (2013 framework), and our report dated February 24, 2022 expressed an unqualified opinion thereon.
Basis for Opinion
These financial statements are the responsibility of the Company’s management. Our responsibility is to express an opinion on the Company’s financial statements based on our audits. We are a public accounting firm registered with the PCAOB and are required to be independent with respect to the Company in accordance with the U.S. federal securities laws and the applicable rules and regulations of the Securities and Exchange Commission and the PCAOB.
We conducted our audits in accordance with the standards of the PCAOB. Those standards require that we plan and perform the audit to obtain reasonable assurance about whether the financial statements are free of material misstatement, whether due to error or fraud. Our audits included performing procedures to assess the risks of material misstatement of the financial statements, whether due to error or fraud, and performing procedures that respond to those risks. Such procedures included examining, on a test basis, evidence regarding the amounts and disclosures in the financial statements. Our audits also included evaluating the accounting principles used and significant estimates made by management, as well as evaluating the overall presentation of the financial statements. We believe that our audits provide a reasonable basis for our opinion.
Critical Audit Matter
The critical audit matter communicated below is a matter arising from the current period audit of the financial statements that was communicated or required to be communicated to the audit committee and that: (1) relates to accounts or disclosures that are material to the financial statements and (2) involved our especially challenging, subjective or complex judgments. The communication of the critical audit matter does not alter in any way our opinion on the consolidated financial statements, taken as a whole, and we are not, by communicating the critical audit matter below, providing a separate opinion on the critical audit matter or on the accounts or disclosures to which it relates.
| | | | | | | | |
| | Right of use assets and lease liabilities |
| | |
| Description of the Matter | | As discussed in Notes 1 and 9 to the consolidated financial statements, the Company recognizes right-of-use assets and corresponding lease liabilities for all leases on the balance sheet, excluding short-term leases (leases with terms of 12 months or less) as described under Accounting Standards Codification 842 (“ASC 842”). Because most of the Company’s leases do not provide a determinable implicit rate, the Company used a third party to assist in determining its incremental borrowing rates, which were used to calculate its right-of-use assets and lease liabilities. As of December 30, 2021, the Company’s right-of-use assets were $1,104 million and lease liabilities were $1,226 million (of which $105 million was current and $1,121 million was long-term).
Auditing the Company’s right-of-use assets and lease liabilities was challenging due to the requirement that management estimate its incremental borrowing rates used in the application of ASC 842 because the Company does not have debt financing or other instruments that have directly comparable collateral or similar terms as its leased assets. Therefore, our procedures involved a high degree of subjective auditor judgment because of the significant judgments required for management to develop the estimates, including selection of an appropriate yield curve and estimating adjustments for collateralization and inflation. |
| | |
| How we Addressed the Matter in Our Audit | | We obtained an understanding of and tested controls that address the risks of material misstatement relating to the valuation of the Company’s right-of-use assets and lease liabilities. For example, we tested controls over management’s review of the incremental borrowing rate estimates, including selection of an appropriate yield curve and adjustments for collateralization and inflation.
To test the right-of-use assets and lease liabilities recorded by the Company for new or modified leases entered into during the year ended December 30, 2021, our audit procedures included, among others, evaluating the methodology, significant assumptions and underlying data used by the Company. We involved our valuation specialists to assist in evaluating the Company’s methodology to develop the incremental borrowing rates and preparing an independent calculation of the rates, which we compared to management’s estimates. |
/s/ Ernst & Young LLP
We have served as the Company's auditor since 2011.
Atlanta, Georgia
February 24, 2022
Report of Independent Registered Public Accounting Firm
The Board of Directors and Stockholders of
Floor & Decor Holdings, Inc. and Subsidiaries
Opinion on Internal Control Over Financial Reporting
We have audited Floor & Decor Holdings, Inc. and Subsidiaries’ internal control over financial reporting as of December 30, 2021, based on criteria established in Internal Control—Integrated Framework issued by the Committee of Sponsoring Organizations of the Treadway Commission (2013 framework) (the COSO criteria). In our opinion, Floor & Decor Holdings, Inc. and Subsidiaries (the Company) maintained, in all material respects, effective internal control over financial reporting as of December 30, 2021, based on the COSO criteria.
As indicated in the accompanying Management’s Report on Internal Control over Financial Reporting, management’s assessment of and conclusion on the effectiveness of internal control over financial reporting did not include the internal controls of Spartan Surfaces, Inc. (“Spartan”), which is included in the 2021 consolidated financial statements of the Company and constituted less than 3% of total assets as of December 30, 2021 and less than 2% of net sales for the year then ended. Our audit of internal control over financial reporting of the Company also did not include an evaluation of the internal control over financial reporting of Spartan.
We also have audited, in accordance with the standards of the Public Company Accounting Oversight Board (United States) (PCAOB), the consolidated balance sheets of the Company as of December 30, 2021 and December 31, 2020, the related consolidated statements of operations and comprehensive income, stockholders’ equity and cash flows for each of the three years in the period ended December 30, 2021, and the related notes and our report dated February 24, 2022 expressed an unqualified opinion thereon.
Basis for Opinion
The Company’s management is responsible for maintaining effective internal control over financial reporting and for its assessment of the effectiveness of internal control over financial reporting included in the accompanying Management’s Report on Internal Control over Financial Reporting. Our responsibility is to express an opinion on the Company’s internal control over financial reporting based on our audit. We are a public accounting firm registered with the PCAOB and are required to be independent with respect to the Company in accordance with the U.S. federal securities laws and the applicable rules and regulations of the Securities and Exchange Commission and the PCAOB.
We conducted our audit in accordance with the standards of the PCAOB. Those standards require that we plan and perform the audit to obtain reasonable assurance about whether effective internal control over financial reporting was maintained in all material respects.
Our audit included obtaining an understanding of internal control over financial reporting, assessing the risk that a material weakness exists, testing and evaluating the design and operating effectiveness of internal control based on the assessed risk, and performing such other procedures as we considered necessary in the circumstances. We believe that our audit provides a reasonable basis for our opinion.
Definition and Limitations of Internal Control Over Financial Reporting
A company’s internal control over financial reporting is a process designed to provide reasonable assurance regarding the reliability of financial reporting and the preparation of financial statements for external purposes in accordance with generally accepted accounting principles. A company’s internal control over financial reporting includes those policies and procedures that (1) pertain to the maintenance of records that, in reasonable detail, accurately and fairly reflect the transactions and dispositions of the assets of the company; (2) provide reasonable assurance that transactions are recorded as necessary to permit preparation of financial statements in accordance with generally accepted accounting principles, and that receipts and expenditures of the company are being made only in accordance with authorizations of management and directors of the company; and (3) provide reasonable assurance regarding prevention or timely detection of unauthorized acquisition, use, or disposition of the company’s assets that could have a material effect on the financial statements.
Because of its inherent limitations, internal control over financial reporting may not prevent or detect misstatements. Also, projections of any evaluation of effectiveness to future periods are subject to the risk that controls may become inadequate because of changes in conditions, or that the degree of compliance with the policies or procedures may deteriorate.
/s/ Ernst & Young LLP
Atlanta, Georgia
February 24, 2022
Floor & Decor Holdings, Inc. and Subsidiaries
Consolidated Balance Sheets
| | | | | | | | | | | |
in thousands, except for share and per share data | As of December 30,
2021 | | As of December 31,
2020 |
| Assets | | | |
| Current assets: | | | |
| Cash and cash equivalents | $ | 139,444 | | | $ | 307,772 | |
| Income taxes receivable | 3,507 | | | — | |
| Receivables, net | 81,463 | | | 50,427 | |
| Inventories, net | 1,008,151 | | | 654,000 | |
| Prepaid expenses and other current assets | 40,780 | | | 28,257 | |
| Total current assets | 1,273,345 | | | 1,040,456 | |
| Fixed assets, net | 929,083 | | | 579,359 | |
| Right-of-use assets | 1,103,750 | | | 916,325 | |
| Intangible assets, net | 151,935 | | | 109,269 | |
| Goodwill | 255,473 | | | 227,447 | |
| Deferred income tax assets, net | 9,832 | | | — | |
| Other assets | 7,277 | | | 7,569 | |
| Total long-term assets | 2,457,350 | | | 1,839,969 | |
| Total assets | $ | 3,730,695 | | | $ | 2,880,425 | |
| Liabilities and stockholders’ equity | | | |
| Current liabilities: | | | |
| Current portion of term loans | $ | 2,103 | | | $ | 1,647 | |
| Current portion of lease liabilities | 104,602 | | | 94,502 | |
| Trade accounts payable | 661,883 | | | 417,898 | |
| Accrued expenses and other current liabilities | 248,935 | | | 162,283 | |
| Income taxes payable | — | | | 12,391 | |
| Deferred revenue | 14,492 | | | 10,115 | |
| Total current liabilities | 1,032,015 | | | 698,836 | |
| Term loans | 195,762 | | | 207,157 | |
| Lease liabilities | 1,120,990 | | | 941,125 | |
| Deferred income tax liabilities, net | 40,958 | | | 27,990 | |
| Other liabilities | 17,771 | | | 7,929 | |
| Total long-term liabilities | 1,375,481 | | | 1,184,201 | |
| Total liabilities | 2,407,496 | | | 1,883,037 | |
| Commitments and Contingencies (Note 9) |
| |
|
| Stockholders’ equity | | | |
| Capital stock: | | | |
Preferred stock, $0.001 par value; 10,000,000 shares authorized; 0 shares issued and outstanding at December 30,2021 and December 31, 2020 | — | | | — | |
Common stock Class A, $0.001 par value; 450,000,000 shares authorized; 105,760,650 shares issued and outstanding at December 30, 2021 and 104,368,212 issued and outstanding at December 31, 2020 | 106 | | | 104 | |
Common stock Class B, $0.001 par value; 10,000,000 shares authorized; 0 shares issued and outstanding at December 30, 2021 and December 31, 2020 | — | | | — | |
Common stock Class C, $0.001 par value; 30,000,000 shares authorized; 0 shares issued and outstanding at December 30, 2021 and December 31, 2020 | — | | | — | |
| Additional paid-in capital | 450,332 | | | 408,124 | |
| Accumulated other comprehensive income, net | 535 | | | 164 | |
| Retained earnings | 872,226 | | | 588,996 | |
| Total stockholders’ equity | 1,323,199 | | | 997,388 | |
| Total liabilities and stockholders’ equity | $ | 3,730,695 | | | $ | 2,880,425 | |
See accompanying notes to consolidated financial statements.
Floor & Decor Holdings, Inc. and Subsidiaries
Consolidated Statements of Operations and Comprehensive Income
| | | | | | | | | | | | | | | | | |
in thousands, except for per share data | Fiscal Year Ended December 30,
2021 | | Fiscal Year Ended December 31,
2020 | | Fiscal Year Ended December 26,
2019 |
Net sales | $ | 3,433,533 | | | $ | 2,425,788 | | | $ | 2,045,456 | |
Cost of sales | 2,011,267 | | | 1,390,896 | | | 1,182,442 | |
Gross profit | 1,422,266 | | | 1,034,892 | | | 863,014 | |
Operating expenses: | | | | | |
Selling and store operating | 849,440 | | | 654,100 | | | 546,853 | |
General and administrative | 199,401 | | | 144,715 | | | 132,386 | |
Pre-opening | 34,433 | | | 21,498 | | | 24,594 | |
Total operating expenses | 1,083,274 | | | 820,313 | | | 703,833 | |
Operating income | 338,992 | | | 214,579 | | | 159,181 | |
Interest expense, net | 4,924 | | | 8,389 | | | 8,801 | |
| Gain on early extinguishment of debt | — | | | (1,015) | | | — | |
Income before income taxes | 334,068 | | | 207,205 | | | 150,380 | |
| Provision (benefit) for income taxes | 50,838 | | | 12,224 | | | (251) | |
Net income | $ | 283,230 | | | $ | 194,981 | | | $ | 150,631 | |
Change in fair value of hedge instruments, net of tax | 371 | | | 357 | | | (379) | |
Total comprehensive income | $ | 283,601 | | | $ | 195,338 | | | $ | 150,252 | |
Basic earnings per share | $ | 2.71 | | | $ | 1.90 | | | $ | 1.51 | |
Diluted earnings per share | $ | 2.64 | | | $ | 1.84 | | | $ | 1.44 | |
See accompanying notes to consolidated financial statements.
Floor & Decor Holdings, Inc. and Subsidiaries
Consolidated Statements of Stockholders’ Equity
| | | | | | | | | | | | | | | | | | | | | | | | | | | | | | | | | | | |
| Common Stock
Class A | | Additional
Paid-in
Capital | | Accumulated
Other
Comprehensive
Income (Loss) | | Retained
Earnings | | Total
Stockholders’
Equity |
| in thousands | Shares | | Amount | | | | |
| Balance, December 28, 2018 | 97,588 | | | $ | 98 | | | $ | 340,462 | | | $ | 186 | | | $ | 243,563 | | | $ | 584,309 | |
| Stock-based compensation expense | — | | | — | | | 8,711 | | | — | | | — | | | 8,711 | |
| Exercise of stock options | 3,741 | | | 3 | | | 18,795 | | | — | | | — | | | 18,798 | |
| Issuance of restricted stock awards | 24 | | | — | | | — | | | — | | | — | | | — | |
| Shares issued under employee stock purchase plan | 105 | | | — | | | 2,445 | | | — | | | — | | | 2,445 | |
| Cumulative effect from adoption of ASU No. 2016-02 | — | | | — | | | — | | | — | | | (179) | | | (179) | |
| Other comprehensive loss, net of tax | — | | | — | | | — | | | (379) | | | — | | | (379) | |
| Net income | — | | | — | | | — | | | — | | | 150,631 | | | 150,631 | |
| Balance, December 26, 2019 | 101,458 | | | 101 | | | 370,413 | | | (193) | | | 394,015 | | | 764,336 | |
| Stock-based compensation expense | — | | | — | | | 16,115 | | | — | | | — | | | 16,115 | |
| Exercise of stock options | 2,485 | | | 2 | | | 19,252 | | | — | | | — | | | 19,254 | |
| Issuance of restricted stock awards | 369 | | | 1 | | | — | | | — | | | — | | | 1 | |
| Shares issued under employee stock purchase plan | 56 | | | — | | | 2,344 | | | — | | | — | | | 2,344 | |
| Other comprehensive gain, net of tax | — | | | — | | | — | | | 357 | | | — | | | 357 | |
| Net income | — | | | — | | | — | | | — | | | 194,981 | | | 194,981 | |
| Balance, December 31, 2020 | 104,368 | | | 104 | | | 408,124 | | | 164 | | | 588,996 | | | 997,388 | |
| Stock-based compensation expense | — | | | — | | | 20,528 | | | — | | | — | | | 20,528 | |
| Exercise of stock options | 1,253 | | | 2 | | | 14,734 | | | — | | | — | | | 14,736 | |
| Issuance of restricted stock awards | 29 | | | — | | | — | | | — | | | — | | | — | |
| Forfeiture of restricted stock awards | (3) | | | — | | | — | | | — | | | — | | | — | |
| Issuance of common stock upon vesting of restricted stock units | 29 | | | — | | | — | | | — | | | — | | | — | |
| Shares issued under employee stock purchase plan | 46 | | | — | | | 3,063 | | | — | | | — | | | 3,063 | |
| Issuance of stock related to acquisition | 50 | | | — | | | 5,000 | | | — | | | — | | | 5,000 | |
| Common stock redeemed for tax liability | (11) | | | — | | | (1,117) | | | — | | | — | | | (1,117) | |
| Other comprehensive gain, net of tax | — | | | — | | | — | | | 371 | | | — | | | 371 | |
| Net income | — | | | — | | | — | | | — | | | 283,230 | | | 283,230 | |
| Balance, December 30, 2021 | 105,761 | | | $ | 106 | | | $ | 450,332 | | | $ | 535 | | | $ | 872,226 | | | $ | 1,323,199 | |
See accompanying notes to consolidated financial statements.
Floor & Decor Holdings, Inc. and Subsidiaries
Consolidated Statements of Cash Flows
| | | | | | | | | | | | | | | | | |
| in thousands | Fiscal Year Ended December 30,
2021 | | Fiscal Year Ended December 31,
2020 | | Fiscal Year Ended December 26,
2019 |
| Operating activities | | | | | |
| Net income | $ | 283,230 | | | $ | 194,981 | | | $ | 150,631 | |
| Adjustments to reconcile net income to net cash provided by operating activities: | | | | | |
| Depreciation and amortization | 118,196 | | | 91,640 | | | 74,001 | |
| Stock-based compensation expense | 20,528 | | | 16,115 | | | 8,711 | |
| Deferred income taxes | 3,042 | | | 9,614 | | | (10,584) | |
| Interest cap derivative contracts | 357 | | | 372 | | | 446 | |
| Loss on asset impairments and disposals, net | 438 | | | 14 | | | 4,111 | |
| Gain on early extinguishment of debt | — | | | (1,015) | | | — | |
| Operating lease termination | — | | | — | | | 1,926 | |
| Changes in operating assets and liabilities, net of effects of acquisition: | | | | | |
| Receivables, net | (19,768) | | | 18,874 | | | (17,850) | |
| Inventories, net | (349,678) | | | (72,135) | | | (110,851) | |
| Trade accounts payable | 232,761 | | | 49,439 | | | 54,956 | |
| Accrued expenses and other current liabilities | 36,684 | | | 59,017 | | | 20,744 | |
| Income taxes | (15,897) | | | 15,264 | | | 3,894 | |
| Deferred revenue | 3,158 | | | 3,432 | | | 1,439 | |
| Other, net | (11,709) | | | 20,552 | | | 23,084 | |
| Net cash provided by operating activities | 301,342 | | | 406,164 | | | 204,658 | |
| Investing activities | | | | | |
| Purchases of fixed assets | (407,671) | | | (212,448) | | | (196,008) | |
| Acquisition, net of cash acquired | (63,567) | | | — | | | — | |
| Net cash used in investing activities | (471,238) | | | (212,448) | | | (196,008) | |
| Financing activities | | | | | |
| Proceeds from term loans | 65,000 | | | 75,000 | | | — | |
| Payments on term loans | (76,202) | | | (2,697) | | | (3,500) | |
| Borrowings on revolving line of credit | 13,466 | | | 275,000 | | | 100,100 | |
| Payments on revolving line of credit | (15,969) | | | (275,000) | | | (100,100) | |
| Proceeds from exercise of stock options | 14,736 | | | 19,254 | | | 18,798 | |
| Proceeds from employee stock purchase plan | 3,063 | | | 2,344 | | | 2,445 | |
| Debt issuance costs | (1,409) | | | (6,882) | | | — | |
| Tax payments for stock-based compensation awards | (1,117) | | | — | | | — | |
| Net cash provided by financing activities | 1,568 | | | 87,019 | | | 17,743 | |
| Net (decrease) increase in cash and cash equivalents | (168,328) | | | 280,735 | | | 26,393 | |
| Cash and cash equivalents, beginning of the period | 307,772 | | | 27,037 | | | 644 | |
| Cash and cash equivalents, end of the period | $ | 139,444 | | | $ | 307,772 | | | $ | 27,037 | |
| Supplemental disclosures of cash flow information | | | | | |
| Buildings and equipment acquired under operating leases | $ | 285,865 | | | $ | 177,932 | | | $ | 277,392 | |
| Cash paid for interest, net of capitalized interest | $ | 6,279 | | | $ | 8,043 | | | $ | 7,388 | |
| Cash paid for income taxes, net of refunds | $ | 63,684 | | | $ | 12,670 | | | $ | 6,453 | |
| Fixed assets accrued at the end of the period | $ | 87,645 | | | $ | 19,987 | | | $ | 19,527 | |
See accompanying notes to consolidated financial statements.
Floor & Decor Holdings, Inc. and Subsidiaries
Notes to Consolidated Financial Statements
December 30, 2021
1. Summary of Significant Accounting Policies
Nature of Business
Floor & Decor Holdings, Inc., together with its subsidiaries (the “Company,” “we,” “our,” or “us”) is a multi-channel specialty retailer and commercial flooring distributor. The Company offers a broad assortment of in-stock hard-surface flooring, including tile, wood, laminate, vinyl, and natural stone along with decorative accessories and wall tile, installation materials, and adjacent categories at everyday low prices. Our stores appeal to a variety of customers, including professional installers and commercial businesses (“Pro”), Do it Yourself customers (“DIY”), and customers who buy our products for professional installation (“Buy it Yourself” or “BIY”). We operate within one reportable segment.
On June 4, 2021, the Company acquired Spartan Surfaces, Inc. (“Spartan”), a commercial specialty hard-surface flooring distribution company for total estimated purchase consideration of $77.7 million. Refer to Note 14, “Acquisition” for additional information.
As of December 30, 2021, the Company, through its wholly owned subsidiary, Floor and Decor Outlets of America, Inc. (“F&D” or “Outlets”), operates 160 warehouse-format stores, which average 78,000 square feet, and two small-format standalone design studios in 33 states as well as four distribution centers and an e-commerce site, FloorandDecor.com.
Fiscal Year
The Company’s fiscal year is the 52- or 53-week period ending on the Thursday on or preceding December 31st. The fiscal year ended December 31, 2020 (fiscal “2020”) includes 53 weeks, while the fiscal years ended December 30, 2021 (“fiscal 2021”) and December 26, 2019 (“fiscal 2019”) include 52 weeks. When a 53-week fiscal year occurs, we report the additional week at the end of the fiscal fourth quarter. 52-week fiscal years consist of thirteen-week periods in the first, second, third, and fourth quarters of the fiscal year. The 53-week fiscal year consists of thirteen-week periods in the first, second, and third quarters of the fiscal year and a fourteen-week period in the fourth quarter of the fiscal year.
Basis of Presentation
The accompanying consolidated financial statements have been prepared in accordance with accounting principles generally accepted in the United States (“GAAP”). The consolidated financial statements include the accounts of the Company and its wholly owned subsidiaries.
Impact of the COVID-19 Pandemic
On March 11, 2020, the World Health Organization announced that infections of the coronavirus (“COVID-19”) had become a pandemic, and on March 13, 2020, the President of the United States announced a National Emergency relating to the COVID-19 pandemic. The full impact that the COVID-19 pandemic could continue to have on the Company’s business remains an evolving situation and is highly uncertain. While the Company’s operations during fiscal 2021 did not appear to be negatively impacted, the COVID-19 pandemic had a material negative impact on the Company’s operations and financial results during the first half of fiscal 2020 and could have additional negative impacts in the future. The extent of the impact of the pandemic on the Company’s business and financial results will depend on future developments, including the duration of the pandemic, the success of vaccination programs, the spread of COVID-19, including its developing variants, within the markets in which the Company operates, as well as the countries from which the Company sources inventory, fixed assets, and other supplies, the effect of the pandemic on consumer confidence and spending, and actions taken by government entities in response to the pandemic, all of which are highly uncertain.
Business Combinations
The Company accounts for acquisitions in accordance with Financial Accounting Standards Board (“FASB”) Accounting Standards Codification (“ASC”) 805, Business Combinations. The purchase price of an acquisition is measured as the aggregate fair value of the consideration transferred at the date of acquisition. The purchase price is allocated to the fair values of the tangible and intangible assets acquired and liabilities assumed, with any excess recorded as goodwill. These fair value determinations require judgment and may involve the use of significant estimates and assumptions. The purchase price allocation may be provisional during a measurement period of up to one year from the acquisition date to provide reasonable time to obtain the information necessary to identify and measure the assets acquired and liabilities assumed. Only facts and circumstances that existed as of the acquisition date are considered for subsequent adjustment to the purchase price allocation, and any such adjustment will be recognized in the period in which it is determined prior to completion of the measurement period. Transaction costs associated with acquisitions are expensed as incurred.
Cash and Cash Equivalents
Cash consists of currency and demand deposits with banks.
Receivables
Receivables consist primarily of amounts due from credit card companies, receivables from vendors, and amounts due from commercial sales. The Company typically collects its credit card receivables within three to five business days of the underlying sale to the customer. The Company has agreements with a majority of its large merchandise vendors that allow for specified rebates based on purchasing volume. Generally, these agreements are on an annual basis, and beginning in fiscal 2020, the Company collects the majority rebates earned each quarter subsequent to quarter end. In prior years, rebates earned during the fiscal year were primarily collected annually after the Company's fiscal year-end. Additionally, the Company has agreements with substantially all vendors that allow for the return of certain merchandise throughout the normal course of business. When inventory is identified to return to a vendor, it is removed from inventory and recorded as a receivable on the Consolidated Balance Sheet, and any variance between capitalized inventory cost associated with the return and the expected vendor reimbursement is expensed in Cost of sales in the Consolidated Statements of Operations and Comprehensive Income when the inventory is identified to be returned to the vendor. The Company reserves for estimated uncollected receivables based on historical trends, which historically have been immaterial. The allowance for doubtful accounts was $0.3 million as of both December 30, 2021 and December 31, 2020.
On November 7, 2019, the U.S. Trade Representative made a ruling to grant exclusions from Section 301 tariffs for select types of flooring products imported from China, including certain “click” vinyl and engineered products that the Company has sold and continues to sell. The Section 301 tariffs from which these goods are now excluded were implemented at 10% beginning in September 2018 and increased to 25% in June 2019. In addition, on November 20, 2019, U.S. Customs and Border Protection (“U.S. Customs”) issued Chapter 99 exclusions for each unique article number identified under the November 7, 2019 USTR ruling. During fiscal 2020, additional Chapter 99 exclusions were issued for certain bamboo and other flooring products imported from China. For the Company, some of the granted exclusions apply retroactively to tariffs paid as early as September 2018.
While tariff refund claims are subject to the approval of U.S. Customs, the Company currently expects to recover a total of $22.0 million related to Section 301 tariff payments, of which $14.6 million has been received as of December 30, 2021. As of December 30, 2021 and December 31, 2020, receivables included $7.4 million and $11.4 million of expected tariff refunds from U.S. Customs. The tariff refund receivables outstanding as of December 30, 2021 are expected to be received during fiscal 2022.
The Company recognized a $2.6 million increase to cost of sales related to a reduction in estimated tariff refunds in fiscal 2021. During fiscal 2020 and 2019, the Company recognized a reduction to cost of sales of $4.5 million and $14.0 million, respectively.
Interest income recognized related to tariff refunds during fiscal 2021, 2020, and 2019 was $0.3 million, $0.6 million, $0.3 million, respectively. Interest accrues from the date that tariff payments were originally made through the date that such payments are refunded to the Company.
Credit Program
Credit is offered to the Company's customers through a proprietary credit card underwritten by third-party financial institutions at no recourse to the Company. The Company also offers limited credit to its commercial clients. The Company’s total credit exposure for receivables not insured by a third party at the end of fiscal 2021 and fiscal 2020 was $6.0 million and $1.2 million, respectively.
Inventory Valuation and Shrinkage
Inventories consist of merchandise held for sale and are stated at the lower of cost or net realizable value. When evidence exists that the net realizable value of inventory is lower than its cost, the difference is recorded in cost of sales in the Consolidated Statements of Operations and Comprehensive Income as a loss in the period in which it occurs. The Company determines inventory costs using the moving weighted average cost method. The Company capitalizes transportation, duties, and other costs to get product to its retail locations. The Company records reserves for estimated losses related to shrinkage and other amounts that are otherwise not expected to be fully recoverable. These reserves are calculated based on historical shrinkage, selling price, margin, and current business trends. The estimates have calculations that require management to make assumptions based on the current rate of sales, age, salability, and profitability of inventory, historical percentages that can be affected by changes in the Company's merchandising mix, customer preferences, and changes in actual shrinkage trends. These reserves totaled $7.8 million and $5.4 million as of December 30, 2021 and December 31, 2020, respectively.
Physical inventory counts and cycle counts are performed on a regular basis in each store and distribution center to ensure that amounts reflected in the accompanying Consolidated Balance Sheets are properly stated. During the period between physical inventory counts in its stores, the Company accrues for estimated losses related to shrinkage on a store-by-store basis. Shrinkage is the difference between the recorded amount of inventory and the physical inventory. Shrinkage may occur due to theft or loss, among other things.
Fixed Assets
Fixed assets consist primarily of furniture, fixtures, and equipment, leasehold improvements (including those that are reimbursed by landlords as tenant improvement allowances), buildings and building improvements, computer software and hardware, and land. Fixed assets are stated at cost less accumulated depreciation utilizing the straight-line method over the assets’ estimated useful lives. The Company capitalizes interest on borrowings during the active construction period of certain capital projects.
Leasehold improvements are amortized using the straight-line method over the shorter of (i) the original term of the lease, (ii) renewal term of the lease if the renewal is reasonably certain or (iii) the useful life of the improvement. The Company’s fixed assets are depreciated using the following estimated useful lives:
| | | | | |
| Useful Life |
| Furniture, fixtures and equipment | 2 - 7 years |
| Leasehold improvements | 10 - 25 years |
| Buildings and building improvements | 10 - 40 years |
| Computer software and hardware | 3 - 7 years |
| Land | Indefinite |
The cost and related accumulated depreciation of assets sold or otherwise disposed are removed from the accounts, and the related gain or loss is reported in the Consolidated Statements of Operations and Comprehensive Income.
Capitalized Software Costs
The Company capitalizes certain costs related to the acquisition and development of software and amortizes these costs using the straight-line method over the estimated useful life of the software. Certain development costs not meeting the criteria for capitalization are expensed as incurred.
Finite-lived Intangible Assets
In accordance with ASC 350, Intangibles—Goodwill and Other, identifiable intangible assets with finite lives are amortized over their estimated useful lives. The estimated lives of the Company’s finite-lived intangible assets are as follows:
| | | | | |
| Useful Life |
| Customer relationships | 12 years |
| Non-compete agreement | 5 years |
Goodwill and Other Indefinite-lived Intangible Assets
Goodwill represents the excess of purchase price over the fair value of net assets acquired. The Company does not amortize goodwill and other intangible assets with indefinite lives resulting from business combinations but, in accordance with ASC 350, Intangibles—Goodwill and Other, does assess the recoverability of goodwill annually in the fourth quarter of each fiscal year, or more often if events occur or changes in circumstances indicate that the carrying amount of goodwill may not be recoverable. Such circumstances could include, but are not limited to, a significant adverse change in customer demand or business climate or an adverse action or assessment by a regulator. Each year, the Company may assess qualitative factors to determine whether it is more likely than not that the fair value of the single reporting unit is less than its carrying amount as a basis for determining whether it is necessary to complete quantitative impairment assessments.
Impairment Assessment of Goodwill and Other Indefinite-lived Intangible Assets
The Company tests goodwill and its trade names, which are indefinite-lived intangible assets, for impairment annually in the fourth quarter of each fiscal year, or more often if events occur or changes in circumstances indicate that the carrying amount of goodwill or indefinite-lived intangible assets may not be recoverable. The Company has the option to assess the value of its goodwill and other indefinite-lived intangible assets under either a qualitative or quantitative approach. Under a qualitative approach, the Company evaluates various market and other factors to determine whether it is more likely than not that the Company’s goodwill or other indefinite-lived intangible assets have been impaired. In performing the qualitative assessment, the Company considers the carrying value of its single reporting unit compared to its fair value as well as events and changes in circumstances that could include, but are not limited to, a significant adverse change in customer demand or business climate, an adverse action or assessment by a regulator, and significant adverse changes in the price of the Company’s common stock. If such qualitative assessment indicates that impairment may have occurred, an additional quantitative assessment is performed by comparing the carrying value of the assets to their respective estimated fair values. If the recorded carrying value of goodwill or an other indefinite-lived intangible asset exceeds its estimated fair value, an impairment charge is recorded to write the asset down to its estimated fair value.
During the fourth quarter of fiscal 2021, the Company qualitatively assessed whether it was more likely than not that the goodwill and indefinite-lived intangible assets were impaired. Based on this assessment, the Company determined that its goodwill and other indefinite-lived intangible assets were not impaired as of October 29, 2021. No events or changes in circumstances have occurred since the date of the Company's most recent annual impairment assessment that would more likely than not reduce the fair value of the reporting unit below its carrying amount.
The Company’s goodwill and other indefinite-lived intangible assets impairment assessments contain uncertainties because they require management to make significant judgments in estimating the fair value of the Company’s reporting unit and other indefinite-lived intangible assets and, if a quantitative assessment is deemed necessary, may include the projection of future cash flows, assumptions about which market participants are the most comparable, the selection of discount rates, and the weighting of the income and market approaches. These calculations contain uncertainties because they require management to make assumptions such as estimating economic factors, including the profitability of future business operations and, if necessary, the fair value of the reporting unit’s assets and liabilities. Further, the Company’s ability to realize the future cash flows used in its fair value calculations is affected by factors such as changes in economic conditions, changes in the Company’s operating performance, and changes in the Company’s business strategies. Significant changes in any of the assumptions involved in calculating these estimates could affect the estimated fair value of the Company’s reporting unit and indefinite-lived intangible assets and could result in impairment charges in a future period.
Long-lived Assets
Long-lived assets, such as fixed assets, operating lease right-of-use assets, and intangible assets with finite lives, are reviewed for impairment whenever events or changes in circumstances indicate that the carrying amount of an asset may not be recoverable. Conditions that may indicate impairment include, but are not limited to, a significant adverse change in customer demand or business climate that could affect the value of an asset, significant changes or planned changes in the Company’s use of an asset, a product recall, or an adverse action by a regulator. In accordance with ASC 360, the evaluation is performed at the lowest level for which identifiable cash flows are available that are largely independent of the cash flows of other assets or asset groups. If the sum of the estimated undiscounted future cash flows is less than the carrying value of the related asset or asset group, an impairment loss is recognized equal to the difference between carrying value and fair value.
Since there is typically no active market for the Company’s definite-lived intangible assets, the Company estimates fair value based on expected future cash flows at the time they are identified. When events or changes in circumstances indicate that the carrying amount of an asset may not be recoverable, the Company estimates future cash flows based on store-level historical results, current trends, and operating and cash flow projections. Definite-lived intangible assets are amortized over their respective estimated useful lives on a straight-line basis, which the Company believes to be the amortization methodology that best matches the pattern of economic benefit that is expected from the assets. The useful lives of definite-lived intangible asset are evaluated on an annual basis.
Leases
The Company recognizes lease right-of-use assets and corresponding lease liabilities for all operating leases on the balance sheet, excluding short-term leases (leases with terms of 12 months or less) as described under ASU No. 2016-2, “Leases (Topic 842).” The majority of the Company’s long-term operating lease agreements include options to extend, which are also factored into the recognition of their respective assets and liabilities when appropriate based on management’s assessment of the probability that the options will be exercised. Lease payments are discounted using the rate implicit in the lease, or, if not readily determinable, a third-party secured incremental borrowing rate based on information available at lease commencement. The secured incremental borrowing rate is estimated based on yields obtained from Bloomberg for U.S. consumers with a BB- credit rating and is adjusted for collateralization as well as inflation. Additionally, certain of the Company’s lease agreements include escalating rents over the lease terms which, under Topic 842, results in rent being expensed on a straight-line basis over the life of the lease that commences on the date the Company has the right to control the property.
Self-Insurance Reserves
The Company is partially self-insured for workers’ compensation and general liability claims less than certain dollar amounts and maintains insurance coverage with individual and aggregate limits. The Company’s liabilities represent estimates of the ultimate cost for claims incurred, including loss adjusting expenses, as of the balance sheet date. The estimated liabilities are not discounted and are established based upon analysis of historical data, actuarial estimates, regulatory requirements, an estimate of claims incurred but not yet reported, and other relevant factors. Management utilizes independent third-party actuarial studies to help assess the liability on a regular basis.
Commitments and Contingencies
Liabilities for loss contingencies arising from claims, assessments, litigation, fines, penalties, and other sources are recorded when it is probable that a liability has been incurred and the amount of the loss can be reasonably estimated.
Asset Retirement Obligations
An asset retirement obligation (“ARO”) represents a legal obligation associated with the retirement of a tangible long-lived asset that is incurred upon the acquisition, construction, development or normal operation of that long-lived asset. The Company’s AROs are primarily associated with leasehold improvements that, at the end of a lease, the Company is contractually obligated to remove in order to comply with certain lease agreements. The ARO is recorded in Other liabilities on the Consolidated Balance Sheets and will be subsequently adjusted for changes in fair value. The associated estimated asset retirement costs are capitalized as part of the carrying amount of the long-lived asset and depreciated over its useful life.
Changes in (i) inflation rates and (ii) the estimated costs, timing and extent of future store closure activities each result in (a) a current adjustment to the recorded liability and related asset and (b) a change in the liability and asset amounts to be recorded prospectively. Any changes related to the assets are then recognized in accordance with the Company’s depreciation policy, which would generally result in depreciation expense being recognized prospectively over the shorter of the remaining lease term or estimated useful life.
Fair Value Measurements
The Company estimates fair values in accordance with ASC 820, Fair Value Measurement. ASC 820 provides a framework for measuring fair value and requires disclosures about fair value measurements. ASC 820 defines fair value as the price that would be received from the sale of an asset or paid to transfer a liability in the principal or most advantageous market for the asset or liability in an orderly transaction between market participants. Additionally, ASC 820 defines levels within a hierarchy based upon observable and non-observable inputs. If the inputs used to measure fair value fall within different levels of the hierarchy, the category level is based on the lowest priority level input that is significant to the overall fair value measurement of the instrument.
•Level 1: Quoted prices in active markets for identical assets or liabilities as of the reporting date;
•Level 2: Inputs other than quoted prices in active markets for identical assets or liabilities that are either directly or indirectly observable as of the reporting date; and
•Level 3: Unobservable inputs that reflect the reporting entity’s own estimates about the assumptions market participants would use in pricing the asset or liability.
Derivative Financial Instruments
The Company uses derivative financial instruments to maintain a portion of its long-term debt obligations at a targeted balance of fixed and variable interest rate debt to manage its risk associated with fluctuations in interest rates. Derivative contracts are recognized at fair value on the Consolidated Balance Sheets. The fair value is calculated utilizing Level 2 inputs. Unrealized changes in the fair value of hedged derivative instruments are recorded in accumulated other comprehensive income within the stockholders’ equity section of the Consolidated Balance Sheets.
The effective portion of the gain or loss on the derivatives is reported as a component of comprehensive income within the Consolidated Statements of Operations and Comprehensive Income and reclassified into earnings in the same period in which the hedged transaction affects earnings. The effective portion of the derivative represents the change in fair value of the hedge that offsets the change in fair value of the hedged item. To the extent changes in fair values of the instruments are not highly effective, the ineffective portion of the hedge is immediately recognized in earnings.
The Company performs an assessment of the effectiveness of its derivative contracts designated as hedges, including assessing the possibility of counterparty default. If it is determined that a derivative is no longer expected to be highly effective, hedge accounting is discontinued prospectively, and subsequent changes in the fair value of the hedge are recognized in earnings. The Company’s outstanding derivative contracts, which are interest rate cap contracts that continue to be designated as cash flow hedges, are expected to continue to be highly effective in offsetting changes in cash flow attributable to floating interest rate risk. See Note 8, “Derivatives and Risk Management” for additional information.
Use of Estimates
The preparation of the financial statements requires management of the Company to make a number of estimates and assumptions relating to the reported amount of assets and liabilities and the disclosure of contingent assets and liabilities at the date of the financial statements and the reported amounts of sales and expenses during the period. Significant items subject to such estimates and assumptions include the carrying amounts of fixed assets and intangibles, asset retirement obligations, allowances for accounts receivable and inventories, reserves for workers' compensation and general liability claims incurred but not reported, and deferred income tax assets and liabilities. Actual results could differ from these estimates.
Revenue Recognition
In accordance with Accounting Standards Update (“ASU”) No. 2014-9, “Revenue from Contracts with Customers” (“Topic 606”), revenue and cost of sales are recognized when the related performance obligations in contracts with customers are settled. Performance obligations for the Company’s retail store sales, as well as for orders placed through its website and shipped to customers, are satisfied at the point at which the customer obtains control of the inventory, which is typically at the point-of-sale. In some cases, merchandise is not physically ready for transfer to the customer at the point-of-sale, and revenue recognition is deferred until the customer has control of the inventory. Shipping and handling activities are accounted for as activities to fulfill the promise to transfer goods rather than as separate performance obligations as outlined within Topic 606. Payment is generally due from the customer immediately at the point-of-sale for both retail store sales and website sales. The nature of the goods offered primarily include hard surface flooring and related accessories. The Company does not perform installation services, and free design services are offered in-store. The transaction price recognized in revenue represents the selling price of the products offered. Sales taxes collected are not recognized as revenue as these amounts are ultimately remitted to the appropriate taxing authorities.
The Company provides customers the right to return the goods sold to them within a reasonable time period, typically 90 days. The right of return is an element of variable consideration as defined within Topic 606. Reserves for future returns of previously sold goods are estimated based on historical experience and various other assumptions that management believes to be reasonable. These reserves reduce sales and cost of sales and establish a related return asset and refund liability as defined in Topic 606. The return asset is included within prepaid expenses and other current assets, and the refund liability is included within accrued expenses and other current liabilities, each respectively on the Consolidated Balance Sheets. Merchandise exchanges of similar product and price are not considered merchandise returns and, therefore, are excluded when calculating the sales returns reserve.
Gift Cards and Merchandise Credits
The Company sells gift cards to customers through its stores and website and also issues merchandise credits in its stores. Gift cards and merchandise credits are accounted for by recognizing a liability at the time the gift card is sold or the merchandise credit is issued. The liability is relieved and revenue is recognized upon redemption. Additionally, breakage income is recognized in proportion to the pattern of rights exercised by the customer when the Company expects to be entitled to breakage. Net sales related to the estimated breakage are included in net sales in the Consolidated Statements of Operations and Comprehensive Income. The Company has an agreement with an unrelated third-party who is the issuer of the Company's gift cards and also assumes the liability for unredeemed gift cards. The Company is not subject to claims under unclaimed property statutes, as the agreement effectively transfers the ownership of such unredeemed gift cards and the related future escheatment liability, if any, to the third-party. Gift card breakage is recognized based upon historical redemption patterns and represents the balance of gift cards for which the Company believes the likelihood of redemption by the customer is remote. Accordingly, in fiscal years 2021, 2020, and 2019, the Company recognized gift card breakage income related to unredeemed gift cards of $2.4 million, $1.5 million, and $1.2 million, respectively, within net sales in the Consolidated Statements of Operations and Comprehensive Income.
Loyalty Program
The Company completed the roll out of its Pro Premier loyalty program to all stores in the second half of fiscal 2019, which allows customers to earn points through purchases from the Company’s stores and website. Loyalty points are typically awarded at one percent of the relative standalone selling price of the merchandise sold and are recognized at the time of sale as a liability with a corresponding reduction to net sales. Additionally, loyalty breakage is recognized based on the Company’s estimate of the balance of loyalty points for which the likelihood of redemption by the customer is deemed remote. This estimate is determined with assistance from the third party servicer that manages the loyalty program and is based on the Company’s historical redemption trends, market benchmarks for the pattern of redemptions for other retail loyalty programs, and other assumptions related to the likelihood of customer redemptions. Redemption patterns for the loyalty program are monitored on an ongoing basis and the estimated loyalty breakage rate will be adjusted, as necessary, as the program matures. In fiscal years 2021, 2020, and 2019, loyalty breakage of $2.2 million, $1.4 million, and $1.1 million respectively, was recognized as net sales in the Consolidated Statements of Operations and Comprehensive Income.
Sales Returns and Allowances
The Company accrues for estimated sales returns based on historical results. The allowance for sales returns at December 30, 2021 and December 31, 2020, was $36.2 million and $22.3 million, respectively.
Cost of Sales
Cost of sales consists of merchandise costs as well as freight, duty, and other costs to transport inventory to the Company’s distribution centers and stores. Cost of sales also includes costs for shrinkage, damaged product disposals, distribution, warehousing, sourcing, compliance, and arranging and paying for freight to deliver products to customers. The Company receives cash consideration from certain vendors related to vendor allowances and volume rebates, which is recorded as a reduction to the carrying value of inventory if the inventory is on hand and a reduction to cost of sales when the inventory is sold.
Vendor Rebates and Allowances
Vendor allowances consist primarily of volume rebates that are earned as a result of attaining certain inventory purchase levels and advertising allowances or incentives for the promotion of vendors' products. These vendor allowances are accrued as earned and are estimated based on annual projections.
Vendor allowances earned are initially recorded as a reduction to the carrying value of inventory and a subsequent reduction in cost of sales when the related product is sold. Certain incentive allowances that are reimbursements of specific, incremental, and identifiable costs incurred to promote vendors’ products are recorded as an offset against these promotional expenses.
Total Operating Expenses
Total operating expenses consist primarily of store and administrative personnel wages and benefits, infrastructure expenses, supplies, fixed asset depreciation, store and corporate facility expenses, pre-opening costs, training costs, and advertising costs. Credit card fees, insurance, personal property taxes, legal expenses, and other miscellaneous operating costs are also included.
Advertising Expenses
The Company expenses advertising costs as the advertising takes place. Advertising costs incurred during the fiscal years ended December 30, 2021, December 31, 2020, and December 26, 2019 were $90.4 million, $66.6 million, and $65.7 million, respectively, and are included in selling and store operating expenses and pre-opening expenses in the accompanying Consolidated Statements of Operations and Comprehensive Income.
Pre-Opening Expenses
The Company accounts for non-capital operating expenditures incurred prior to opening a new store as “pre-opening” expenses in its Consolidated Statements of Operations and Comprehensive Income. The Company's pre-opening expenses begin on average three months to one year in advance of a store opening or relocating due to, among other things, the amount of time it takes to prepare a store for its grand opening. Pre-opening expenses primarily include: advertising, rent, staff training, staff recruiting, utilities, personnel, and equipment rental. A store is considered to be relocated if it is closed temporarily and re-opened within the same primary trade area. Pre-opening expenses for the fiscal years ended December 30, 2021, December 31, 2020, and December 26, 2019, totaled $34.4 million, $21.5 million, and $24.6 million, respectively.
Stock-Based Compensation
The Company accounts for employee stock options, restricted stock, and employee stock purchase plans in accordance with ASC 718, Compensation – Stock Compensation. As necessary, the Company obtains independent third-party valuation studies to assist with determining the grant date fair value of employee stock awards. Stock options are granted with exercise prices equal to or greater than the fair market value on the date of grant as authorized by the board of directors or compensation committee. Options granted have vesting provisions ranging from one year to five years. Stock option grants are generally subject to forfeiture if employment terminates prior to vesting. The Company has selected the Black-Scholes-Merton option pricing model for estimating the grant date fair value of stock option awards granted. The Company bases the risk-free interest rate on the yield of a zero coupon U.S. Treasury security with a maturity equal to the expected life of the option from the date of the grant. The Company estimates the dividend yield to be zero as the Company does not intend to pay dividends in the future. The Company estimates the volatility of the share price of its common stock by considering the historical volatility of the Company’s common stock as well as stock of similar public entities. The Company considers a number of factors in determining the appropriateness of the public entities included in the volatility assumption, including the entity's life cycle stage, growth profile, size, financial leverage, and products offered. Stock-based compensation cost is measured at the grant date based on the value of the award and is recognized as expense over the requisite service period based on the number of years for which the requisite service is expected to be rendered.
Income Taxes
The Company accounts for income taxes under the liability method in accordance with ASC 740, Income Taxes, which requires the recognition of deferred tax assets and liabilities for the future tax consequences attributable to differences between the financial statement carrying amounts and tax basis of existing assets and liabilities. Deferred tax assets and liabilities are measured using enacted tax rates expected to apply to taxable income in the years in which those temporary differences are expected to be recovered or settled. Changes in tax laws and rates could affect recorded deferred tax assets and liabilities in the future. The effect on deferred tax assets and liabilities of a change in tax laws or rates is recognized in the period that includes the enactment date of such a change.
The ultimate realization of deferred tax assets is dependent upon the generation of future taxable income during the periods in which the associated temporary differences became deductible. On a quarterly basis, the Company evaluates whether it is more likely than not that its deferred tax assets will be realized in the future and concludes whether a valuation allowance must be established.
The Company includes any estimated interest and penalties on tax-related matters in income taxes payable and income tax expense. The Company accounts for uncertain tax positions in accordance with ASC 740. ASC 740-10 clarifies the accounting for uncertainty in income taxes recognized in an enterprise's financial statements using a two-step process for evaluating tax positions taken, or expected to be taken, on a tax return. The Company may only recognize the tax benefit from an uncertain tax position if it is more likely than not that the tax position will be sustained on examination by the taxing authorities, based on the technical merits of the position. The tax benefits recognized in the financial statements from such a position should be measured based on the largest benefit that has a greater than 50% likelihood of being realized upon ultimate settlement. In addition, the Company recognizes a loss contingency for uncertain tax positions when it is probable that a liability has been incurred and the amount of the loss can be reasonably estimated. Amounts recognized for uncertain tax positions require that management make estimates and judgments based on provisions of the tax law, which may be subject to change or varying interpretations. The Company includes estimated interest and penalties related to uncertain tax position accruals within accrued expenses and other current liabilities in the Consolidated Balance Sheets and within income tax expense in the Consolidated Statements of Operations and Comprehensive Income.
Segments
The Company operates as a multi-channel specialty retailer and commercial flooring distributor. The Company primarily sells hard surface flooring and related accessories through retail stores located in the United States and through its website.
Operating segments are defined as components of an enterprise for which discrete financial information is available that is evaluated regularly by the chief operating decision maker (“CODM”) for purposes of allocating resources and evaluating financial performance. The Company’s CODM, its Chief Executive Officer, reviews financial information presented on a consolidated basis, accompanied by information about the Company’s two operating segments, Floor & Decor Retail and Spartan, for purposes of allocating resources and evaluating financial performance. The Spartan segment, which engages in commercial flooring distribution and is entirely comprised of the Company’s Spartan subsidiary that was acquired during the second quarter of fiscal 2021, does not meet the materiality criteria of ASC 280, Segment Reporting (“ASC 280”), and is therefore not disclosed separately as a reportable segment. Specifically, the Spartan segment’s revenue, gross profit, operating income, and total assets are immaterial in relation to the Company’s consolidated revenue, gross profit, operating income, and total assets.
The Company concluded that the economic and operating characteristics of its one reportable segment, Floor & Decor Retail, are similar across its retail operations, including the net sales, gross profit and gross margin, and operating income of its retail stores as well as the nature of products and services offered, customer base, marketing initiatives, operating procedures, store layouts, employee incentive programs, methods of distribution, competitive and operating risks, and the level of shared resources across the business.
Recently Adopted Accounting Pronouncements
Presentation of Financial Statements, Financial Services—Depository and Lending, Financial Services—Investment Companies. In August 2021, the FASB issued ASU No. 2021-06, “Presentation of Financial Statements (Topic 205), Financial Services—Depository and Lending (Topic 942), and Financial Services—Investment Companies (Topic 946).” The ASU includes Release No.33-10786, Amendments to Financial Disclosures about Acquired and Disposed Businesses. This update amends certain SEC disclosure guidance that is included in the accounting standards codification to reflect the SEC’s recent issuance of rules intended to modernize and streamline disclosure requirements, including updates to business acquisition and disposition significance tests used, the significance thresholds for pro forma statement disclosures, the number of preceding years of financial statements required for disclosure, and other provisions in the SEC releases. The guidance is effective upon its addition to the FASB codification. The adoption of ASU No. 2021-06 did not have a material impact on the Company’s consolidated financial statements or related disclosures.
Simplifying the Accounting for Income Taxes. In December 2019, the Financial Accounting Standards Board (“FASB”) issued Accounting Standards Update (“ASU”) No. 2019-12, “Income Taxes (Topic 740): Simplifying the Accounting for Income Taxes.” The ASU simplifies the accounting for income taxes by removing certain exceptions to the general principles in Topic 740. The ASU also clarifies and amends existing guidance to improve consistent application among reporting entities. In the first quarter of fiscal 2021, the Company adopted ASU No. 2019-12 on a prospective basis. The adoption of ASU No. 2019-12 did not have a material impact on the Company’s consolidated financial statements.
Implementation Costs Incurred in Cloud Computing Arrangements. In August 2018, the FASB issued ASU No. 2018-15, “Intangibles-Goodwill and Other-Internal-Use Software (Subtopic 350-40): Customer's Accounting for Implementation Costs Incurred in a Cloud Computing Arrangement that is a Service Contract.” ASU No. 2018-15 aligns the requirements for capitalizing implementation costs incurred in a hosting arrangement that is a service contract with the requirements for capitalizing implementation costs incurred to develop or obtain internal-use software. In the first quarter of fiscal 2020, the Company adopted ASU No. 2018-15 on a prospective basis for implementation costs for new or existing arrangements incurred on or after the adoption date. The adoption of ASU No. 2018-15 did not have a material impact on the Company’s consolidated financial statements.
Credit Losses. In June 2016, the FASB issued ASU No. 2016-13, “Financial Instruments - Credit Losses (Topic 326): Measurement of Credit Losses on Financial Instruments,” which modifies the measurement approach for credit losses on financial assets measured on an amortized cost basis from an 'incurred loss' method to an 'expected loss' method. The amended guidance requires the measurement of expected credit losses to be based on relevant information, including historical experience, current conditions, and a reasonable and supportable forecast that affects the collectability of the related financial asset. The adoption of ASU No. 2016-13 in the first quarter of fiscal 2020 did not have a material impact on the Company’s consolidated financial statements.
Leases. In February 2016, the FASB issued ASU No. 2016-2, “Leases (Topic 842).” ASU No. 2016-2 requires that lessees recognize lease assets and lease liabilities on the balance sheet with an option to exclude short-term leases (leases with terms of 12 months or less). The guidance also requires disclosures about the amount, timing, and uncertainty of cash flows arising from leases. The Company adopted ASU No. 2016-2 in the first quarter of fiscal 2019 using the modified retrospective approach. The cumulative effect adjustment upon adoption resulted in a $0.2 million opening balance sheet reduction to retained earnings. The adoption of ASU No. 2016-2 had a material impact on the Company’s Consolidated Balance Sheets but did not have a material impact on the Company’s Consolidated Statements of Operations and Comprehensive Income or Consolidated Statements of Cash Flows. See Note 9, “Commitments and Contingencies,” for additional information related to the Company’s leases.
Recently Issued Accounting Pronouncements
Reference Rate Reform. In January 2021, the FASB issued ASU No. 2021-01, “Reference Rate Reform (Topic 848),” which provides optional guidance to ease the potential accounting and financial reporting burden of reference rate reform, including the expected market transition from the London Interbank Offered Rate (LIBOR) and other interbank offered rates to alternative reference rates. The new guidance provides temporary optional expedients and exceptions for applying U.S. GAAP to transactions affected by reference rate reform if certain criteria are met. These transactions include contract modifications, hedging relationships, and the sale or transfer of debt securities classified as held-to-maturity. Entities may apply the provisions of the new standard as of the beginning of the reporting period when the election is made. Unlike other topics, the provisions of this update are only available until December 31, 2022, by which time the reference rate replacement activity is expected to be completed. The Company is currently evaluating the impact of this standard on its consolidated financial statements and related disclosures and has yet to elect an adoption date.
Business Combinations. In October 2021, the FASB issued ASU No. 2021-08, “Business Combinations (Topic 805), Accounting for Contract Assets and Contract Liabilities from Contracts with Customers.” The ASU addresses diversity and inconsistency related to the recognition and measurement of contract assets and contract liabilities acquired in a business combination and require that an acquirer recognize and measure contract assets and contract liabilities acquired in a business combination in accordance with Topic 606, Revenue from Contracts with Customers. This standard is effective for fiscal years beginning after December 15, 2022, including interim periods within those fiscal years, and should be applied prospectively to business combinations occurring on or after the effective date of the amendments. Early adoption of the standard is permitted, including adoption in an interim period. The adoption of this standard is not expected to have a material impact on the Company's consolidated financial statements or related disclosures.
2. Revenue
Net sales consist of revenue associated with contracts with customers for the sale of goods and services in amounts that reflect the consideration the Company is entitled to receive in exchange for those goods and services.
Deferred Revenue & Contract Liabilities
In accordance with ASC 606, Revenue from Contracts with Customers, the Company recognizes revenue when the customer obtains control of the inventory. Amounts in deferred revenue at period-end reflect orders for which the inventory was not yet ready for physical transfer to customers.
Contract liabilities within the Consolidated Balance Sheets as of December 30, 2021 and December 31, 2020 primarily consisted of deferred revenue as well as amounts in accrued expenses and other current liabilities related to the Pro Premier loyalty program and unredeemed gift cards. As of December 30, 2021, contract liabilities totaled $40.2 million and included $14.5 million of deferred revenue, $20.4 million of loyalty program liabilities, and $5.3 million of unredeemed gift cards. As of December 31, 2020, contract liabilities totaled $24.8 million and included $10.1 million of deferred revenue, $12.1 million of loyalty program liabilities, and $2.6 million of unredeemed gift cards. Of the contract liabilities outstanding as of December 31, 2020, approximately $11.1 million was recognized in revenue during fiscal 2021.
Disaggregated Revenue
The Company has one reportable segment. The following table presents the net sales of each major product category for each of the last three fiscal years:
| | | | | | | | | | | | | | | | | | | | | | | | | | | | | | | | | | | | | | |
| | Fiscal Year Ended |
in thousands | | December 30,
2021 | | December 31,
2020 | | December 26,
2019 |
Product Category | | Net Sales | | % of Net Sales | | Net Sales | | % of Net Sales | | Net Sales | | % of Net Sales |
| Laminate / luxury vinyl plank | | $ | 876,714 | | | 26 | % | | $ | 555,963 | | | 23 | % | | $ | 442,171 | | | 22 | % |
| Tile | | 801,101 | | | 23 | | | 605,357 | | | 25 | | | 523,076 | | | 26 | |
| Decorative accessories / wall tile (1) | | 642,697 | | | 19 | | | 464,589 | | | 19 | | | 386,657 | | | 19 | |
Installation materials and tools | | 558,721 | | | 16 | | | 403,184 | | | 17 | | | 346,356 | | | 17 | |
Wood | | 259,637 | | | 8 | | | 211,307 | | | 9 | | | 202,888 | | | 10 | |
Natural stone | | 199,140 | | | 6 | | | 152,665 | | | 6 | | | 127,975 | | | 6 | |
| Adjacent categories (1) | | 54,482 | | | 1 | | | 20,487 | | | 1 | | | 7,251 | | | — | |
| Other (2) | | 41,041 | | | 1 | | | 12,236 | | | — | | | 9,082 | | | — | |
| Total | | $ | 3,433,533 | | | 100 | % | | $ | 2,425,788 | | | 100 | % | | $ | 2,045,456 | | | 100 | % |
(1)To conform to the current period presentation, the presentation of revenue by product category for the fiscal years ended December 31, 2020 and December 26, 2019 has been updated within this table to provide disclosure of adjacent categories, which primarily includes bathroom and kitchen products and accessories, as a separate category. In prior periods, adjacent categories revenue was included as a component of the decorative accessories / wall tile product category.
(2)Other includes delivery, sample, and other product revenue and adjustments for deferred revenue, sales returns reserves, customer rewards under the Company’s Pro Premier Loyalty program, and other revenue related adjustments that are not allocated on a product-level basis.
3. Accrued Expenses and Other Current Liabilities
Accrued expenses and other current liabilities as of December 30, 2021 and December 31, 2020 consisted of the following:
| | | | | | | | | | | |
| in thousands | December 30,
2021 | | December 31,
2020 |
| Accrued incentive compensation | $ | 36,705 | | | $ | 24,591 | |
| Sales returns and allowances | 36,210 | | | 22,266 | |
| Sales tax payable | 25,232 | | | 21,824 | |
| Accrued construction in progress new stores | 59,771 | | | 20,818 | |
| Insurance reserve incurred but not reported | 14,770 | | | 13,511 | |
| Wages and payroll tax payable | 20,147 | | | 22,349 | |
| Loyalty program liability | 20,404 | | | 12,073 | |
| Other | 35,696 | | | 24,851 | |
| Accrued expenses and other current liabilities | $ | 248,935 | | | $ | 162,283 | |
4. Fixed Assets
Fixed assets as of December 30, 2021 and December 31, 2020 consisted of the following:
| | | | | | | | | | | |
| in thousands | December 30,
2021 | | December 31,
2020 |
| Furniture, fixtures, and equipment | $ | 494,743 | | | $ | 259,696 | |
| Leasehold improvements | 465,429 | | | 380,671 | |
| Computer software and hardware | 173,046 | | | 138,321 | |
| Buildings and building improvements (1) | 126,042 | | | 65,552 | |
| Land | 80,509 | | | 30,731 | |
| Fixed assets, at cost | 1,339,769 | | | 874,971 | |
| Less: accumulated depreciation and amortization | 410,686 | | | 295,612 | |
| Fixed assets, net | $ | 929,083 | | | $ | 579,359 | |
(1) Represents buildings and building improvements on land that the Company owns as well as on land that the Company is leasing through ground leases.
Depreciation and amortization on fixed assets for the fiscal years ended December 30, 2021, December 31, 2020, and December 26, 2019 was $113.4 million, $90.1 million, and $69.9 million, respectively.
5. Intangible Assets
Goodwill and changes in the carrying amount of goodwill are as follows for the periods presented:
| | | | | | | | | | | |
| in thousands | December 30, 2021 | | December 31, 2020 |
| Goodwill, balance at beginning of year | $ | 227,447 | | | $ | 227,447 | |
Acquisitions (1) | 28,026 | | | — | |
| Goodwill, balance at end of year | $ | 255,473 | | | $ | 227,447 | |
(1) Reflects goodwill related to the Spartan acquisition. See Note 14, “Acquisition” for additional details.
The gross carrying amount and accumulated amortization of other intangible assets as of December 30, 2021 and December 31, 2020 are as follows:
| | | | | | | | | | | | | | | | | | | | | | | | | | | | | | | | | | | |
| December 30, 2021 | | December 31, 2020 |
| in thousands | Gross carrying amount | | Accumulated amortization | | Net carrying value | | Gross carrying amount | | Accumulated amortization | | Net carrying value |
| Amortizable intangible assets: | | | | | | | | | | | |
| Customer relationships | $ | 34,900 | | | $ | (1,697) | | | $ | 33,203 | | | $ | — | | | $ | — | | | $ | — | |
Non-compete agreement | 300 | | | (37) | | | 263 | | | — | | | — | | | — | |
| Total amortizable intangible assets | 35,200 | | | (1,734) | | | 33,466 | | | — | | | — | | | — | |
| Indefinite-lived intangible assets: | | | | | | | | | | | |
| Trade names | 118,469 | | | — | | | 118,469 | | | 109,269 | | | — | | | 109,269 | |
| Total intangible assets: | $ | 153,669 | | | $ | (1,734) | | | $ | 151,935 | | | $ | 109,269 | | | $ | — | | | $ | 109,269 | |
Amortization expense related to amortizable intangible assets was $1.7 million for the fiscal year ended December 30, 2021 and was immaterial for the fiscal years ended December 31, 2020 and December 26, 2019.
As of December 30, 2021, the estimated aggregate future amortizable expense related to other intangible assets is as follows:
| | | | | |
| in thousands | Amount |
| 2022 | $ | 2,974 | |
| 2023 | 2,974 | |
| 2024 | 2,974 | |
| 2025 | 2,974 | |
| 2026 | 2,908 | |
| Thereafter | 18,662 | |
| Total | $ | 33,466 | |
6. Income Taxes
The components of the provision for income taxes are as follows:
| | | | | | | | | | | | | | | | | |
| Fiscal Year Ended |
in thousands | December 30,
2021 | | December 31,
2020 | | December 26,
2019 |
| Current expense (benefit): | | | | | |
Federal | $ | 37,869 | | | $ | (1,781) | | | $ | 7,975 | |
State | 9,927 | | | 4,391 | | | 2,358 | |
| Total current expense | 47,796 | | | 2,610 | | | 10,333 | |
| Deferred expense (benefit): | | | | | |
Federal | 4,853 | | | 11,684 | | | (6,522) | |
State | (1,811) | | | (2,070) | | | (4,062) | |
| Total deferred expense (benefit) | 3,042 | | | 9,614 | | | (10,584) | |
| Provision (benefit) for income taxes | $ | 50,838 | | | $ | 12,224 | | | $ | (251) | |
The following is a summary of the differences between the total provision for income taxes as shown on the financial statements and the provision for income taxes that would result from applying the federal statutory tax rate of 21% for the fiscal years ended December 30, 2021, December 31, 2020, and December 26, 2019 to income before income taxes:
| | | | | | | | | | | | | | | | | |
| Fiscal Year Ended |
in thousands | December 30,
2021 | | December 31,
2020 | | December 26,
2019 |
| Computed “expected” provision at statutory rate | $ | 70,154 | | | $ | 43,513 | | | $ | 31,580 | |
| State income taxes, net of federal income tax benefit (1) | 6,186 | | | 1,493 | | | (1,364) | |
| Permanent differences: | | | | | |
| Excess tax benefit related to stock options exercised | (25,710) | | | (27,003) | | | (29,441) | |
| Other | 908 | | | 517 | | | 543 | |
| Total permanent differences | (24,802) | | | (26,486) | | | (28,898) | |
| Provision to return | (34) | | | (150) | | | (282) | |
| Federal tax credits | (1,471) | | | (920) | | | (1,306) | |
| CARES Act benefit | — | | | (7,676) | | | — | |
| Uncertain Tax Positions | 308 | | | 2,724 | | | — | |
| Other, net | 497 | | | (274) | | | 19 | |
| Provision (benefit) for income taxes | $ | 50,838 | | | $ | 12,224 | | | $ | (251) | |
(1) Includes state excess tax benefits related to stock options exercised for fiscal years 2021, 2020, and 2019 of $4.6 million, $5.3 million, and $5.6 million, respectively.
The tax effects of temporary differences that give rise to significant portions of the deferred income tax assets and (liabilities) are presented below:
| | | | | | | | | | | |
| in thousands | Fiscal Year Ended December 30,
2021 | | Fiscal Year Ended December 31,
2020 |
| Deferred tax assets: | | | |
| Lease liabilities | $ | 308,198 | | | $ | 259,273 | |
| Accruals not currently deductible for tax purposes | 11,622 | | | 8,293 | |
| Inventories | 10,711 | | | 6,941 | |
| Stock-based compensation | 8,754 | | | 5,979 | |
| Gift card liability | 1,254 | | | 557 | |
| Other intangibles | 335 | | | 268 | |
| Litigation accrual | 86 | | | 120 | |
| Other | 5,428 | | | 10,732 | |
| Total deferred tax assets | 346,388 | | | 292,163 | |
| Deferred tax liabilities: | | | |
| Right-of-use assets | (274,151) | | | (227,166) | |
| Fixed assets | (70,289) | | | (62,374) | |
| Intangible assets | (27,198) | | | (27,053) | |
| Other | (5,876) | | | (3,560) | |
| Total deferred tax liabilities | (377,514) | | | (320,153) | |
| Net deferred tax liabilities | $ | (31,126) | | | $ | (27,990) | |
The Company utilized $0.2 million and generated less than $0.1 million of tax-effected state net operating losses in fiscal 2021 and fiscal 2020, respectively; as of December 30, 2021, approximately $2.3 million of tax-effected state net operating losses were available to reduce future income taxes. The state net operating losses expire in various amounts beginning in fiscal 2032.
In assessing the realization of deferred tax assets, including net operating losses, management considered whether it is more likely than not that some portion or all the deferred tax assets will not be realized. The ultimate realization of deferred tax assets is dependent upon the generation of future taxable income during the periods in which those temporary differences become deductible. Management considers taxable income in prior carryback periods, future reversals of existing taxable temporary differences, tax planning strategies, and future taxable income exclusive of reversing temporary differences and carryforwards in making this assessment, and accordingly, has concluded that no valuation allowance is necessary as of December 30, 2021 or December 31, 2020.
The Company files income tax returns with the U.S. Federal government and various state jurisdictions. Prior tax years beginning in year 2018 remain open to examination by the Internal Revenue Service (“IRS”). The Company closed a federal audit with the IRS for the 2015 to 2017 tax years. Foreign, state, and local income tax returns are generally subject to examination for a period of three to five years after filing of the respective returns.
Following is a reconciliation of the beginning and ending balance of unrecognized tax benefits for periods presented:
| | | | | | | | | | | | | | | | | |
| Fiscal Year Ended |
| in thousands | December 30,
2021 | | December 31,
2020 | | December 26,
2019 |
| Unrecognized tax benefits balance at beginning of fiscal year | $ | 6,107 | | | $ | 402 | | | $ | — | |
| Additions based on tax positions related to the current year | 390 | | | 281 | | | 282 | |
| Additions for tax positions of prior years | — | | | 5,424 | | | 120 | |
| Reductions due to settlements | (5,424) | | | — | | | — | |
| Unrecognized tax benefits balance at end of fiscal year | $ | 1,073 | | | $ | 6,107 | | | $ | 402 | |
As of December 30, 2021, there were no unrecognized tax benefits that, if recognized, would affect the Company's effective tax rate, while there were $1.9 million of such unrecognized tax benefits as of December 31, 2020. The Company's policy is to classify interest and penalties related to unrecognized tax benefits in income tax expense. The Company recognized $0.6 million of interest expense related to unrecognized tax benefits during fiscal 2020 and no such interest expense during fiscal years 2021 or 2019.
Coronavirus Aid, Relief, and Economic Security Act (CARES Act)
The CARES Act includes, among other things, income tax provisions allowing for the temporary five-year carryback of net operating losses generated in 2018, 2019, and 2020, temporary modifications to the limitations placed on interest deductions, and technical corrections of tax depreciation methods for qualified improvement property (“QIP”), which changes 39-year property to 15-year property eligible for 100% tax bonus depreciation. In addition, the CARES Act includes provisions such as the temporary deferral of the employer portion of social security taxes incurred through the end of calendar 2020 and an employee retention credit for 50% of wages and health benefits paid to employees not providing services due to the COVID-19 pandemic. Subsequent to enactment of the CARES Act, additional legislation was enacted that affected the availability of employee retention credits, including the Consolidated Appropriations Act, 2021, the American Rescue Plan Act of 2021, and The Infrastructure Investment and Jobs Act. Collectively, these laws provided availability of the CARES Act employee retention credit through September 30, 2021.
As a result of the faster tax depreciation methods allowed under the CARES Act for QIP and the retroactive application of those methods for QIP placed in service during fiscal 2018 and 2019, the Company incurred a fiscal 2019 net operating loss for federal income tax purposes that was carried back to prior years during which the federal tax rate was 35%, resulting in a $7.7 million income tax benefit during the second quarter of fiscal 2020. The Company also received $28.4 million of cash refunds in fiscal 2020 related to the accelerated QIP depreciation and the carry back of the fiscal 2019 net operating loss.
During the fiscal years ended December 30, 2021 and December 31, 2020, the Company recognized employee retention credits totaling $1.0 million and $1.7 million, respectively. Within the Consolidated Statements of Operations and Comprehensive Income, employee retention credits during the periods presented were recognized as a reduction to selling and store operating expenses with the exception of $0.2 million of such credits that were recognized as an offset to general and administrative expenses during fiscal 2020.
As of December 30, 2021, the Company has deferred $6.0 million of employer social security taxes under the CARES Act that are required to be deposited by December 31, 2022 and are included in other liabilities within the Consolidated Balance Sheets.
7. Fair Value Measurements
As of December 30, 2021 and December 31, 2020, the Company had certain financial assets and liabilities on its Consolidated Balance Sheets that were required to be measured at fair value on a recurring or non-recurring basis. The estimated fair values of financial assets and liabilities such as cash and cash equivalents, receivables, prepaid expenses and other current assets, other assets, accounts payable, and accrued expenses and other current liabilities approximate their respective carrying values as reported within the Consolidated Balance Sheets. Refer to Note 1, “Summary of Significant Accounting Policies” and Note 5, “Intangible Assets” for a discussion of the valuation of goodwill and intangible assets, respectively. See Note 10, “Debt” for discussion of the fair value of the Company’s debt.
Recurring Fair Value Measurements
As of December 30, 2021, the contingent earn-out liability related to the Spartan acquisition, as described in Note 14, “Acquisition,” had an estimated fair value of $10.2 million (classified as level 3 within the fair value hierarchy), of which $2.5 million is included in accrued expenses and other current liabilities and the remaining $7.7 million is included in other liabilities within the Consolidated Balance Sheets. For the fiscal year ended December 30, 2021, a $1.1 million net increase in the fair value of the contingent earn-out liability was recognized in general and administrative expense within the Consolidated Statements of Operations and Comprehensive Income.
The Company determined the fair value of the contingent earn-out liability as of December 30, 2021 with assistance from a third-party valuation specialist using a Monte Carlo valuation method using significant unobservable inputs, including the following weighted-average assumptions: discount rate of 11.5%, Spartan revenue volatility of 29.0%, and Spartan EBITDA volatility of 55.0%.
The Company also has outstanding interest rate cap contracts that were valued primarily using level 2 inputs based on data readily observable in public markets. The Company's interest rate cap contracts were negotiated with counterparties without going through a public exchange. Accordingly, the Company's fair value assessments for these derivative contracts gave consideration to the risk of counterparty default (as well as the Company's own credit risk). As of December 30, 2021 and December 31, 2020, the total fair value of the Company's interest rate cap contracts was approximately $0.5 million and $0.1 million, respectively.
Non-recurring Fair Value Measurements
Except for the acquisition-related fair value measurements described in Note 14, “Acquisition,” there were no assets or liabilities as of December 30, 2021 or December 31, 2020 that resulted from fair value measurements made on a non-recurring basis.
8. Derivatives and Risk Management
Changes in interest rates impact the Company’s results of operations. In an effort to manage exposure to this risk, the Company enters into derivative contracts and may adjust its derivative portfolio as market conditions change.
Designated as Cash Flow Hedge
For derivative contracts designated as cash flow hedges, the effective portion of the gain or loss on the derivative is reported as a component of Accumulated Other Comprehensive Income (“AOCI”) and reclassified into earnings in the same period in which the hedged transaction affects earnings. The effective portion of the derivative represents the change in fair value of the hedge that offsets the change in fair value of the hedged item. To the extent the change in the fair value of the hedge does not perfectly offset the change in the fair value of the hedged item, the ineffective portion of the hedge is immediately recognized in earnings.
Not Designated as Accounting Hedge
For derivative contracts de-designated as accounting hedges, the change in the fair value is reflected through earnings. These changes in fair value are mark-to-market adjustments (“MTM adjustments”). MTM adjustments are defined as fair value changes recorded in periods other than the settlement period. Such fair value changes are not necessarily indicative of the actual settlement value of the underlying hedge in the contract settlement period. The AOCI related to the interest rate cap prior to the de-designation is being amortized over the remaining maturity period.
Derivative Position as of December 30, 2021:
| | | | | | | | | | | | | | | | | | | | | | | | | | | | | |
| in thousands | | Notional Balance | | Final Maturity Date | | Other Assets | | AOCI, Net of Tax |
| Designated as hedges: | | | | | | | | | |
| Interest rate cap (cash flow hedge) | | $ | 75,000 | | U.S. dollars | | April 2024 | | $ | 262 | | | $ | (106) | |
| Interest rate cap (cash flow hedge) | | $ | 75,000 | | U.S. dollars | | April 2024 | | $ | 262 | | | $ | (108) | |
| Interest rate cap (cash flow hedge) | | $ | 102,500 | | U.S. dollars | | December 2021 | | $ | — | | | $ | (272) | |
| Not designated as hedges: | | | | | | | | | |
| Interest rate cap | | $ | 102,500 | | U.S. dollars | | December 2021 | | $ | — | | | $ | (49) | |
Derivative Position as of December 31, 2020:
| | | | | | | | | | | | | | | | | | | | | | | | | | | | | |
| in thousands | | Notional Balance | | Final Maturity
Date | | Other
Assets | | AOCI, Net
of Tax |
| Designated as hedges: | | | | | | | | | |
| Interest rate cap (cash flow hedge) | | $ | 102,500 | | U.S. dollars | | December 2021 | | $ | — | | | $ | (89) | |
| Not designated as hedges: | | | | | | | | | |
| Interest rate cap | | $ | 102,500 | | U.S. dollars | | December 2021 | | $ | — | | | $ | (75) | |
Designated Hedge Gain (Losses)
Gains (losses) related to designated hedge contracts are as follows:
| | | | | | | | | | | | | | | | | | | | |
| | Effective Portion Recognized in
Other Comprehensive Income (Loss) |
| | Fiscal Year Ended |
| in thousands | | December 30,
2021 | | December 31,
2020 | | December 26,
2019 |
| Interest rate cap (cash flow hedge) | | $ | 371 | | | $ | 357 | | | $ | (379) | |
No amounts related to the effective portion of the Company’s cash flow hedges were reclassified from accumulated other comprehensive income to earnings during fiscal years 2021, 2020, or 2019.
Interest Rate Risk
The Company’s exposure to market risk from adverse changes in interest rates is primarily associated with its long-term debt obligations, which carry variable interest rates. Market risk associated with the Company’s variable interest rate long-term debt relates to the potential reduction in fair value and negative impact to future earnings, respectively, from an increase in interest rates.
In an effort to manage exposure to the risk associated with variable interest rate long term debt, the Company periodically enters into interest rate derivative contracts. These interest rate derivative contracts are used to convert the interest rate exposure on a portion of the Company’s debt portfolio from a floating rate to a capped rate and are designated as cash flow hedges.
Credit Risk
To manage credit risk associated with the Company’s interest rate hedging program, the Company selects counterparties based on their credit ratings and limits exposure to any one counterparty.
The counterparties to the Company’s derivative contracts are financial institutions with investment grade credit ratings. To manage credit risk related to its derivative financial instruments, the Company periodically monitors the credit risk of its counterparties, limits its exposure in the aggregate and to any single counterparty, and adjust its hedging positions, as appropriate. The impact of credit risk, as well as the ability of each party to fulfill its obligations under the derivative financial instruments, is considered in determining the fair value of the contracts. Credit risk has not had a significant effect on the fair value of the Company’s derivative contracts. The Company’s derivative financial instruments do not have any credit risk-related contingent features or collateral requirements.
9. Commitments and Contingencies
Lease Commitments
In the first quarter of fiscal 2019, the Company adopted ASU No. 2016-02, “Leases (Topic 842),” which requires that lessees recognize lease right-of-use assets and lease liabilities for all leases on the balance sheet with an option to exclude short-term leases (leases with terms of 12 months or less), which was elected. The Company adopted ASU No. 2016-02 using the modified retrospective approach and elected the package of practical expedients to use in transition, which permitted the Company to not reassess, under the new standard, prior conclusions about lease identification and lease classification. The cumulative effect adjustment upon adoption of ASU No. 2016-02 resulted in an immaterial adjustment to retained earnings. Additionally, the Company does not separate lease and nonlease components of contracts.
The majority of the Company’s long-term operating lease agreements are for its corporate office, retail locations, and distribution centers, which expire in various years through 2042. Most of these agreements are retail leases wherein both the land and building are leased. For a small number of retail locations, the Company has ground leases in which only the land is leased. The initial lease terms for the Company's corporate office, retail, and distribution center facilities generally range from 10-20 years. The majority of the Company’s retail and ground leases also include options to extend, which are factored into the recognition of their respective assets and liabilities when appropriate based on management’s assessment of the probability that the options will be exercised. Lease payments used in measurement of the lease liability typically do not include executory costs, such as taxes, insurance, and maintenance, unless those costs can be reasonably estimated at lease commencement. Additionally, one building lease contains variable lease payments, which are determined based on a percentage of retail sales over a contractual level, and the Company subleases real estate within one of its distribution centers to a third party. Certain of the lease agreements include escalating rents over the lease terms which, under Topic 842, results in rent being expensed on a straight-line basis over the life of the lease that commences on the date the Company has the right to control the property. The Company’s lease agreements do not contain any residual value guarantees or restrictive covenants that would reasonably be expected to have a material impact on the business.
When readily determinable, the rate implicit in the lease is used to discount lease payments to present value; however, substantially all of the Company’s leases do not provide a readily determinable implicit rate. If the rate implicit in the lease is not readily determinable, the Company uses a third party to assist in the determination of a secured incremental borrowing rate, determined on a collateralized basis, to discount lease payments based on information available at lease commencement. The secured incremental borrowing rate is estimated based on yields obtained from Bloomberg for U.S. consumers with a BB- credit rating and is adjusted for collateralization as well as inflation.
Lease Position
The table below presents supplemental balance sheet information related to operating leases.
| | | | | | | | | | | | | | | | | | | | |
in thousands, except lease term and discount rate | | Classification | | As of December 30, 2021 | | As of December 31, 2020 |
| Assets | | | | | | |
| Building | | Right-of-use assets | | $ | 972,962 | | | $ | 851,092 | |
| Land | | Right-of-use assets | | 107,764 | | | 56,708 | |
| Equipment | | Right-of-use assets | | 14,127 | | | 6,865 | |
| Software | | Right-of-use assets | | 8,897 | | | 1,660 | |
| Total operating lease assets | | | | 1,103,750 | | | 916,325 | |
| Liabilities | | | | | | |
| Current | | | | | | |
| Building | | Current portion of lease liabilities | | 92,909 | | | 88,287 | |
| Land | | Current portion of lease liabilities | | 1,385 | | | 440 | |
| Equipment | | Current portion of lease liabilities | | 6,842 | | | 3,941 | |
| Software | | Current portion of lease liabilities | | 3,466 | | | 1,834 | |
| Total current operating lease liabilities | | | | 104,602 | | | 94,502 | |
| Noncurrent | | | | | | |
| Building | | Lease liabilities | | 989,712 | | | 873,098 | |
| Land | | Lease liabilities | | 120,174 | | | 65,103 | |
| Equipment | | Lease liabilities | | 7,285 | | | 2,924 | |
| Software | | Lease liabilities | | 3,819 | | | — | |
| Total noncurrent operating lease liabilities | | | | 1,120,990 | | | 941,125 | |
| Total operating lease liabilities | | | | $ | 1,225,592 | | | $ | 1,035,627 | |
| | | | | | |
| Weighted-average remaining lease term | | | | 11 years | | 11 years |
| Weighted-average discount rate | | | | 5.1% | | 5.3% |
Lease Costs
The table below presents components of lease expense for operating leases.
| | | | | | | | | | | | | | | | | | | | | | | | | | |
| | | | Fiscal Year Ended |
| in thousands | | Classification | | December 30,
2021 | | December 31,
2020 | | December 26,
2019 |
| Fixed operating lease cost: | | Selling and store operating | | $ | 123,882 | | | $ | 105,207 | | | $ | 87,124 | |
| | Cost of sales | | 24,170 | | | 22,672 | | | 17,132 | |
| | Pre-opening | | 10,127 | | | 7,886 | | | 5,959 | |
| | General and administrative | | 4,359 | | | 4,118 | | | 2,272 | |
| Total fixed operating lease cost | | | | $ | 162,538 | | | $ | 139,883 | | | $ | 112,487 | |
| | | | | | | | |
| Variable lease cost (1): | | Selling and store operating | | $ | 42,093 | | | $ | 34,499 | | | $ | 28,894 | |
| | Cost of sales | | 5,506 | | | 4,860 | | | 3,570 | |
| | Pre-opening | | 274 | | | 657 | | | 151 | |
| | General and administrative | | 310 | | | 151 | | | 5 | |
| Total variable lease cost | | | | $ | 48,183 | | | $ | 40,167 | | | $ | 32,620 | |
| | | | | | | | |
| Sublease income | | Cost of sales | | (2,694) | | | (2,713) | | | (2,414) | |
| Operating lease right-of-use asset impairment | | General and administrative | | — | | | — | | | 4,136 | |
| Total operating lease cost (2) | | | | $ | 208,027 | | | $ | 177,337 | | | $ | 146,829 | |
(1)Includes variable costs for common area maintenance, property taxes, and insurance on leased real estate.
(2)Excludes short-term lease costs, which were immaterial for the fiscal years ended December 30, 2021, December 31, 2020, and December 26, 2019.
Undiscounted Cash Flows
Future minimum lease payments under non-cancelable operating leases (with initial or remaining lease terms in excess of one year) as of December 30, 2021 were as follows:
| | | | | | | | |
in thousands | | Amount |
| 2022 | | $ | 163,924 | |
| 2023 | | 170,295 | |
| 2024 | | 161,516 | |
| 2025 | | 151,944 | |
| 2026 | | 143,693 | |
Thereafter | | 866,242 | |
| Total minimum lease payments (1) (2) | | 1,657,614 | |
Less: amount of lease payments representing interest | | 432,022 | |
Present value of future minimum lease payments | | 1,225,592 | |
Less: current obligations under leases | | 104,602 | |
Long-term lease obligations | | $ | 1,120,990 | |
(1)Future lease payments exclude approximately $72.6 million of legally binding minimum lease payments for operating leases signed but not yet commenced.
(2)Operating lease payments include $108.5 million related to options to extend lease terms that are reasonably certain of being exercised.
For the fiscal years ended December 30, 2021, December 31, 2020, and December 26, 2019, cash paid for operating leases was $157.9 million, $131.3 million, and $112.8 million, respectively.
Right-of-Use Asset Impairment and Write Off
During the third quarter of fiscal 2019, the Company began the move from its former store support center in Smyrna, Georgia to a nearby location in Atlanta, Georgia. Prior to this period, future payments under the operating lease agreement were expected to be fully covered with proceeds from a sublease. As of the end of the third quarter of fiscal 2019, the Company no longer expected to find a sublease tenant that would fully cover these future payments and concluded that the right-of-use asset related to the operating lease was not recoverable. Therefore, the fair value of the right-of-use asset was determined based on a discounted cash flow analysis reflective of the income expected from a sublease. Based on the excess of the asset’s carrying value over fair value, an impairment of $4.1 million was recognized in the third quarter of fiscal 2019 within general and administrative expenses in the Consolidated Statements of Operations and Comprehensive Income.
In addition, during the fourth quarter of fiscal 2019, the move to the new location was completed and the lease for the previous store support center facility in Smyrna, Georgia was terminated. As a result, a loss of $1.9 million was recognized related to the settlement of remaining obligations under the lease and the write off of the remaining right-of-use asset for the facility upon lease termination. This loss was recognized within general and administrative expenses in the Consolidated Statements of Operations and Comprehensive Income.
Litigation
On November 15, 2021, the Company was added as a defendant in a wrongful death lawsuit, Nguyen v. Inspections Now, Inc., No. 21-DCV-287142, pending in the 434th Judicial District Court of Fort Bend County, Texas. Inspections Now, Inc. and Jason Post Homes, LLC are also named defendants in the case. Plaintiff’s petition alleges that unspecified “wood paneling” allegedly purchased from the Company was installed in the vicinity of plaintiff’s fireplace and caught fire while the fireplace was lit. The fire consumed plaintiff’s home and resulted in injuries to plaintiff and the death of plaintiff’s three children and mother. Plaintiff alleges product defect and failure to warn claims against the Company and negligent inspection claims against Inspections Now and Jason Post Homes. Plaintiff’s petition seeks damages in excess of $1.0 million for property damage, personal injury, and wrongful death. The petition also seeks exemplary damages. The Company responded to Plaintiff’s petition on December 13, 2021, denying the allegations, and the case is in the early stages of discovery.
On June 18, 2020, an alleged stockholder filed a putative derivative complaint, Lincolnshire Police Pension Fund v. Taylor, et al., No. 2020-0487-JTL, in the Delaware Court of Chancery, purportedly on behalf of the Company against certain of the Company’s officers, directors, and stockholders. The complaint alleges breaches of fiduciary duties and unjust enrichment. The factual allegations underlying these claims are similar to the factual allegations made in the previously dismissed In re Floor & Decor Holdings, Inc. Securities Litigation. The complaint seeks unspecified damages and restitution for the Company from the individual defendants and the payment of costs and attorneys’ fees. The time for the defendants to respond to the complaint has not yet expired.
The Company maintains insurance that may cover any liability arising out of the above-referenced litigation up to the policy limits and subject to meeting certain deductibles and to other terms and conditions thereof. Estimating an amount or range of possible losses resulting from litigation proceedings is inherently difficult, particularly where the matters involve indeterminate claims for monetary damages and are in the stages of the proceedings where key factual and legal issues have not been resolved. For these reasons, the Company is currently unable to predict the ultimate timing or outcome of or reasonably estimate the possible losses or a range of possible losses resulting from the above-referenced litigation.
The Company is also subject to various other legal actions, claims and proceedings arising in the ordinary course of business, which may include claims related to general liability, workers’ compensation, product liability, intellectual property and employment-related matters resulting from its business activities. As with most actions such as these, an estimation of any possible and/or ultimate liability cannot always be determined. The Company establishes reserves for specific legal proceedings when it determines that the likelihood of an unfavorable outcome is probable and the amount of loss can be reasonably estimated. These various other ordinary course proceedings are not expected to have a material impact on the Company's consolidated financial position, cash flows, or results of operations, however regardless of the outcome, litigation can have an adverse impact on the Company because of defense and settlement costs, diversion of management resources, and other factors.
10. Debt
The following table summarizes the Company's long-term debt as of December 30, 2021 and December 31, 2020:
| | | | | | | | | | | | | | | | | | | | | | | | | | |
| in thousands | Maturity Date | | Interest Rate Per Annum at December 30,
2021 | | December 30,
2021 | | December 31,
2020 |
| Credit Facilities: | | | | | | | | |
| Term Loan B | February 14, 2027 | | 2.09% | Variable | | $ | 206,602 | | | $ | 143,179 | |
| Term Loan B-1 | February 14, 2027 | | n/a | Variable | | — | | | 74,625 | |
| Total secured debt at par value | | | | | | 206,602 | | | 217,804 | |
| Less: current maturities | | | | | | 2,103 | | | 1,647 | |
| Long-term debt maturities | | | | | | 204,499 | | | 216,157 | |
| Less: unamortized discount and debt issuance costs | | | | | | 8,737 | | | 9,000 | |
| Total long-term debt | | | | | | $ | 195,762 | | | $ | 207,157 | |
n/a - not applicable
Market risk associated with the Company's fixed and variable rate long-term debt relates to the potential change in fair value and negative impact to future earnings, respectively, from a change in interest rates. The aggregate fair value of debt is based primarily on the Company's estimates of interest rates, maturities, credit risk, and underlying collateral and is classified as Level 3 within the fair value hierarchy.
The following table summarizes scheduled maturities of the Company’s debt, including current maturities, as of December 30, 2021:
| | | | | |
| in thousands | Amount |
| 2022 | $ | 2,103 | |
| 2023 | 2,103 | |
| 2024 | 2,103 | |
| 2025 | 2,103 | |
| 2026 | 2,629 | |
| Thereafter | 195,561 | |
| Total minimum debt payments | $ | 206,602 | |
Components of interest expense are as follows for the periods presented:
| | | | | | | | | | | | | | | | | |
| Fiscal Year Ended |
| in thousands | December 30,
2021 | | December 31,
2020 | | December 26,
2019 |
| Total interest costs, net of interest income | $ | 7,657 | | | $ | 9,606 | | | $ | 8,801 | |
| Interest capitalized | $ | 2,733 | | | $ | 1,217 | | | $ | — | |
| Interest expense, net | $ | 4,924 | | | $ | 8,389 | | | $ | 8,801 | |
Term Loan Facility
On February 9, 2021 (the “Effective Date”), Outlets entered into a fifth amendment to the credit agreement governing its senior secured term loan facility (as amended, the “Term Loan Facility”). The fifth amendment provided for, among other things, a supplemental term loan in the aggregate principal amount of $65.0 million (the “Supplemental Term Loan Facility”) that increased the term loan B facility. The Supplemental Term Loan Facility has the same maturity date (February 14, 2027) and terms as the term loan B facility, except that voluntary prepayments made within six months after the Effective Date are subject to a 1.00% soft call prepayment premium. The other terms of loans under the Term Loan Facility remain unchanged, including the applicable margin for loans under the term loan B facility. The proceeds of the Supplemental Term Loan Facility, together with cash on hand, were used to (i) repay the $75.0 million term loan B-1 facility and (ii) pay fees and expenses incurred in connection with the Supplemental Term Loan Facility.
The Term Loan Facility (including loans under the Supplemental Term Loan Facility) provides a margin for loans of: (x) in the case of ABR Loans (as defined in the Term Loan Facility) 1.00% per annum (subject to a leverage-based step-up to 1.25% if Outlets exceeds certain leverage ratio tests), and (y) in the case of Eurodollar Loans (as defined in the Term Loan Facility) 2.00% per annum (subject to a leverage-based step-up to 2.25% if Outlets exceeds certain leverage ratio tests and a 0.00% floor on Eurodollar Loans).
All obligations under the Term Loan Facility (including loans under the Supplemental Term Loan Facility) are secured by (1) a first-priority security interest in substantially all of the property and assets of Outlets and the other guarantors under the Term Loan Facility, with certain exceptions, and (2) a second-priority security interest in the collateral securing the asset-based loan facility (“ABL” or “ABL Facility”).
The Company evaluated the fifth amendment to the Term Loan Facility in accordance with ASC 470-50, Debt, and determined that the amendment resulted in a debt modification that was not an extinguishment. Therefore, no loss on debt extinguishment was recognized. The Company incurred costs of $1.6 million in connection with the refinancing which were comprised of (i) $1.4 million of fees to creditors that were accounted for as debt issuance costs and are amortizing to interest expense over the term of the Term Loan Facility using the interest method and (ii) $0.2 million of professional fees to other third parties that were expensed during the fiscal year ended December 30, 2021 and included in general and administrative expense on the Consolidated Statements of Operations and Comprehensive Income.
Gain on Debt Extinguishment
During the second quarter of fiscal 2020, the Company evaluated a fourth amendment to the Term Loan Facility in accordance with ASC 470-50, "Debt - Modifications and Extinguishments," on a lender-by-lender basis and determined that the incremental term loan borrowing was provided entirely by one lender and its affiliates. As this lender held a portion of the existing Term Loan Facility debt, the Company performed the 10% cash flow test pursuant to ASC 470-50-40-10 and concluded that the results exceeded the 10% threshold. As a result, the Company accounted for this transaction as a partial extinguishment and derecognized the existing debt held by this lender and recorded the new debt at fair value. Based on the difference between the reacquisition price and carrying amount of debt, the Company recognized a $1.0 million gain on early extinguishment of debt during the second quarter of fiscal 2020, which included the original issuance discount of $4.1 million and $0.5 million of unamortized debt issuance costs related to the extinguished debt as part of the calculation.
ABL Facility
As of December 30, 2021, the Company's ABL Facility had a maximum availability of $400.0 million with actual available borrowings limited to the sum, at the time of calculation, of (a) eligible credit card receivables multiplied by the credit card advance rate, plus (b) the cost of eligible inventory, net of inventory reserves, multiplied by the applicable appraisal percentage, plus (c) 85% of eligible net trade receivables, plus (d) all eligible cash on hand, plus (e) 100% of the amount for which the eligible letter of credit must be honored after giving effect to any draws, minus certain Availability Reserves (each component as defined in the ABL Facility). The ABL Facility has a maturity date of February 14, 2025 and is available for issuance of letters of credit and contains a sublimit of $50.0 million for standby letters of credit and commercial letters of credit combined. Available borrowings under the facility are reduced by the face amount of outstanding letters of credit.
All obligations under the ABL Facility are secured by (1) a first-priority security interest in the cash and cash equivalents, accounts receivable, inventory, and related assets of Outlets and the other guarantors under the ABL Facility, with certain exceptions, and (2) a second-priority security interest in substantially all of the other property and assets of Outlets and the other guarantors under the Term Loan Facility.
Net availability under the ABL Facility, as reduced by outstanding letters of credit of $22.5 million, was $377.5 million based on financial data as of December 30, 2021.
Covenants
The credit agreements governing the Term Loan Facility and ABL Facility contain customary restrictive covenants, which, among other things and with certain exceptions, limit the Company’s ability to (i) incur additional indebtedness and liens in connection with such indebtedness, (ii) pay dividends and make certain other restricted payments, (iii) effect mergers or consolidations, (iv) enter into transactions with affiliates, (v) sell or dispose of property or assets, and (vi) engage in unrelated lines of business. In addition, these credit agreements subject the Company to certain reporting obligations and require that the Company satisfy certain financial covenants, including, among other things, a requirement that if borrowings under the ABL Facility exceed 90% of availability, the Company will maintain a certain fixed charge coverage ratio (defined as Consolidated EBITDA less non-financed capital expenditures and income taxes paid to consolidated fixed charges, in each case as more fully defined in the ABL Facility).
The Term Loan Facility has no financial maintenance covenants. The Company is currently in compliance with all material covenants under the credit agreements.
Deferred Debt Issuance Costs and Original Issue Discounts
Deferred debt issuance costs related to the ABL Facility were approximately $0.8 million as of December 30, 2021 and $1.0 million as of December 31, 2020 and are included in other assets on the Consolidated Balance Sheets. Deferred debt issuance costs and original issue discounts related to the Term Loan Facility were $8.7 million as of December 30, 2021 and $9.0 million as of December 31, 2020 and are included in term loans on the Consolidated Balance Sheets. For the fiscal years ended December 30, 2021, December 31, 2020, and December 26, 2019, deferred debt issuance and original issue discount amortization expense was $1.9 million, $1.4 million, and $1.1 million, respectively, and is included in interest expense, net on the Company’s Consolidated Statements of Operations and Comprehensive Income.
Fair Value of Debt
The fair values of certain of the Company’s debt instruments have been determined by utilizing Level 3 inputs, such as available market information and appropriate valuation methodologies, including the rates for similar instruments and the discounted cash flows methodology. Market risk associated with the Company’s fixed and variable rate long-term debt relates to the potential change in fair value and negative impact to future earnings, respectively, from a change in interest rates. The aggregate fair value of debt was based primarily on discounted cash flows utilizing estimated interest rates, maturities, credit risk, and underlying collateral and is classified primarily as Level 3 within the fair value hierarchy. At December 30, 2021 and December 31, 2020, the fair values of the Company’s debt are as follows:
| | | | | | | | | | | | | | |
in thousands | | December 30,
2021 | | December 31,
2020 |
Total debt at par value | | $ | 206,602 | | | $ | 217,804 | |
Less: unamortized discount and debt issuance costs | | 8,737 | | | 9,000 | |
Net carrying amount | | 197,865 | | | 208,804 | |
Fair value | | $ | 202,986 | | | $ | 215,626 | |
11. Stockholders’ Equity
Common Stock
The Company has three classes of common stock: Class A, Class B, and Class C. The holders of Class A common stock, Class B common stock, and Class C common stock are entitled to share equally, on a per share basis, in dividends or other distributions. Class A common stockholders are entitled to one vote per share held. Class B and Class C common stockholders have no voting rights, except as otherwise provided by law. In the event of the voluntary liquidation or dissolution of the Company, each class of stock will share equally, on a per share basis, in all the assets of the Company that are available for distribution to stockholders.
Stock Incentive Plans
On January 13, 2011, the Company adopted the 2011 Stock Option Plan (as amended, restated, supplemented or otherwise modified from time to time, the “2011 Plan”) to provide for the grant of stock options to employees (including officers), consultants and non-employee directors of the Company and its subsidiaries. Pursuant to the terms of the 2011 Plan, the Company was authorized to grant options for the purchase of up to 12,520,407 shares as of December 29, 2016 and 10,780,970 shares as of December 31, 2015. As of December 29, 2016 and December 31, 2015, there were 179,575 and 104,269 shares available for grant pursuant to awards under the 2011 Plan, respectively. The Company ceased granting awards under the 2011 Plan upon the implementation of the 2017 Plan (as defined below).
On April 13, 2017, the board of directors approved the Floor & Decor Holdings, Inc. 2017 Stock Incentive Plan (the “2017 Plan”), which was subsequently approved by the Company’s stockholders. The 2017 Plan authorizes the Company to grant options and restricted stock awards to eligible employees (including officers), consultants, and non-employee directors up to an aggregate of 5,000,000 shares of Class A common stock. As of December 30, 2021 and December 31, 2020, there were 1,926,142 and 2,120,839 shares available for grant pursuant to awards under the 2017 Plan, respectively.
Secondary Offerings
On August 13, 2020, certain of the Company’s stockholders completed a secondary public offering (the “August Secondary Offering”) of an aggregate of 5,686,422 shares of common stock at a price to the public of $67.60 per share. The Company did not sell any shares in the August Secondary Offering and did not receive any proceeds from the sales of shares by the selling stockholders.
On May 22, 2020, certain of the Company’s stockholders completed a secondary public offering (the “May 2020 Secondary Offering”) of an aggregate of 4,972,900 shares of common stock at a price to the public of $44.55 per share. The Company did not sell any shares in the May 2020 Secondary Offering and did not receive any proceeds from the sales of shares by the selling stockholders.
On February 28, 2019, certain of the Company’s stockholders completed a secondary public offering (the “February Secondary Offering”) of an aggregate of 10,000,000 shares of common stock at a price to the public of $37.50 per share. The Company did not sell any shares in the February Secondary Offering and did not receive any proceeds from the sales of shares by the selling stockholders.
Stock-based Compensation
The Company accounts for stock-based compensation in accordance with ASC 718, Compensation- Stock Compensation, which requires measurement of compensation cost for all stock awards at fair value on the date of grant and recognition of compensation, net of forfeitures, over the requisite service period for awards expected to vest. Stock-based compensation expense for the fiscal years ended December 30, 2021, December 31, 2020, and December 26, 2019 was $20.5 million, $16.1 million, and $8.7 million, respectively, and was included in general and administrative expenses on the Company’s Consolidated Statements of Operations and Comprehensive Income.
Stock Options
Stock options are granted with an exercise price greater than or equal to the fair market value on the date of grant, as authorized by the Company’s board of directors or compensation committee. Options granted have contractual terms of ten years and vesting provisions ranging from one year to five years. Stock options granted to eligible employees during fiscal 2021 vest in four ratable annual installments on each of the first four anniversaries of the grant date, subject to the grantee’s continued service through the applicable vesting date. Stock option grants are generally subject to forfeiture if employment terminates prior to vesting.
Stock option award grant date fair values were estimated using the Black-Scholes-Merton option pricing model with the following weighted-average assumptions:
| | | | | | | | | | | | | | | | | |
| Fiscal Year Ended |
| December 30,
2021 | | December 31,
2020 | | December 26,
2019 |
| Weighted average fair value per stock option | $ | 41.75 | | $ | 22.27 | | $ | 20.38 |
| Risk-free interest rate | 0.80% | | 1.17% | | 2.06% |
| Expected volatility | 48% | | 39% | | 45% |
| Expected life (in years) | 5.40 | | 5.75 | | 6.68 |
| Dividend yield | —% | | —% | | —% |
The Company determines the grant date fair value of stock options with assistance from a third-party valuation specialist. Expected volatility is estimated based on the historical volatility of the Company’s Class A common stock since its initial public offering in 2017 as well as the historical volatility of the common stock of similar public entities. The Company considers various factors in determining the appropriateness of the public entities used in determining expected volatility, including the entity's life cycle stage, industry, growth profile, size, financial leverage, and products offered. To determine the expected life of the options granted, the Company relied upon a combination of the observed exercise behavior of prior grants with similar characteristics and the contractual terms and vesting schedules of the current grants. The risk-free interest rate is based on the term structure of interest rates at the time of the option grant.
The table below summarizes stock option activity for the fiscal year ended December 30, 2021:
| | | | | | | | | | | | | | | | | | | | | | | |
| Options | | Weighted
Average
Exercise
Price | | Weighted Average Remaining Contractual Life (Years) | | Aggregate Intrinsic Value (in thousands) |
| Outstanding at January 1, 2021 | 3,740,604 | | | $ | 20.72 | | | | | |
| Granted | 66,505 | | | 95.68 | | | | | |
| Exercised | (1,252,566) | | | 11.77 | | | | | |
| Forfeited or expired | (50,889) | | | 39.11 | | | | | |
| Outstanding at December 30, 2021 | 2,503,654 | | | $ | 26.81 | | | 5.7 | | $ | 258,395 | |
| Vested and exercisable at December 30, 2021 | 1,685,628 | | | $ | 19.58 | | | 5.2 | | $ | 186,097 | |
The fair value of stock options vested during the fiscal years ended December 30, 2021, December 31, 2020, and December 26, 2019 was $8.8 million, $7.5 million, and $7.5 million, respectively. The aggregate intrinsic value of stock options exercised was $126.6 million, $135.5 million, and $146.6 million for the fiscal years ended December 30, 2021, December 31, 2020, and December 26, 2019, respectively.
The Company’s total unrecognized compensation cost related to stock options as of December 30, 2021 and December 31, 2020 was $9.7 million and $16.0 million, respectively. The unrecognized compensation cost remaining as of December 30, 2021 is expected to be recognized over a weighted average period of 1.9 years.
Restricted Stock Units
During the fiscal year ended December 30, 2021, the Company granted restricted stock units to certain employees that represent an unfunded, unsecured right to receive a share of the Company’s Class A common stock upon vesting. These awards vest in four ratable annual installments on each of the first four anniversaries of the grant date, subject to the grantee’s continued service through the applicable vesting date. The fair value of the restricted stock units was determined based on the closing price of the Company’s Class A common stock on the date of grant.
The following table summarizes restricted stock unit activity during the fiscal year ended December 30, 2021:
| | | | | | | | | | | |
| Restricted Stock Units | | Weighted Average Grant Date Fair Value |
| Unvested at January 1, 2021 | 128,220 | | | $ | 59.40 | |
| Granted | 129,290 | | | 99.78 | |
| Vested | (28,631) | | | 58.01 | |
| Forfeited | (14,101) | | | 76.14 | |
| Unvested at December 30, 2021 | 214,778 | | | $ | 82.80 | |
The total unrecognized compensation cost related to restricted stock units as of December 30, 2021 and December 31, 2020 was $14.0 million and $6.2 million, respectively. The unrecognized compensation cost remaining as of December 30, 2021 is expected to be recognized over a weighted average period of 3.0 years.
Restricted Stock Awards
During the fiscal year ended December 30, 2021, the Company issued service-based restricted stock awards to certain executive officers and non-employee directors that are subject to the grantee’s continued service through the applicable vesting date. Service-based restricted stock awards granted during the period to executive officers vest in four ratable annual installments on each of the first four anniversaries of the grant date, while such awards granted to non-employee directors during the period cliff vest on the first anniversary from the grant date.
The following table summarizes restricted stock award activity during the fiscal year ended December 30, 2021:
| | | | | | | | | | | | | | | | | | | | | | | | | | | | | | | | | | | |
| Restricted Stock Awards |
| Service-based | | Performance-based | | TSR |
| Shares | | Weighted Average Grant Date Fair Value | | Shares | | Weighted Average Grant Date Fair Value | | Shares | | Weighted Average Grant Date Fair Value |
| Unvested at January 1, 2021 | 131,844 | | | $ | 53.72 | | | 160,315 | | | $ | 57.70 | | | 104,456 | | | $ | 44.28 | |
| Granted | 29,153 | | | 96.86 | | | — | | | — | | | — | | | — | |
| Vested | (13,764) | | | 49.70 | | | — | | | — | | | — | | | — | |
| Forfeited | (2,508) | | | 46.37 | | | — | | | — | | | — | | | — | |
| Unvested at December 30, 2021 | 144,725 | | | $ | 62.92 | | | 160,315 | | | $ | 57.70 | | | 104,456 | | | $ | 44.28 | |
The fair value of performance-based and service-based restricted stock awards is based on the closing market price of the Company's Class A common stock on the date of grant. The fair value of the TSR awards is estimated on grant date using the Monte Carlo valuation method. Compensation cost for restricted stock awards is recognized using the straight-line method over the requisite service period, which for each of the awards is the service vesting period. As of December 30, 2021 and December 31, 2020, total unrecognized compensation cost related to unvested restricted stock awards was $10.9 million and $15.2 million, respectively. The unrecognized compensation cost remaining as of December 30, 2021 is expected to be recognized over a weighted average period of 1.9 years.
The total fair value of restricted stock awards that vested during the fiscal years ended December 30, 2021, December 31, 2020, and December 26, 2019 was $1.4 million, $0.5 million, and $0.5 million, respectively.
Employee Stock Purchase Plan
The Employee Stock Purchase Plan (the “ESPP”) is a tax-qualified plan under Section 423 of the Internal Revenue Code and permits eligible employees to purchase shares of the Company’s common stock through payroll deductions, subject to certain limitations. The Company has designated a purchase price per share of common stock acquired under the ESPP at the lesser of 90% of the lower of the fair market value of its common stock on either the first or last trading day of each six-month offering period. There are 1,500,000 shares of the Company’s Class A common stock, par value $0.001 per share, approved for issuance under the ESPP, 46,273, 56,389, and 104,363 of which were issued during fiscal years 2021, 2020, and 2019, respectively. During fiscal years 2021, 2020, and 2019, the Company recognized stock-based compensation expense related to the ESPP totaling $1.0 million, $0.7 million, and $0.5 million, respectively.
Deferred Compensation Plan
In October 2019, the Company adopted the 2019 Director Nonqualified Excess Plan (the “Plan”) to provide for certain employees or independent contractors of the employer (including directors) to elect to defer compensation, including restricted stock grants, until they separate from service. The Plan is intended to be a nonqualified deferred compensation plan that complies with the provisions of Section 409A of the Internal Revenue Code and is effective for compensation starting in fiscal 2020. Deferrals and related compensation expense under the Plan were immaterial in fiscal years 2021 and 2020.
12. Earnings Per Share
Net Income per Common Share
The Company calculates basic earnings per share by dividing net income by the weighted average number of common shares outstanding during the period. Diluted earnings per share is computed by dividing net income by the weighted average number of common shares outstanding adjusted for the dilutive effect of share-based awards.
The following table shows the computation of basic and diluted earnings per share for the periods presented:
| | | | | | | | | | | | | | | | | | | | |
| | Fiscal Year Ended |
| in thousands, except per share data | | December 30,
2021 | | December 31,
2020 | | December 26,
2019 |
| Net income | | $ | 283,230 | | | $ | 194,981 | | | $ | 150,631 | |
| Basic weighted average shares outstanding | | 104,683 | | | 102,690 | | | 99,435 | |
| Dilutive effect of share-based awards | | 2,707 | | | 3,452 | | | 5,527 | |
| Diluted weighted average shares outstanding | | 107,390 | | | 106,142 | | | 104,962 | |
| Basic earnings per share | | $ | 2.71 | | | $ | 1.90 | | | $ | 1.51 | |
| Diluted earnings per share | | $ | 2.64 | | | $ | 1.84 | | | $ | 1.44 | |
The following potentially dilutive securities were excluded from the computation of diluted earnings per share as a result of their anti-dilutive effect:
| | | | | | | | | | | | | | | | | | | | |
| | Fiscal Year Ended |
| in thousands | | December 30,
2021 | | December 31,
2020 | | December 26,
2019 |
| Stock options | | 71 | | | 320 | | | 971 | |
13. Selected Quarterly Financial Information (unaudited)
The following tables present the Company’s unaudited quarterly results for fiscal 2021 and fiscal 2020.
| | | | | | | | | | | | | | | | | | | | | | | | | | |
| | Fiscal 2021 |
| in thousands, except per share data | | First Quarter | | Second Quarter | | Third Quarter | | Fourth Quarter |
Net sales | | $ | 782,537 | | | $ | 860,108 | | | $ | 876,553 | | | $ | 914,335 | |
Gross profit | | 336,933 | | | 365,438 | | | 365,308 | | | 354,587 | |
Net income | | 75,796 | | | 82,916 | | | 74,645 | | | 49,873 | |
Basic earnings per share | | 0.73 | | | 0.79 | | | 0.71 | | | 0.47 | |
Diluted earnings per share | | 0.71 | | | 0.77 | | | 0.69 | | | 0.46 | |
| | | | | | | | | | | | | | | | | | | | | | | | | | |
| | Fiscal 2020 |
| in thousands, except per share data | | First Quarter | | Second Quarter | | Third Quarter | | Fourth Quarter |
Net sales | | $ | 554,937 | | | $ | 462,352 | | | $ | 684,847 | | | $ | 723,652 | |
Gross profit | | 236,032 | | | 196,692 | | | 294,628 | | | 307,540 | |
Net income | | 37,063 | | | 32,004 | | | 68,774 | | | 57,140 | |
Basic earnings per share | | 0.36 | | | 0.31 | | | 0.67 | | | 0.55 | |
Diluted earnings per share | | 0.35 | | | 0.30 | | | 0.65 | | | 0.54 | |
14. Acquisition
On June 4, 2021 (“acquisition date” or “closing date”), the Company acquired Spartan Surfaces, Inc. (“Spartan”), a commercial specialty hard-surface flooring distribution company, for total estimated purchase consideration of $77.7 million. The acquisition was accounted for in accordance with ASC 805, Business Combinations, and, accordingly, Spartan’s results of operations, financial position, and cash flows have been consolidated in the Company’s consolidated financial statements since the date of acquisition. The Company determined that Spartan is not a significant subsidiary as defined in Rule 1-02(w), Securities Act Rule 405, and Exchange Act Rule 12b-2. The acquisition was not material to the Company’s consolidated results of operations or financial position for the periods presented and, therefore, pro forma information has not been presented. During the fiscal year ended December 30, 2021, we recognized business acquisition and integration costs totaling $3.4 million within general and administrative expenses within the Consolidated Statements of Operations and Comprehensive Income. The Company incurred no business acquisition or integration costs in fiscal 2020 or 2019.
The following table summarizes the fair values of the components of the purchase price as of the acquisition date:
| | | | | | | | |
| in thousands | | |
| Cash, net of cash acquired | | $ | 63,567 | |
| Floor and Decor Class A common stock | | 5,000 | |
| Contingent consideration | | 9,090 | |
| Total purchase price | | $ | 77,657 | |
The contingent consideration represents the estimated fair value associated with potential earn-out payments to the seller of up to $18.0 million subject to Spartan's achievement of certain financial performance targets in fiscal years 2021 through 2024. Of the total earn-out consideration, $9.0 million is related to the achievement of certain annual adjusted EBITDA margin targets, and $9.0 million is related to the achievement of certain annual gross profit targets. A portion of these earn-out opportunities is payable each year subject to achievement of the applicable performance targets for that year, with the maximum payout requiring that each of the individual annual targets are met. The Company determined the fair value of the contingent earn-out consideration (“contingent earn-out liability”) with assistance from a third-party valuation specialist using a Monte Carlo valuation method. Significant assumptions included the amount and timing of projected cash flows, growth rates, volatility, and discount factors. The contingent earn-out liability is classified as Level 3 within the fair value hierarchy due to the use of unobservable inputs that are significant to its valuation and is required to be remeasured at each reporting date through the applicable earn-out periods, with any resulting gains or losses recognized in general and administrative expenses in the period of remeasurement.
The following table summarizes the estimated fair values of the assets acquired and liabilities assumed at the acquisition date:
| | | | | | | | |
| in thousands | | Fair Value |
| Current assets | | $ | 16,467 | |
Fixed assets, net | | 970 | |
| Right-of-use assets | | 3,300 | |
| Intangible assets, net | | 44,400 | |
| Goodwill | | 28,026 | |
| Total assets acquired | | $ | 93,163 | |
| | |
| Current liabilities | | $ | 12,393 | |
| Lease liabilities | | 2,725 | |
| Other liabilities | | 388 | |
| Total liabilities assumed | | $ | 15,506 | |
| | |
| Net assets acquired | | $ | 77,657 | |
The fair values of identifiable intangible assets were determined with assistance from a third-party valuation specialist using the multi-period excess earnings method for customer relationships, the relief-from-royalty method for the trade name, and an incremental income method for the non-compete agreement. These valuation methodologies included significant assumptions such as the amount and timing of projected cash flows, growth rates, customer attrition rates, discount rates, royalty rates (for use in estimating the fair value of the Spartan trade name), and the assessment of each asset’s life cycle. Following are the estimated fair values, which are classified within Level 3 of the fair value hierarchy, and estimated remaining useful lives of identifiable intangibles assets as of the acquisition date:
| | | | | | | | | | | | | | |
| in thousands | | Useful Life (Years) | | Fair Value |
| Identifiable intangible assets: | | | | |
| Customer relationships | | 12 | | $ | 34,900 | |
| Trade name | | Indefinite | | 9,200 | |
Non-compete agreement | | 5 | | 300 | |
| Total identifiable intangible assets | | | | $ | 44,400 | |
The goodwill arising from the acquisition is primarily attributable to operational synergies and acceleration of growth strategies. The goodwill and intangible assets from the Spartan acquisition are expected to be deductible for U.S. federal and state tax purposes.
ITEM 9. CHANGES IN AND DISAGREEMENTS WITH ACCOUNTANTS ON ACCOUNTING AND FINANCIAL DISCLOSURE.
None.
ITEM 9A. CONTROLS AND PROCEDURES.
Evaluation of Disclosure Controls and Procedures
Our management, with the participation of our Chief Executive Officer and Chief Financial Officer, has evaluated the effectiveness of our disclosure controls and procedures (as such term is defined in Rules 13a-15(e) and 15d-15(e) under the Securities Exchange Act of 1934, as amended (the “Exchange Act”)) as of the end of the period covered by this report. Disclosure controls and procedures are designed to provide reasonable assurance that the information required to be disclosed in the reports that we file or submit under the Exchange Act has been appropriately recorded, processed, summarized and reported on a timely basis and are effective in ensuring that such information is accumulated and communicated to the Company’s management, including our Chief Executive Officer and Chief Financial Officer, as appropriate to allow timely decisions regarding required disclosure. Based on such evaluation, our Chief Executive Officer and Chief Financial Officer have concluded that, as of December 30, 2021, our disclosure controls and procedures were effective.
Management’s Report on Internal Control over Financial Reporting
Our management is responsible for establishing and maintaining an adequate system of internal control over financial reporting (as defined in Rules 13a-15(f) and 15d-15(f) under the Exchange Act), pursuant to Rule 13a-15(c) of the Exchange Act. Our internal control over financial reporting is designed to provide reasonable assurance regarding the reliability of financial reporting and the preparation of financial statements for external purposes in accordance with GAAP.
A company’s internal control over financial reporting includes policies and procedures that: (i) pertain to the maintenance of records that, in reasonable detail, accurately and fairly reflect the transactions and dispositions of the assets of the company, (ii) provide reasonable assurance that transactions are recorded as necessary to permit preparation of financial statements in accordance with GAAP, and that receipts and expenditures of the company are being made only in accordance with authorizations of management and directors of the company, and (iii) provide reasonable assurance regarding prevention or timely detection of unauthorized acquisition, use or disposition of the company’s assets that could have a material effect on the financial statements.
Because of its inherent limitations, internal control over financial reporting may not prevent or detect misstatements. Projections of any evaluation of effectiveness for future periods are subject to the risk that controls may become inadequate because of changes in conditions, or that the degree of compliance with the policies or procedures may deteriorate.
Under the supervision and with the participation of our management, we assessed the effectiveness of our internal control over financial reporting as of December 30, 2021, using the criteria set forth by the Committee of Sponsoring Organizations of the Treadway Commission (COSO) in Internal Control—Integrated Framework (2013). Based on this assessment, management concluded that the Company’s internal control over financial reporting was effective as of December 30, 2021.
Management excluded Spartan from our assessment of internal control over financial reporting as of December 30, 2021, which is in accordance with SEC guidance that permits registrants to exclude a recently acquired business from the scope of management’s report on internal control over financial reporting for the first year after the acquisition is completed. Spartan represents less than 3% of the Company’s consolidated total assets and less than 2% of the Company’s consolidated net sales, as of and for the fiscal year ended December 30, 2021. For more information regarding the Spartan acquisition, see Note 14, “Acquisition,” in the notes to our consolidated financial statements included in this Annual Report.
Ernst & Young LLP, our independent registered public accounting firm, has issued an unqualified opinion on the effectiveness of internal control over financial reporting as of December 30, 2021, which is included in “Part II, Item 8 - Financial Statements and Supplementary Data.”
Changes in Internal Control over Financial Reporting
There have been no changes in our internal control over financial reporting (as defined in Rules 13a-15(f) or 15d-15(f) of the Exchange Act) during the fourth quarter of our fiscal year ended December 30, 2021 that have materially affected, or are reasonably likely to materially affect, our internal control over financial reporting.
ITEM 9B. OTHER INFORMATION.
None.
ITEM 9C. DISCLOSURE REGARDING FOREIGN JURISDICTIONS THAT PREVENT INSPECTIONS.
Not applicable.
PART III
ITEM 10. DIRECTORS, EXECUTIVE OFFICERS AND CORPORATE GOVERNANCE.
The information required by this Item will be contained in our definitive Proxy Statement in connection with our 2022 Annual Meeting of Stockholders, which will be filed with the SEC within 120 days after the end of our fiscal year ended December 30, 2021 (the “Proxy Statement”), and is incorporated herein by reference.
ITEM 11. EXECUTIVE COMPENSATION.
The information required by this Item will be set forth in the Proxy Statement and is incorporated herein by reference, under the captions “Director Compensation,” “Executive Compensation” and “Compensation Discussion and Analysis;” provided, however, that the subsection entitled “Executive Compensation—Compensation Committee Report” shall not be deemed to be incorporated by reference.
ITEM 12. SECURITY OWNERSHIP OF CERTAIN BENEFICIAL OWNERS AND MANAGEMENT AND RELATED STOCKHOLDER MATTERS.
The information required by this Item will be set forth in the Proxy Statement and is incorporated herein by reference, under the captions “Securities Authorized for Issuance under Equity Compensation Plans” and “Certain Beneficial Owners.”
ITEM 13. CERTAIN RELATIONSHIPS AND RELATED TRANSACTIONS, AND DIRECTOR INDEPENDENCE.
The information required by this Item will be set forth in the Proxy Statement and is incorporated herein by reference, under the captions “Certain Relationships and Related Transactions,” and “Other Board Information—Director Independence.”
ITEM 14. PRINCIPAL ACCOUNTING FEES AND SERVICES.
The Information required under this Item will be included in the Proxy Statement and is incorporated herein by reference, under the caption “Ratification of Appointment of Independent Registered Public Accounting Firm.”
PART IV
ITEM 15. EXHIBITS, FINANCIAL STATEMENT SCHEDULES.
| | | | | |
| (a) | Documents filed as part of the Annual Report: |
| 1. | Financial Statements filed in Part II, Item 8 of this Annual Report: |
| Reports of Independent Registered Public Accounting Firm |
| Consolidated Balance Sheets as of December 30, 2021 and December 31, 2020 |
| Consolidated Statements of Operations and Comprehensive Income for the fiscal years ended December 30,2021, December 31, 2020, and December 26, 2019 |
| Consolidated Statements of Cash Flows for the fiscal years ended December 30,2021, December 31, 2020, and December 26, 2019 |
| Consolidated Statements of Changes in Stockholders’ Equity for the fiscal years ended December 30,2021, December 31, 2020, and December 26, 2019 |
| Notes to Consolidated Financial Statements |
| |
| 2. | Financial Statement Schedules: |
| There are no Financial Statement Schedules included with this filing for the reason that they are not applicable or are not required or the information is included in the financial statements or notes thereto |
| |
| 3. | Exhibits: |
| Exhibit No | |
| 3.1 | |
| 3.2 | |
| 4.1 | |
| 4.2 | |
| 4.3 | |
| 10.1 | |
| 10.2 | |
| 10.3 | |
| 10.4 | |
| 10.5 | |
| 10.6 | |
| 10.7 | |
| 10.8 | |
| 10.9 | |
| 10.10 | |
| 10.11 | |
| 10.12 | |
| 10.13 | |
| 10.14 | |
| 10.15 | |
| 10.16 | |
| 10.17 | |
| 10.18 | |
| | | | | |
| 10.19 | |
| 10.20 | |
| 10.21 | |
| 10.22 | |
| 10.23 | |
| 10.24 | |
| 10.25 | |
| 10.26 | |
| 10.27 | Amended and Restated Credit Agreement, dated as of September 30, 2016, by and among Floor and Decor Outlets of America, Inc., FDO Acquisition Corp., Wells Fargo Bank, National Association, as Administrative Agent, Collateral Agent and Swing Line Lender, Wells Fargo Bank, National Association, as Term Loan Agent, the lenders from time to time party thereto, Bank of America, N.A., as Syndication Agent, and Wells Fargo Bank, National Association and Merrill Lynch, Pierce and Fenner & Smith Incorporated, as Joint Lead Arrangers and Joint Bookrunners(4) |
| 10.28 | Amended and Restated Security Agreement, dated as of September 30, 2016, by and among Floor and Decor Outlets of America, Inc., the other borrowers and guarantors party thereto from time to time, Wells Fargo Bank, National Association, as Collateral Agent, and Wells Fargo Bank, National Association, as Administrative Agent(4) |
| 10.29 | Credit Agreement, dated as of September 30, 2016, by and among Floor and Decor Outlets of America, Inc., FDO Acquisition Corp., the lenders from time to time parties thereto, UBS AG, Stamford Branch, as Administrative Agent and Collateral Agent, and UBS Securities LLC, Merrill Lynch, Pierce, Fenner & Smith Incorporated, Barclays Bank PLC, Goldman Sachs Bank USA and Wells Fargo Securities LLC, as Joint Lead Arrangers and Joint Bookrunners(4) |
| 10.30 | |
| 10.31 | |
| 10.32 | Amendment No. 1 to Credit Agreement, dated as of March 31, 2017, by and among Floor and Decor Outlets of America, Inc., FDO Acquisition Corp., the other loan parties from time to time party thereto, the lenders from time to time party thereto, and UBS AG, Stamford Branch, as Administrative Agent and Collateral Agent(4) |
| 10.33 | Amendment No. 2 to Credit Agreement, dated as of November 22, 2017, by and among Floor and Decor Outlets of America, Inc., FDO Acquisition Corp., the other loan parties from time to time party thereto, the lenders from time to time party thereto, and UBS AG, Stamford Branch, as Administrative Agent and Collateral Agent(9) |
| 10.34 | Amendment No. 3 to Credit Agreement and Amendment No. 1 to Security Agreement, dated as of February 14, 2020, by and among Floor and Decor Outlets of America, Inc., FDO Acquisition Corp., FD Sales Company, LLC, the lenders from time to time parties thereto and UBS AG, Stamford Branch, as Administrative Agent and Collateral Agent (13) |
| 10.35 | Amendment No. 4 and Incremental Term Loan Agreement to Credit Agreement, dated as of May 18, 2020, by and among Floor and Decor Outlets of America, Inc., FDO Acquisition Corp., FD Sales Company, LLC, the lenders from time to time parties thereto and UBS AG, Stamford Branch, as Administrative Agent and Collateral Agent (14) |
| 10.36 | Amendment No. 5 and Incremental Term Loan Agreement to Credit Agreement, dated as of February 9, 2021, by and among Floor and Decor Outlets of America, Inc., FDO Acquisition Corp., FD Sales Company LLC, the lenders party thereto, UBS AG, Stamford Branch, as Administrative Agent and Collateral Agent and Golub Capital LLC, as Additional Initial Term Loan Arranger (15) |
| 10.37 | |
| 10.38 | |
| 21.1 | |
| 23.1 | |
| 31.1 | |
| 31.2 | |
| 32.1 | |
| 101.INS | XBRL Instance Document- the instance document does not appear in the Interactive Data File because its XBRL tags are embedded within the Inline XBRL document. |
| 101.SCH | Inline XBRL Taxonomy Extension Schema Document |
| 101.CAL | Inline XBRL Taxonomy Extension Calculation Linkbase Document |
| 101.DEF | Inline XBRL Taxonomy Extension Definition Linkbase Document |
| | | | | |
| 101.LAB | Inline XBRL Taxonomy Extension Label Linkbase Document |
| 101.PRE | Inline XBRL Taxonomy Extension Presentation Linkbase Document |
| 104 | Cover Page Interactive Data File- the cover page interactive data file does not appear in the Interactive Data File because its XBRL tags are embedded within the Inline XBRL document. |
# Denotes a management contract or compensatory plan or arrangement.
(1)Filed as an exhibit to Amendment No. 4 to the Registrant’s Registration Statement on Form S-1 (File No. 333-216000) filed with the SEC on April 24, 2017, and incorporated herein by reference.
(2)Filed as an exhibit to Amendment No. 3 to the Registrant’s Registration Statement on Form S-1 (File No. 333-216000) filed with the SEC on April 17, 2017, and incorporated herein by reference.
(3)Filed as an exhibit to the Registrant’s Form 8-K (File No. 001-38070) filed with the SEC on May 2, 2017, and incorporated herein by reference.
(4)Filed as an exhibit to Amendment No. 2 to the Registrant’s Registration Statement on Form S-1 (File No. 333-216000) filed with the SEC on April 7, 2017, and incorporated herein by reference.
(5)Filed as an exhibit to the Registrant’s Registration Statement on Form S-1 (File No. 333-221525) filed with the SEC on November 13, 2017, and incorporated herein by reference.
(6)Filed as Annex A to the Registrant’s Definitive Proxy Statement (File No. 001-38070), filed with the SEC on March 27, 2018, and incorporated herein by reference.
(7)Filed as Exhibit 99.2 to the Registrant’s Registration Statement on Form S-8 (File No. 333-225092), filed with the SEC on May 22, 2018, and incorporated herein by reference.
(8)Filed as Exhibit 10.1 to the Registrant’s Form 10-Q (File No. 001-38070) filed with the SEC on November 1, 2018, and incorporated herein by reference.
(9)Filed as Exhibit 10.23 to the Registrant’s Form 10-K (File No. 001-38070) filed with the SEC on March 5, 2018, and incorporated herein by reference.
(10)Filed as Exhibit 10.1 to the Registrant’s Form 10-Q (File No. 001-38070) filed with the SEC on May 2, 2019, and incorporated herein by reference.
(11)Filed as an exhibit to the Registrant’s Current Report on Form 8-K (File No. 001-38070) filed with the SEC on May 2, 2019, and incorporated herein by reference.
(12)Filed as an exhibit to the Registrant’s Current Report on Form 8-K (File No. 001-38070) filed with the SEC on February 4, 2020, and incorporated herein by reference.
(13)Filed as an exhibit to the Registrant’s Current Report on Form 8-K (File No. 001-38070) filed with the SEC on February 19, 2020, and incorporated herein by reference.
(14)Filed as an exhibit to the Registrant’s Current Report on Form 8-K (File No. 001-38070) filed with the SEC on May 18, 2020, and incorporated herein by reference.
(15)Filed as an exhibit to the Registrant’s Current Report on Form 8-K (File No. 001-38070) filed with the SEC on February 9, 2021, and incorporated herein by reference.
(16)Filed as an exhibit to the Registrant’s Form 10-Q (File No. 001-38070) filed with the SEC on April 30, 2020, and incorporated herein by reference.
ITEM 16. FORM 10-K SUMMARY
None.
SIGNATURES
Pursuant to the requirements of Section 13 or 15(d) of the Securities Exchange Act of 1934, the registrant has duly caused this report to be signed on its behalf by the undersigned, thereunto duly authorized.
| | | | | |
| FLOOR & DECOR HOLDINGS, INC. |
| |
| Date: February 24, 2022 | /s/ Thomas V. Taylor |
| Thomas V. Taylor Chief Executive Officer |
Pursuant to the requirements of the Securities Exchange Act of 1934, this report has been signed below by the following persons on behalf of the Company and in the capacities indicated on February 24, 2022.
| | | | | | | | | | | | | | |
| Signature | | Title | | Date |
| | | | |
| /s/ Thomas V. Taylor | | Chief Executive Officer (Principal Executive Officer) and Director | | February 24, 2022 |
| Thomas V. Taylor | | |
| | | | |
| /s/ Trevor S. Lang | | Executive Vice President and Chief Financial Officer (Principal Financial and Accounting Officer) | | February 24, 2022 |
| Trevor S. Lang | | |
| | | | |
| /s/ Norman H. Axelrod | | Chairman of the Board | | February 24, 2022 |
| Norman H. Axelrod | | |
| | | | |
| /s/ George Vincent West | | Vice Chairman of the Board | | February 24, 2022 |
| George Vincent West | | |
| | | | |
| /s/ William T. Giles | | Director | | February 24, 2022 |
| William T. Giles | | |
| | | | |
| /s/ Dwight L. James | | Director | | February 24, 2022 |
| Dwight L. James | | |
| | | | |
| /s/ Ryan R. Marshall | | Director | | February 24, 2022 |
| Ryan R. Marshall | | |
| | | | |
| /s/ Kamy Scarlett | | Director | | February 24, 2022 |
| Kamy Scarlett | | |
| | | | |
| /s/ Peter M. Starrett | | Director | | February 24, 2022 |
| Peter M. Starrett | | |
| | | | |
| /s/ Richard L. Sullivan | | Director | | February 24, 2022 |
| Richard L. Sullivan | | |
| | | | |
| /s/ Felicia D. Thornton | | Director | | February 24, 2022 |
| Felicia D. Thornton | | |
| | | | |
| /s/ Charles D. Young | | Director | | February 24, 2022 |
| Charles D. Young | | |