Use these links to rapidly review the document
TABLE OF CONTENTS
TABLE OF CONTENTS 2
As filed with the Securities and Exchange Commission on March 20, 2017
Registration No. 333-216000
UNITED STATES
SECURITIES AND EXCHANGE COMMISSION
Washington, D.C. 20549
AMENDMENT NO. 1
TO
FORM S-1
REGISTRATION STATEMENT
UNDER
THE SECURITIES ACT OF 1933
FDO Holdings, Inc.*
(Exact name of registrant as specified in its charter)
| Delaware (State or other jurisdiction of incorporation or organization) |
5211 (Primary Standard Industrial Classification Code Number) |
27-3730271 (I.R.S. Employer Identification Number) |
2233 Lake Park Drive
Smyrna, Georgia 30080
(404) 471-1634
(Address, including zip code, and telephone number, including area code, of registrant's principal executive offices)
Trevor S. Lang
Executive Vice President and Chief Financial Officer
FDO Holdings, Inc.
2233 Lake Park Drive
Smyrna, Georgia 30080
(404) 471-1634
(Name, address, including zip code, and telephone number, including area code, of agent for service)
| Copies to: | ||||
Monica Shilling, Esq. Proskauer Rose LLP 2049 Century Park East, Suite 3200 Los Angeles, CA 90067 Tel (310) 557-2900 Fax (310) 557-2193 |
David V. Christopherson, Esq. Senior Vice President, Secretary and General Counsel FDO Holdings, Inc. 2233 Lake Park Drive Smyrna, GA 30080 Tel (404) 471-1634 Fax (404) 393-3540 |
Marc D. Jaffe, Esq. Ian D. Schuman, Esq. Stelios G. Saffos, Esq. Latham & Watkins LLP 885 Third Avenue New York, NY 10022 Tel (212) 906-1297 Fax (212) 751-4864 |
||
Approximate date of commencement of proposed sale to the public:
As soon as practicable after the effective date of this Registration Statement.
If any of the securities being registered on this Form are to be offered on a delayed or continuous basis pursuant to Rule 415 under the Securities Act of 1933, check the following box. o
If this Form is filed to register additional securities for an offering pursuant to Rule 462(b) under the Securities Act, please check the following box and list the Securities Act registration statement number of the earlier effective registration statement for the same offering. o
If this Form is a post-effective amendment filed pursuant to Rule 462(c) under the Securities Act, check the following box and list the Securities Act registration statement number of the earlier effective registration statement for the same offering. o
If this Form is a post-effective amendment filed pursuant to Rule 462(d) under the Securities Act, check the following box and list the Securities Act registration statement number of the earlier effective registration statement for the same offering. o
Indicate by check mark whether the registrant is a large accelerated filer, an accelerated filer, a non-accelerated filer, or a smaller reporting company. See the definitions of "large accelerated filer," "accelerated filer" and "smaller reporting company" in Rule 12b-2 of the Exchange Act. (Check one):
| Large accelerated filer o | Accelerated filer o | Non-accelerated filer ý (Do not check if a smaller reporting company) |
Smaller reporting company o |
CALCULATION OF REGISTRATION FEE
|
||||
| Title of Each Class of Securities to be Registered |
Proposed Maximum Aggregate Offering Price(1)(2) |
Amount of Registration Fee(3)(4) |
||
|---|---|---|---|---|
Class A Common Stock, $0.001 par value per share |
$150,000,000 | $17,385 | ||
|
||||
The Registrant hereby amends this Registration Statement on such date or dates as may be necessary to delay its effective date until the Registrant shall file a further amendment which specifically states that this Registration Statement shall thereafter become effective in accordance with Section 8(a) of the Securities Act of 1933 or until the Registration Statement shall become effective on such date as the Commission, acting pursuant to said Section 8(a), may determine.


You should rely only on the information contained in this prospectus or in any free writing prospectus that we authorize to be distributed to you. Neither we nor the underwriters have authorized anyone to provide any information or to make any representations other than those contained in this prospectus or in any free writing prospectuses we have prepared. We and the underwriters take no responsibility for, and can provide no assurance as to the reliability of, any other information that others may give you. This prospectus is an offer to sell only the shares of Class A common stock offered hereby, but only under circumstances and in jurisdictions where it is lawful to do so. You should assume that the information appearing in this prospectus is accurate only as of the date on the front cover of this prospectus and the information in any free writing prospectus that we may provide you in connection with this offering is accurate only as of the date of such free writing prospectus.
Persons who come into possession of this prospectus and any such free writing prospectus in jurisdictions outside the United States are required to inform themselves about and to observe any restrictions as to this offering and the distribution of this prospectus and any such free writing prospectus applicable to that jurisdiction.
i
This prospectus includes our trademarks and trade names, including Floor & Decor and our logo, which are protected under applicable intellectual property laws and are the property of our wholly owned subsidiary, Floor and Decor Outlets of America, Inc., a Delaware corporation ("F&D"). This prospectus also contains trademarks, service marks, trade names and copyrights of other companies, which are the property of their respective owners. Solely for convenience, trademarks, service marks and trade names referred to in this prospectus may appear without the ® or TM symbols. We do not intend our use or display of other parties' trademarks, service marks or trade names to imply, and such use or display should not be construed to imply, a relationship with, or endorsement or sponsorship of us by, these other parties.
ii
This summary highlights the information contained elsewhere in this prospectus. This summary does not contain all of the information that you should consider before investing in our Class A common stock. You should read this entire prospectus carefully, including the sections entitled "Risk Factors" and "Management's Discussion and Analysis of Financial Condition and Results of Operations" and our consolidated financial statements and related notes, before making an investment decision. Some of the statements in this summary constitute forward-looking statements. See "Special Note Regarding Forward-Looking Statements."
Prior to the effectiveness of the registration statement of which this prospectus is a part, we were renamed Floor & Decor Holdings, Inc. Except where the context suggests otherwise, the terms "Floor & Decor Holdings, Inc.," "Floor & Decor," the "Company," "we," "us," and "our" refer to Floor & Decor Holdings, Inc., a Delaware corporation formerly known as "FDO Holdings, Inc.," together with its consolidated subsidiaries. Because our Class C common stock generally has identical rights to our Class A common stock (except that Class C common stock is non-voting) and converts into our Class A common stock on a one-to-one basis under certain circumstances, we generally refer to our Class A common stock and Class C common stock collectively herein as our "common stock." Unless indicated otherwise, the information in this prospectus (i) has been adjusted to give effect to a -for-one stock split of our common stock to be effected prior to the consummation of this offering, (ii) assumes that all shares of our Class B common stock are automatically converted on a one-to-one basis into shares of our Class A common stock upon the consummation of this offering pursuant to our restated certificate of incorporation (our "certificate of incorporation") and (iii) assumes the underwriters will not exercise their option to purchase up to an additional shares of our Class A common stock.
Our Company
Founded in 2000, Floor & Decor is a high-growth, differentiated, multi-channel specialty retailer of hard surface flooring and related accessories with 72 warehouse-format stores across 17 states. We believe that we offer the industry's broadest in-stock assortment of tile, wood, laminate and natural stone flooring along with decorative and installation accessories at everyday low prices positioning us as the one-stop destination for our customers' entire hard surface flooring needs.
We appeal to a variety of customers, including professional installers and commercial businesses ("Pro"), Do it Yourself customers ("DIY") and customers who buy the products for professional installation ("Buy it Yourself" or "BIY"). Our Pro customers are loyal, shop often and help promote our brand. The combination of our category and product breadth, low prices, in-stock inventory in project-ready quantities, proprietary credit offerings, free storage options and dedicated customer service positions us to gain share in the attractive Pro customer segment. We believe our DIY customers spend significant time planning their projects while conducting extensive research in advance. We provide our customers with the education and inspiration they need before making a purchase through our differentiated online and in-store experience.
Our warehouse-format stores, which average approximately 72,000 square feet, are typically larger than any of our specialty retail flooring competitors' stores. Other large format home improvement retailers only allocate a small percentage of their floor space to hard surface flooring and accessories. When our customers walk into a Floor & Decor store for the first time, we believe they are amazed by our visual presentation, our store size, our everyday low prices and the breadth and depth of our merchandise. Our stores are easy to navigate and designed to interactively showcase the wide array of designs and product styles a customer can create with our flooring and decorative accessories. We engage our customers both through our trained store associates and designers who can assist in narrowing choices and making the process of home renovation easier, as well as our staff dedicated to serving Pro customers. In addition to our stores, our website FloorandDecor.com showcases
1
our products, offers informational training and design ideas and has our products available for sale, which a customer can pick up in-store or have delivered. Our ability to purchase directly from manufacturers through our direct sourcing model enables us to be fast to market with a balanced assortment of bestseller and unique, hard to find items that are the latest trend-right products. Based on these characteristics, we believe Floor & Decor is redefining and expanding the addressable market size of the hard surface flooring category and that we have an opportunity to significantly expand our store base to approximately 400 stores nationwide within the next 15 years, as described in more detail below.
Over the last five years, we have invested significant resources across our business and infrastructure to support innovation and growth. We believe that these investments will continue to strengthen our customer value proposition and further differentiate Floor & Decor from our competition, positioning us for continued market share gains. We have made significant investments in product innovation across all categories, improving our assortment and seeking to provide more value to our Pro, DIY and BIY customers. We have also invested in technology and personnel to support our stores. From fiscal 2011 to fiscal 2014, our general and administrative expenses and capital expenditures grew at a rate exceeding our net sales growth. We believe that these investments have enabled us to drive successful, scalable growth, as demonstrated by the doubling of our average net sales per store between fiscal 2011 and fiscal 2016 (for all stores open prior to fiscal 2011). We believe that our investment in our business will continue to improve our customer value proposition, differentiating us and strengthening our competitive advantage.
We believe our strong financial results are a reflection of our consistent and disciplined culture of innovation and reinvestment, creating a differentiated business model in the hard surface flooring category, as evidenced by the following:
2
net income to Adjusted EBITDA, see Note 8 to the information contained in "—Summary Consolidated Financial and Other Data."
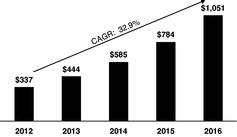
| Net Sales (in millions) |
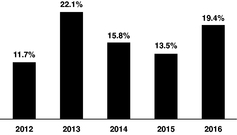
Comparable Store Sales Growth |
|
|---|---|---|
|
|
Our Competitive Strengths
We believe our strengths, described below, set us apart from our competitors and are the key drivers of our success.
Unparalleled Customer Value Proposition. Our customer value proposition is a critical driver of our business. The key components include:
Differentiated Assortment Across a Wide Variety of Hard Surface Flooring Categories. Our stores are generally larger than those of our specialty retail flooring competitors, and we allocate substantially more square footage to hard surface flooring and accessories than large home improvement retailers. We believe we have the most comprehensive in-stock, trend-right product assortment in the industry within our categories with on average approximately 3,500 stock keeping units ("SKUs") in each store. Additionally, we customize our product assortment at the store level for the regional preferences of each market. We have an ongoing product line review process across all categories that allows us to identify and interpret emerging trends in hard surface flooring. We work with our suppliers to quickly introduce new products and styles in our stores. We appeal to a wide range of customers through our "good/better/best" merchandise selection, as well as through our broad range of product styles from classic to modern, as well as new trend-right products. We consistently innovate with proprietary brands and products that appeal to certain customers with over 50 proprietary brands, including AquaGuard® and NuCore®.
Low Prices. We provide everyday low prices in the retail hard surface flooring market. Our merchandising and individual store teams competitively shop each market so that we can offer our flooring products and related accessories at low prices. We also work with our vendors to identify and create new, affordable products in categories traditionally considered high-end to further democratize hard surface flooring by providing a greater number of options to a larger customer base. We believe we are unique in our industry in employing an "everyday low price" strategy, where we strive to offer our products at consistently everyday low prices throughout the year instead of engaging in frequent promotional activities. Our ability to provide these low prices is supported by our direct sourcing model, which strives to eliminate third-party intermediaries and shortens time to market. We believe this strategy creates trust with our Pro, DIY and BIY customers because they consistently receive low prices at Floor & Decor without having to wait for a sale or negotiate to obtain the lowest price.
3
One-Stop Project Destination with Immediate Availability. Our large in-stock assortment, including decorative and installation accessories, differentiates us from our competitors. Our stores stock job-size quantities to immediately fulfill a customer's entire flooring project. On average, each warehouse-format store carries approximately 3,500 SKUs, which equates to 1.3 million square feet of flooring products or $2.5 million of inventory at cost. Customers also have access to all of our inventory for in-store pick up or delivery through FloorandDecor.com.
Unique and Inspiring Shopping Environment. Our stores average approximately 72,000 square feet and are typically designed with warehouse features, including high ceilings, clear signage, bright lighting and industrial racking and are staffed with knowledgeable store associates. We offer an easy-to-navigate store layout with clear lines of sight and departments organized by our major product categories of tile, wood, laminate, natural stone, decorative accessories and installation accessories. We believe our unique signage, which clearly displays individual product features and benefits, improves the ease of shopping and facilitates customer decision making. We encourage customers to interact with our merchandise, to experiment with potential designs and to see the actual product they will purchase, an experience that is not possible in flooring stores that do not carry in-stock inventory in project-ready quantities. The majority of our stores have design centers that showcase project ideas to further inspire our customers, and we employ experienced designers in all of our stores to provide free design consulting. Additionally, we provide a robust online experience for potential customers on FloorandDecor.com. We believe inspiring and educating customers within our stores and on our website provides us with a significant competitive advantage in serving our customers.
Extensive Service Offering to Enhance the Pro Customer Experience. Our focus on meeting the unique needs of the Pro customer, and by extension the BIY customer, drives our estimated sales mix of approximately 60% Pro and BIY customers, which we believe represents a higher percentage than our competitors. We provide an efficient one-stop shopping experience for our Pro customers, offering low prices on a broad selection of high-quality flooring products, deep inventory levels to support immediate availability of our products, modest financial credit, free storage for purchased inventory, the convenience of early store hours and, in most stores, separate entrances for merchandise pick-up. Additionally, each store has a dedicated Pro sales force with technology to service our Pro customer more efficiently, and we have rolled out Pro Zones, which are areas offering a variety of services to Pro customers, in a majority of our stores. We believe by serving the needs of Pro customers, we drive repeat and high-ticket purchases, customer referrals and brand awareness from this attractive and loyal customer segment.
Decentralized Culture with an Experienced Store-Level Team and Emphasis on Training. We have a decentralized culture that empowers managers at the store and regional levels to make key decisions to maximize the customer experience. Our store managers, who carry the title Chief Executive Merchant, have significant flexibility to customize product mix, pricing, marketing, merchandising, visual displays and other elements in consultation with their regional leaders. We tailor the merchandising assortment for each of our stores for local market preferences, which we believe differentiates us from our national competitors that tend to have standard assortments across markets. Throughout the year, we train all of our employees on a variety of topics, including product knowledge, leadership and store operations. We have made important investments in the training and development of our people, including the creation of a full time training department. Approximately 70% of our new store management positions are filled through internal promotions. We also have incentive compensation programs for all employees, regardless of position or title. We believe our decentralized culture and coordinated training foster an organization aligned around providing a superior customer experience, ultimately contributing to higher net sales and profitability.
4
Sophisticated, Global Supply Chain. Our merchandising team has developed direct sourcing relationships with manufacturers and quarries in over 18 countries. We currently source our products from more than 180 vendors worldwide and have developed long-term relationships with many of them. We often collaborate with our vendors to design and manufacture products for us to address emerging customer preferences that we observe in our stores and markets. We procure the majority of our products directly from the manufacturers, which eliminates additional costs from exporters, importers, wholesalers and distributors. We believe direct sourcing is a key competitive advantage, as many of our specialty retail flooring competitors are too small to have the scale or the resources to work directly with suppliers. Over the past several years, we have established a Global Sourcing and Compliance Department to, among other things, enhance our policies and procedures to address compliance with appropriate regulatory bodies, including compliance with the requirements of the Lacey Act of 1900 (as amended, the "Lacey Act"), the California Air Resources Board ("CARB") and the Environmental Protection Agency ("EPA"). We also utilize third-party consultants for audits, testing and surveillance to ensure product safety and compliance. Additionally, we have invested in technology and personnel to collaborate throughout the entire supply chain process to support our direct sourcing model, which has improved our ability to find, manage and source trend-right merchandise quickly and at lower costs, allowing us to offer products at low prices while maintaining attractive gross margins.
Highly Experienced Management Team with Proven Track Record. Led by our Chief Executive Officer, Tom Taylor, our management team brings substantial expertise from leading retailers and other companies across core functions, including store operations, merchandising, marketing, real estate, e-commerce, supply chain management, finance, legal and information technology. Tom Taylor, who joined us in 2012, spent 23 years at The Home Depot, where he most recently served as Executive Vice President of Merchandising and Marketing with responsibility for all stores in the United States and Mexico. Our Executive Vice President and Chief Merchandising Officer, Lisa Laube, has over 30 years of merchandising and leadership experience with leading specialty retailers, including most recently as President of Party City. Our Executive Vice President and Chief Financial Officer, Trevor Lang, brings more than 20 years of accounting and finance experience, including 17 years of Chief Financial Officer and Vice President of Finance experience at public companies, including most recently as the Chief Financial Officer and Chief Administrative Officer of Zumiez Inc.
Our Growth Strategy
We expect to continue to drive our strong net sales and profit growth through the following strategies:
Open Stores in New and Existing Markets. We believe there is an opportunity to significantly expand our store base in the United States from 72 warehouse-format stores currently to approximately 400 stores nationwide over the next 15 years based on our internal research with respect to housing density, demographic data, competitor concentration and other variables in both new and existing markets. We plan to target new store openings in both existing and new, adjacent and underserved markets. We have a disciplined approach to new store development, based on an analytical, research-driven site selection method and a rigorous real estate approval process. We believe our new store model delivers strong financial results and returns on investment, targeting net sales on average of $10 million to $13 million and positive four-wall Adjusted EBITDA (as defined below) in the first year, pre-tax payback (as defined below) in two to three years and cash-on-cash returns (as defined below) of greater than 50% in the third year. On average, our stores opened after 2011 have exceeded this model. Over the past several years, we have made significant investments in personnel, information technology, warehouse infrastructure and connected customer strategies to support our current growth and the expansion of our stores. We intend to grow our store base by approximately 20% annually over the next several years. The performance of our new stores opened over the last three years, the performance of our older stores over that same time frame, our disciplined real estate strategy and the
5
track record of our management team in successfully opening retail stores support our belief in the significant store expansion opportunity.
Increase Comparable Store Sales. We expect to grow our comparable store sales by continuing to offer our customers a dynamic and expanding selection of compelling, value-priced hard surface flooring and accessories while maintaining strong service standards for our customers. We regularly introduce new products into our assortment through our category product line review process, including collaboration with our vendors to bring to market innovative products such as water-resistant laminates. Because almost half of our stores have been opened for less than three years, we believe they will continue to drive comparable store sales growth as they ramp to maturity. While our newer stores generally have higher comparable store sales growth, our stores opened prior to 2012 averaged comparable store sales growth of 15.5% for fiscal 2016. We believe that we can continue to enhance our customer experience by focusing on service, optimizing sales and marketing strategies, investing in store staff and infrastructure, remodeling existing stores and improving visual merchandising and the overall aesthetic appeal of our stores. We also believe that growing our proprietary credit offering, further integrating connected customer strategies and enhancing other key information technology, will contribute to increased comparable store sales. As we increase awareness of Floor & Decor's brand, we believe there is a significant opportunity to gain additional market share, especially from independent flooring retailers and large format home improvement retailers. We are also adding adjacent categories that align with flooring projects like frameless glass in the bathroom and customized countertops for the kitchen. We believe the combination of these initiatives plus the expected growth of the hard surface flooring category described in more detail under "Our Industry" below will continue to drive strong comparable store sales growth.
Continue to Invest in the Pro Customer. We believe our differentiated focus on Pro customers has created a competitive advantage for us and will continue to drive our net sales growth. We will invest in gaining and retaining Pro customers due to their frequent and high-ticket purchases, loyalty and propensity to refer other potential customers. We have made important investments in the Pro services regional team to better recruit and train the Pro services team in each store, new technology such as integrated customer relationship management ("CRM") software to help us further penetrate and grow our Pro business, dedicated phone lines for our Pro customers to call and text, commercial credit and open account terms, jobsite delivery, a dedicated website for Pro customers, training on technical flooring installation solutions, and tools to facilitate large commercial jobs sourced throughout the store. We plan to further invest in initiatives to increase speed of service, improve financing solutions, leverage technology, elevate our Pro branding, dedicate additional store and regional staffing to support Pro customers and enhance the in-store experience for our Pro customers. We have implemented a "Pro Zone" in a majority of our stores that focuses on the specific needs of the Pro customer. Building on our success in serving the Pro customer, in 2016 we entered the adjacent commercial sales channel, thus increasing the size of the addressable market we serve. Our commercial effort, which we have branded F&D Commercial, initially targets corporate customers with large flooring needs across the hospitality, multi-family and retail sectors. We believe Pro customers will continue to be an integral part of our sales growth, and the commercial channel will provide incremental revenue and profit opportunities in the future.
Expand Our "Connected Customer" Experience. Floor & Decor's online experience allows our Pro, BIY and DIY customers to explore our product selection and design ideas before and after visiting our stores and offers the convenience of making online purchases for delivery or pick up in-store. We believe our online platform reflects our brand attributes and provides a powerful tool to educate, inspire and engage our consumers, and we view our website and multi-channel strategies as leading our brand. Our research indicates that 71% of our shoppers have visited our website. We continuously invest in our connected customer strategies to improve how our customers experience our brand. For example, we regularly update our website, which provides our customers with inspirational
6
vignettes, videos, products and education. Additional initiatives include: (i) implementing our new CRM to obtain a single view of our customers, (ii) developing personalized content based on location, purchase and browsing history, (iii) developing more relevant content and improved search and purchasing tools to help customers add decorative and installation accessories, (iv) creating frequently asked questions to help customers choose the best product for their jobs and (v) implementing online scheduling tools to access our designers. While the hard surface flooring category has a relatively low penetration of e-commerce sales due to the nature of the product, we believe our connected customer presence represents an attractive growth opportunity to drive consumers to Floor & Decor.
Enhance Margins Through Increased Operating Leverage. Since 2011, we have invested significantly in our sourcing and distribution network, integrated IT systems and corporate overhead to support our growth. We expect to leverage these investments as we grow our net sales. Additionally, we believe operating margin improvement opportunities will include enhanced product sourcing processes and overall leveraging of our store-level fixed costs, existing infrastructure, supply chain, corporate overhead and other fixed costs resulting from increased sales productivity. We anticipate that the planned expansion of our store base and growth in comparable store sales will also support increasing economies of scale.
Selected Risks
In considering our competitive strengths, our growth strategy and an investment in our common stock, you should carefully consider the risks highlighted in the section entitled "Risk Factors" following this prospectus summary. In particular, we face the following challenges:
7
For information regarding how our leverage affects our business, financial condition and operating results, see "Management's Discussion and Analysis of Financial Condition and Results of Operations—Liquidity and Capital Resources."
Our Industry
Floor & Decor operates in the large, growing and highly fragmented $10 billion hard surface flooring market (in manufacturers' dollars), which is part of the larger $20 billion U.S. floor coverings market (in manufacturers' dollars) based on a 2016 study by Catalina Research, Inc., a leading provider of market research for the floor coverings industry (the "Catalina Floor Coverings Report"). We estimate that after the retail markup, we represent only approximately 5% of an estimated $17 billion market. The competitive landscape of the hard surface flooring market includes big-box home improvement centers, national and regional specialty flooring retailers, and independent flooring retailers. We believe we benefit from growth in the overall hard surface flooring market, which, based on the Catalina Floor Coverings Report, grew on average 8% per year from 2012 to 2016 and is estimated to grow on average 5% per year from 2017 through 2021. We believe that growth in the hard surface flooring market has been and will continue to be driven by home remodeling demand drivers such as the aging household inventory, millennials forming households, existing home sales and the secular shift from carpet to hard surface flooring. In addition, we believe we have an opportunity to increase our market share as our competitors are unable to compete on our combination of price, service and in-stock assortment.
For more than a decade, hard surface flooring has consistently taken share from carpet as a percentage of the total floor coverings market, increasing from 39% of the market in 2002 to 51% in 2015 based on the Catalina Floor Coverings Report. Historically, mix shift towards hard surface flooring has been driven by product innovation, changing consumer preferences, better hygiene qualities, increasing ease of installation and higher durability. Product innovation, which has been aided by the increasing use of technology such as inkjet tile printing, waterproof wood-look flooring and water-resistant laminates, and non-traditional uses of hard surface flooring including walls, fireplaces and patios have increased the size of the hard surface flooring market and has allowed us to better serve customer needs.
Concurrent Transactions—Common Stock Changes
In connection with this offering:
We refer to these changes herein as the "Common Stock Changes." All shares of Class A common stock offered to the public pursuant to this prospectus will be entitled to one vote per share
8
and no other class of common stock is entitled to any votes per share. See "Description of Capital Stock" for more information.
Our Sponsors
Upon the closing of this offering, Ares Corporate Opportunities Fund III, L.P. ("Ares"), a fund affiliated with Ares Management, L.P. ("Ares Management"), will beneficially own, in the aggregate, approximately % of our outstanding Class A common stock and FS Equity Partners VI, L.P. and FS Affiliates VI, L.P., funds affiliated with Freeman Spogli Management Co., L.P. (collectively "Freeman Spogli" or "Freeman Spogli & Co." and together with Ares, our "Sponsors"), will beneficially own, in the aggregate, approximately % of our outstanding Class A common stock and 100% of our outstanding Class C common stock. These amounts compare to approximately % of our outstanding Class A common stock represented by the shares sold by us in this offering, assuming no exercise of the underwriters' option to purchase additional shares. As a result, these stockholders acting together, or Ares or Freeman Spogli acting alone, will be able to exercise significant influence over all matters requiring stockholder approval, including the election of directors and approval of significant corporate transactions, such as a merger or other sale of us or our assets. Also, our Sponsors may acquire or hold interests in businesses that compete directly with us, or may pursue acquisition opportunities that are complementary to our business, making such acquisitions unavailable to us. The Investor Rights Agreement (as defined in "Certain Relationships and Related Party Transactions") also contains agreements among our Sponsors with respect to voting on the election of directors and board committee membership. See "Risk Factors—Risks Related to this Offering and Ownership of Our Common Stock—Our principal stockholders will continue to have substantial control over us after this offering, will be able to influence corporate matters and may take actions that conflict with your interest and have the effect of delaying or preventing changes of control or changes in management, or limiting the ability of other stockholders to approve transactions they deem to be in their best interest."
Ares Management
Ares Management is a leading global alternative asset manager with approximately $95.3 billion of assets under management and approximately 930 employees in over 15 offices in the United States, Europe, Asia and Australia as of December 31, 2016. Since its inception in 1997, Ares Management has adhered to a disciplined investment philosophy that focuses on delivering strong risk-adjusted investment returns throughout market cycles. Ares Management believes each of its three distinct but complementary investment groups in Private Equity, Credit and Real Estate is a market leader based on assets under management and investment performance. Ares Management was built upon the fundamental principle that each group benefits from being part of the broader platform.
The Private Equity Group has approximately $25.0 billion of assets under management as of December 31, 2016, targeting investments in high quality franchises across multiple industries. In the consumer/retail sector, selected current investments include 99 Cents Only Stores LLC, Smart & Final Stores, Inc., Guitar Center Holdings, Inc., Neiman Marcus Group, Inc., Farrow & Ball Ltd., National Veterinary Associates, Inc., Aspen Dental Management, Inc. and the parent company of Serta International and Simmons Bedding Company. Selected prior investments include GNC Holdings, Inc., House of Blues Entertainment, LLC, Maidenform Brands, Inc. and Samsonite Corporation.
Freeman Spogli & Co.
Freeman Spogli & Co. is a private equity firm dedicated exclusively to investing and partnering with management in consumer and distribution companies in the United States. Since its founding in 1983, Freeman Spogli & Co. has invested $3.8 billion of equity in 56 portfolio companies with aggregate transaction values of $22 billion.
9
Corporate and Other Information
Prior to the effectiveness of the registration statement of which this prospectus is a part, we will be renamed Floor & Decor Holdings, Inc. Our principal executive offices are located at 2233 Lake Park Drive, Smyrna, GA 30080, and our telephone number is (404) 471-1634. Our website address is www.FloorandDecor.com. The information contained on our website is not incorporated by reference into this prospectus, and you should not consider any information contained on, or that can be accessed through, our website as part of this prospectus or in deciding whether to purchase our common stock.
10
Class A common stock offered by us |
shares (plus up to an additional shares of our Class A common stock that we may issue and sell upon the exercise of the underwriters' option to purchase additional shares). | |
Option to purchase additional shares of Class A common stock |
The underwriters have the option for 30 days following the date of this prospectus to purchase up to an additional shares of Class A common stock from us at the initial public offering price less the underwriting discount. |
|
Common stock to be outstanding after this offering |
shares (including shares of Class C common stock). |
|
Voting rights |
Each holder of our Class A common stock is entitled to one vote for each share of Class A common stock held on all matters submitted to a vote of stockholders. Holders of our Class C common stock are not entitled to vote on such matters, except as required under Delaware law. Our stockholders do not have cumulative voting rights. |
|
Use of proceeds |
We estimate that the net proceeds we will receive from selling common stock in this offering will be approximately , after deducting the underwriting discount and estimated offering expenses payable by us (or, if the underwriters exercise their option to purchase additional shares of Class A common stock in full, approximately , after deducting the underwriting discount and estimated offering expenses payable by us), based on an assumed public offering price of $ per share, the midpoint of the price range set forth on the cover page of this prospectus. |
|
|
We intend to use all of the net proceeds of this offering to repay a portion of the amounts outstanding under our $350.0 million senior secured term loan facility maturing on September 30, 2023 the ("Term Loan Facility"), including accrued and unpaid interest. |
|
|
Any amounts repaid under the Term Loan Facility will not be available for future borrowing following repayment. See "Use of Proceeds." |
|
Reserved share program |
The underwriters have reserved up to of the shares of Class A common stock being offered by this prospectus for sale, at the initial public offering price, to our directors, officers, employees and other parties related to us. The sales will be made by Merrill Lynch, Pierce, Fenner & Smith Incorporated through a reserved share program. We do not know if these persons will elect to purchase all or any portion of these reserved shares, but any purchases they do make will reduce the number of shares available for sale to the general public. Any reserved shares not purchased will be offered by the underwriters to the general public on the same terms as the other shares of our Class A common stock. |
11
Dividend policy |
We currently intend to retain all available funds and any future earnings for use in the operation and growth of our business, and therefore we do not currently expect to pay any cash dividends on our common stock. Any future determination to pay dividends will be at the discretion of our board of directors and will depend on then existing conditions, including our operating results, financial condition, contractual restrictions, capital requirements, business prospects and other factors that our board of directors may deem relevant. In addition, our Credit Facilities (as defined below) contain covenants that restrict our ability to pay cash dividends. See "Dividend Policy." |
|
Risk factors |
Investing in shares of our common stock involves a high degree of risk. See "Risk Factors" beginning on page 20 and the other information included in this prospectus for a discussion of factors you should carefully consider before deciding to invest in our Class A common stock. |
|
Proposed New York Stock Exchange trading symbol |
"FND" |
Unless otherwise indicated, all information in this prospectus:
The number of shares of common stock to be outstanding after this offering is based on shares of our common stock outstanding immediately prior to the closing of this offering, and excludes the following:
12
Summary Consolidated Financial and Other Data
The following tables summarize our financial data as of the dates and for the periods indicated. We operate on a 52- or 53-week fiscal year ending on the Thursday on or preceding December 31. When a 53-week fiscal year occurs, we report the additional week in the fiscal fourth quarter. Fiscal 2012, fiscal 2013, fiscal 2014 and fiscal 2016 included 52 weeks and ended on December 27, 2012 ("fiscal 2012"), December 26, 2013 ("fiscal 2013"), December 25, 2014 ("fiscal 2014") and December 29, 2016 ("fiscal 2016"), respectively. Fiscal 2015 was comprised of 53 weeks and ended on December 31, 2015 ("fiscal 2015"). Fiscal 2017 will include 52 weeks and will end on December 28, 2017 ("fiscal 2017"). The summary historical consolidated statements of operations data for fiscal 2014, 2015 and 2016 and the related summary balance sheet data as of fiscal 2015 and 2016 year end, have been derived from our audited consolidated financial statements and related notes contained elsewhere in this prospectus. The summary historical consolidated statement of operations data for fiscal 2012 and 2013 and the summary balance sheet data as of fiscal 2012, 2013 and 2014 year end have been derived from our audited consolidated financial statements not included in this prospectus. Historical results are not indicative of the results to be expected in the future.
You should read the following information together with the more detailed information contained in "Capitalization," "Selected Consolidated Financial Data," "Management's Discussion and Analysis of Financial Condition and Results of Operations" and our consolidated financial statements and the accompanying notes appearing elsewhere in this prospectus.
13
| |
Fiscal year ended | |||||||||||||||
|---|---|---|---|---|---|---|---|---|---|---|---|---|---|---|---|---|
(in thousands, except share and per share amounts)
|
12/27/2012 | 12/26/2013 | 12/25/2014 | 12/31/2015(1) | 12/29/2016 | |||||||||||
Net sales |
$ | 336,745 | $ | 443,995 | $ | 584,588 | $ | 784,012 | $ | 1,050,759 | ||||||
Cost of sales |
202,651 | 274,172 | 355,051 | 471,390 | 621,497 | |||||||||||
| | | | | | | | | | | | | | | | | |
Gross profit |
134,094 | 169,823 | 229,537 | 312,622 | 429,262 | |||||||||||
Selling & store operating expenses |
85,932 | 106,835 | 146,485 | 202,637 | 271,876 | |||||||||||
General & administrative expenses |
20,571 | 30,530 | 38,984 | 49,917 | 64,025 | |||||||||||
Pre-opening expenses |
1,544 | 5,196 | 7,412 | 7,380 | 13,732 | |||||||||||
Litigation settlement |
— | — | — | — | 10,500 | |||||||||||
Executive severance(2) |
— | — | 2,975 | 296 | — | |||||||||||
Casualty gain(3) |
(1,421 | ) | — | — | — | — | ||||||||||
| | | | | | | | | | | | | | | | | |
Operating income |
27,468 | 27,262 | 33,681 | 52,392 | 69,129 | |||||||||||
Interest expense |
6,528 | 7,684 | 8,949 | 9,386 | 12,803 | |||||||||||
Loss on early extinguishment of debt |
— | 1,638 | — | — | 1,813 | |||||||||||
| | | | | | | | | | | | | | | | | |
Income before income taxes |
20,940 | 17,940 | 24,732 | 43,006 | 54,513 | |||||||||||
Provision for income taxes |
8,102 | 6,857 | 9,634 | 16,199 | 11,474 | |||||||||||
| | | | | | | | | | | | | | | | | |
Net income |
$ | 12,838 | $ | 11,083 | $ | 15,098 | $ | 26,807 | $ | 43,039 | ||||||
| | | | | | | | | | | | | | | | | |
| | | | | | | | | | | | | | | | | |
| | | | | | | | | | | | | | | | | |
Earnings per share: |
||||||||||||||||
Basic |
$ | 49.90 | $ | 42.92 | $ | 58.38 | $ | 103.48 | $ | 166.01 | ||||||
Diluted |
$ | 49.88 | $ | 42.55 | $ | 56.73 | $ | 99.99 | $ | 156.63 | ||||||
Weighted average shares outstanding: |
||||||||||||||||
Basic |
257,280 | 258,232 | 258,599 | 259,043 | 259,251 | |||||||||||
Diluted |
257,391 | 260,451 | 266,148 | 268,103 | 274,784 | |||||||||||
| |
Fiscal year ended |
|||
|---|---|---|---|---|
| |
12/29/2016 | |||
Pro forma statement of operations data: |
||||
Pro forma earnings per share(4): |
||||
Basic |
||||
Diluted |
||||
Pro forma weighted average shares outstanding(4): |
||||
Basic |
||||
Diluted |
||||
| |
Fiscal year ended | |||||||||||||||
|---|---|---|---|---|---|---|---|---|---|---|---|---|---|---|---|---|
(in thousands)
|
12/27/2012 | 12/26/2013 | 12/25/2014 | 12/31/2015(1) | 12/29/2016 | |||||||||||
Consolidated statement of cash flows data: |
||||||||||||||||
Net cash provided by (used in) operating activities |
$ | 23,336 | $ | (15,428 | ) | $ | 43,594 | $ | 20,380 | $ | 89,456 | |||||
Net cash used in investing activities |
(10,709 | ) | (25,056 | ) | (39,069 | ) | (45,021 | ) | (74,648 | ) | ||||||
Net cash (used in) provided by financing activities |
(15,777 | ) | 40,487 | (4,421 | ) | 24,680 | (14,675 | ) | ||||||||
14
| |
As of December 31, 2015 |
As of December 29, 2016 | ||||||||
|---|---|---|---|---|---|---|---|---|---|---|
(in thousands)
|
Actual | Actual | Pro forma(5) | |||||||
Consolidated balance sheet data: |
||||||||||
Cash and cash equivalents |
$ | 318 | $ | 451 | $ | |||||
Net working capital |
109,565 | 95,550 | ||||||||
Total assets |
748,888 | 831,166 | ||||||||
Total debt(6) |
177,590 | 390,743 | ||||||||
Total stockholders' equity |
312,365 | 134,283 | ||||||||
| |
Fiscal year ended | |||||||||||||||
|---|---|---|---|---|---|---|---|---|---|---|---|---|---|---|---|---|
| |
12/27/2012 | 12/26/2013 | 12/25/2014 | 12/31/2015(1) | 12/29/2016(1) | |||||||||||
Other financial data: |
||||||||||||||||
Comparable store sales growth |
11.7 | % | 22.1 | % | 15.8 | % | 13.5 | % | 19.4 | % | ||||||
Number of stores open at the end of the period(7) |
31 | 39 | 48 | 58 | 70 | |||||||||||
Adjusted EBITDA (in thousands)(8) |
$ | 34,161 | $ | 41,853 | $ | 58,771 | $ | 80,403 | $ | 122,024 | ||||||
Adjusted EBITDA margin |
10.1 | % | 9.4 | % | 10.1 | % | 10.3 | % | 11.6 | % | ||||||
15
(in thousands)
|
Fiscal year ended December 29, 2016 |
|||
|---|---|---|---|---|
Net income, as reported |
$ | 43,039 | ||
Net decrease (increase) in interest expense(a) |
||||
Decrease (increase) in income tax expense(b) |
||||
| | | | | |
Pro forma net income |
$ | |||
| | | | | |
| | | | | |
| | | | | |
(in thousands)
|
Fiscal year ended December 29, 2016 |
|||
|---|---|---|---|---|
Interest expense, as reported |
$ | 12,803 | ||
Net increase attributable to 2016 Refinancing(c) |
||||
Decrease attributable to this offering(d) |
||||
| | | | | |
Net increase (decrease) |
||||
Pro forma interest expense |
$ | |||
| | | | | |
| | | | | |
| | | | | |
Pro forma for this offering, our total debt as of January 1, 2016 consisted of $ million and $ million under our $200 million asset-backed revolving credit facility (the "ABL Facility," and together with the Term Loan Facility, our "Credit Facilities") and the Term Loan Facility, respectively. As of January 1, 2016, the interest rate for the ABL Facility and the Term Loan Facility, was % and %, respectively.
16
price of $ per share, the midpoint of the price range set forth on the cover page of this prospectus, after deducting the underwriting discount and estimated offering expenses payable by us, (ii) the repayment of a portion of the Term Loan Facility from the net proceeds of this offering received by us as described under "Use of Proceeds" and (iii) the write-off of approximately $ million of unamortized deferred debt issuance costs and original issue discount associated with the repayment of $ million of loans under the Term Loan Facility.
17
measures
of performance to evaluate the effectiveness of our business strategies, to make budgeting decisions, and to compare our performance against that of other peer companies using similar
measures. EBITDA and Adjusted EBITDA are also used by analysts, investors and other interested parties as performance measures to evaluate companies in our industry.
| |
Fiscal year ended | |||||||||||||||
|---|---|---|---|---|---|---|---|---|---|---|---|---|---|---|---|---|
(in thousands)
|
12/27/2012 | 12/26/2013 | 12/25/2014 | 12/31/2015(1) | 12/29/2016 | |||||||||||
Net income |
$ | 12,838 | $ | 11,083 | $ | 15,098 | $ | 26,807 | $ | 43,039 | ||||||
Depreciation and amortization(a) |
4,641 | 6,362 | 11,073 | 16,794 | 25,089 | |||||||||||
Interest expense |
6,528 | 7,684 | 8,949 | 9,386 | 12,803 | |||||||||||
Loss on early extinguishment of debt(b) |
— | 1,638 | — | — | 1,813 | |||||||||||
Income tax expense |
8,102 | 6,857 | 9,634 | 16,199 | 11,474 | |||||||||||
| | | | | | | | | | | | | | | | | |
EBITDA |
32,109 | 33,624 | 44,754 | 69,186 | 94,218 | |||||||||||
Pre-opening expenses(c) |
1,589 | 5,316 | 7,563 | 7,535 | 13,626 | |||||||||||
Stock compensation expense(d) |
978 | 1,869 | 2,323 | 3,258 | 3,229 | |||||||||||
Loss on asset disposal(e) |
157 | 656 | 148 | 128 | 451 | |||||||||||
Executive severance(f) |
— | — | 2,975 | 296 | — | |||||||||||
Executive recruiting/relocation(g) |
751 | 54 | — | — | — | |||||||||||
Legal settlement(h) |
— | — | — | — | 10,500 | |||||||||||
Casualty gain(i) |
(1,421 | ) | — | — | — | — | ||||||||||
Other(j) |
(2 | ) | 334 | 1,008 | — | — | ||||||||||
| | | | | | | | | | | | | | | | | |
Adjusted EBITDA |
$ | 34,161 | $ | 41,853 | $ | 58,771 | $ | 80,403 | $ | 122,024 | ||||||
| | | | | | | | | | | | | | | | | |
| | | | | | | | | | | | | | | | | |
| | | | | | | | | | | | | | | | | |
18
19
You should carefully consider the risks described below, together with all of the other information included in this prospectus, including our consolidated financial statements and the related notes thereto, before making an investment decision. The risks and uncertainties set out below are not the only risks we face. Additional risks and uncertainties not currently known to us or that we currently deem to be immaterial also may materially and adversely affect our business, financial condition and operating results. If any of the following events occur, our business, financial condition and operating results could be materially and adversely affected. In that case, the trading price of our common stock could decline, and you may lose all or part of your investment.
Risks Related to Our Business
Our business, financial condition and operating results are dependent on general economic conditions and discretionary spending by our customers, which in turn are affected by a variety of factors beyond our control. If such conditions deteriorate, our business, financial condition and operating results may be adversely affected.
Our business, financial condition and operating results are affected by general economic conditions and discretionary spending by our customers. Such general economic conditions and discretionary spending are beyond our control and are affected by, among other things:
If such conditions deteriorate, our business, financial condition and operating results may be adversely affected. In addition, increasing volatility in financial and capital markets may cause some of the above factors to change with a greater degree of frequency and magnitude than in the past.
The hard surface flooring industry depends on home remodeling activity and other important factors.
The hard surface flooring industry is highly dependent on the remodeling of existing homes, businesses and, to a lesser extent, new home construction. In turn, remodeling and new home construction depend on a number of factors that are beyond our control, including interest rates, tax policy, trade policy, employment levels, consumer confidence, credit availability, real estate prices,
20
existing home sales, demographic trends, weather conditions, natural disasters and general economic conditions. In particular:
Any one or a combination of these factors could result in decreased demand for our products, reduce spending on homebuilding or remodeling of existing homes or cause purchases of new and existing homes to decline. While the vast majority of our net sales are derived from home remodeling activity as opposed to new home construction, a decrease in any of these areas would adversely affect our business, financial condition and operating results.
Any failure by us to successfully anticipate trends may lead to loss of consumer acceptance of our products, resulting in reduced net sales.
Each of our stores is stocked with a customized product mix based on consumer demands in a particular market. Our success therefore depends on our ability to anticipate and respond to changing trends and consumer demands in these markets in a timely manner. If we fail to identify and respond to emerging trends, consumer acceptance of our merchandise and our image with current or potential customers may be harmed, which could reduce our net sales. Additionally, if we misjudge market trends, we may significantly overstock unpopular products, incur excess inventory costs and be forced to reduce the sales price of such products or incur inventory write-downs, which would adversely affect our operating results. Conversely, shortages of products that prove popular could also reduce our net sales through missed sales and a loss of customer loyalty.
If we fail to successfully manage the challenges that our planned new store growth poses or encounter unexpected difficulties during our expansion, our operating results and future growth opportunities could be adversely affected.
We have 72 warehouse-format stores and one small-format standalone design center located throughout the United States as of March 20, 2017. We plan to open an additional 11 stores in 2017 and to increase the number of new stores that we open during each of the next several years thereafter. This growth strategy and the investment associated with the development of each new store may cause our operating results to fluctuate and be unpredictable or decrease our profits. We cannot ensure that store locations will be available to us, or that they will be available on terms acceptable to us. If additional retail store locations are unavailable on acceptable terms, we may not be able to carry out a significant part of our growth strategy or our new stores' profitability may be lower. Our future operating results and ability to grow will depend on various other factors, including our ability to:
21
In addition, the availability of existing large-format retail and mixed use facilities is lower than it has been over the last five years, and occupancy costs are increasing, as well as the initial term of lease commitments. Further, consumers in new markets may be less familiar with our brand, and we may need to increase brand awareness in such markets through additional investments in advertising or high cost locations with more prominent visibility. Stores opened in new markets may have higher construction, occupancy or operating costs, or may have lower net sales, than stores opened in the past. In addition, laws or regulations in these new markets may make opening new stores more difficult or cause unexpected delays. Newly opened stores may not succeed or may reach profitability more slowly than we expect, and the ramp-up to profitability may become longer in the future as we enter more markets and add stores to markets where we already have a presence. Future markets and stores may not be successful and, even if they are successful, our comparable store sales may not increase at historical rates. To the extent that we are not able to overcome these various challenges, our operating results and future growth opportunities could be adversely affected.
Increased competition could cause price declines, decrease demand for our products and decrease our market share.
We operate in the hard surface flooring industry, which is highly fragmented and competitive. We face competition from large home improvement centers, national and regional specialty flooring chains, Internet-based companies and independent flooring retailers. Among other things, we compete on the basis of breadth of product assortment, low prices, and the in-store availability of the products we offer in project- ready quantities, as well as the quality of our products and customer service. As we expand into new and unfamiliar markets, we may experience different competitive conditions than in the past.
Some of our competitors are organizations that are larger, are better capitalized, have existed longer, have product offerings that extend beyond hard surface flooring and related accessories and have a more established market presence with substantially greater financial, marketing, personnel and other resources than we have. In addition, while the hard surface flooring category has a relatively low threat of new internet-only entrants due to the nature of the product, the growth opportunities presented by e-commerce could outweigh these challenges and result in increased competition. Competitors may forecast market developments more accurately than we do, offer similar products at a lower cost or adapt more quickly to new trends and technologies or evolving customer requirements than we do. Further, because the barriers to entry into the hard surface flooring industry are relatively low, manufacturers and suppliers of flooring and related products, including those whose products we currently sell, could enter the market and start directly competing with us. Intense competitive pressures from any of our present or future competitors could cause price declines, decrease demand for our products and decrease our market share. Also, if we continue to grow and become more well-known, other companies may change their strategies to present new competitive challenges. Moreover, in the future, changes in consumer preferences may cause hard surface flooring to become less popular than other types of floor coverings. Such a change in consumer preferences could lead to decreased demand for our products.
All of these factors may harm us and adversely affect our net sales, market share and operating results.
Any disruption in our distribution capabilities or our related planning and control processes may adversely affect our business, financial condition and operating results.
Our success is highly dependent on our planning and distribution infrastructure, which includes the ordering, transportation and distribution of products to our stores and the ability of suppliers to meet distribution requirements. We also need to ensure that we continue to identify and improve our processes and supply chain and that our distribution infrastructure and supply chain keep pace with our
22
anticipated growth and increased number of stores. The cost of these enhanced processes could be significant and any failure to maintain, grow, or improve them could adversely affect our business, financial condition and operating results. Due to our rapid expansion, we have had to increase the size of our distribution centers. Based on our growth intentions we may need to add additional distribution centers or increase the size of our existing distribution centers in the future. Increasing the size of our distribution centers may decrease the efficiency of our distribution costs.
We took over management of our four distribution centers in 2014 from independent third-party logistics providers. We have limited experience managing our distribution centers and cannot assure you that we will be successful in doing so.
In addition, we plan to open a new 1.4 million square foot distribution center near Savannah, Georgia in the fourth quarter of fiscal 2017. The building is currently under construction, and we cannot guarantee that its opening will be on time or on budget. In connection with the opening of that distribution center, we plan to close our existing distribution centers near Savannah, Georgia and Miami, Florida and move those operations to our new facility near Savannah. We expect to close our distribution center near Miami in early 2018. While we complete this transition, we may incur unexpected costs, and our ability to distribute our products may be adversely affected. We recently moved our West Coast distribution center from Carson, California to Moreno Valley, California, incurring related costs of less than $1.0 million in the first quarter of fiscal 2017. Any disruption in the transition to or operation of our distribution centers could have an adverse impact on our business, financial condition and operating results. In addition, our long-term plan expects that we will be able to sublet a portion of our previously occupied distribution centers. Any failure to do so on favorable terms could have a negative impact on our financial condition and operating results.
Our success is also dependent on our ability to provide timely delivery to our customers. Our business could also be adversely affected if fuel prices increase or there are delays in product shipments due to freight difficulties, inclement weather, strikes by our employees or employees of third-parties involved in our supply chain, or other difficulties. If we are unable to deliver products to our customers on a timely basis, they may decide to purchase products from our competitors instead of from us, which would adversely affect our business, financial condition and operating results.
Our operating results may be adversely affected by fluctuations in material and energy costs.
Our operating results may be affected by the wholesale prices of hard surface flooring products, setting and installation materials and the related accessories that we sell. These prices may fluctuate based on a number of factors beyond our control, including the price of raw materials used in the manufacture of hard surface flooring, energy costs, changes in supply and demand, general economic conditions, labor costs, competition, import duties, tariffs, currency exchange rates, government regulation, duty and other import costs. In particular, energy costs have fluctuated dramatically in the past and may fluctuate in the future. These fluctuations may result in an increase in our transportation costs for distribution from the manufacturer to our distribution centers and from our distribution centers to our retail stores, utility costs for our distribution centers and retail stores and overall costs to purchase products from our suppliers.
We may not be able to adjust the prices of our products, especially in the short-term, to recover these cost increases, and a continual rise in such costs could adversely affect consumer spending and demand for our products and increase our operating costs, both of which could adversely affect our business, financial condition and operating results.
Our future success is dependent on our ability to execute our business strategy effectively and deliver value to our customers.
We believe our future success will depend on our ability to execute our business strategy effectively and deliver value to our customers. We believe that our breadth of product assortment
23
across a variety of hard surface flooring categories, low prices, and in-store availability of the products we offer in project-ready quantities, as well as the quality of our products and customer service, are among the key competitive advantages and important elements of our total value proposition. If we are unsuccessful in staying competitive with our current value proposition, the demand for our products would decrease, and customers may decide to purchase products from our competitors instead of us. If this were to occur, our net sales, market share and operating results would be adversely affected.
Our operating results may be adversely affected if we are not successful in managing our inventory.
We currently maintain a high level of inventory consisting of on average approximately 3,500 SKUs per store and an average inventory per store of approximately $2.5 million at cost in order to have a broad assortment of products across a wide variety of hard surface flooring categories in project-ready quantities. We also carry an additional $84.5 million of inventory outside our stores, primarily at our distribution centers as of December 29, 2016. The investment associated with this high level of inventory is substantial, and efficient inventory management is a key component of our business success and profitability. If we fail to adequately project the amount or mix of our inventory, we may miss sales opportunities or have to take unanticipated markdowns or hold additional clearance events to dispose of excess inventory, which will adversely affect our operating results.
In the past, we have incurred costs associated with inventory markdowns and obsolescence. Due to the likelihood that we will continue to incur such costs in the future, we generally include an allowance for such costs in our projections. However, the costs that we actually incur may be substantially higher than our estimate and adversely affect our operating results.
We continue to focus on ways to reduce these risks, but we cannot assure you that we will be successful in our inventory management.
Our operating results may be adversely affected by inventory shrinkage and damage.
We are subject to the risk of inventory shrinkage and damage, including the damage or destruction of our inventory by natural disasters or other causes. We have experienced charges in the past, and we cannot assure you that the measures we are taking will effectively address the problem of inventory shrinkage and damage in the future. Although some level of inventory shrinkage and damage is an unavoidable cost of doing business, we could experience higher-than-normal rates of inventory shrinkage and damage or incur increased security and other costs to combat inventory theft and damage. If we are not successful in managing our inventory balances, our operating results may be adversely affected.
If we are unable to enter into leases for additional stores on acceptable terms or renew or replace our current store leases, or if one or more of our current leases is terminated prior to expiration of its stated term, and we cannot find suitable alternate locations, our growth and profitability could be adversely affected.
We currently lease all of our store locations and our store support center. Our growth strategy largely depends on our ability to identify and open future store locations, which can be difficult because our stores generally require at least 50,000 square feet of floor space. Our ability to negotiate acceptable lease terms for these store locations, to re-negotiate acceptable terms on expiring leases or to negotiate acceptable terms for suitable alternate locations could depend on conditions in the real estate market, competition for desirable properties, our relationships with current and prospective landlords, or on other factors that are not within our control. Any or all of these factors and conditions could adversely affect our growth and profitability.
24
If we are unable to enter into leases to expand our existing store support center and we cannot find suitable alternate locations at an acceptable cost, our financial results could be adversely affected.
The lease for our current store support center in Smyrna, Georgia, which serves as our corporate headquarters, only provides sufficient space to support our projected growth through 2018. We are exploring various alternatives, but if we cannot find an acceptable solution, our financial results could be adversely effected.
Our net sales growth could be adversely affected if comparable store sales growth is less than we expect.
While future net sales growth will depend substantially on our plans for new store openings, our comparable store sales growth is a significant driver of our net sales, profitability and overall business results. Because numerous factors affect our comparable store sales growth, including, among others, economic conditions, the retail sales environment, the home improvement spending environment, housing turnover, housing appreciation, interest rates, the hard surface flooring industry and the impact of competition, the ability of our customers to obtain credit, changes in our product mix, the in-stock availability of products that are in demand, changes in staffing at our stores, cannibalization resulting from the opening of new stores in existing markets, greater cannibalization than we modeled for new stores, lower than expected ramp-up in new store net sales, changes in advertising and other operating costs, weather conditions, retail trends and our overall ability to execute our business strategy and planned growth effectively, it is possible that we will not achieve our targeted comparable store sales growth or that the change in comparable store sales could be negative. If this were to happen, it is likely that overall net sales growth would be adversely affected.
If we fail to identify and maintain relationships with a sufficient number of suppliers, our ability to obtain products that meet our high quality standards at attractive prices could be adversely affected.
We purchase flooring and other products directly from suppliers located around the world. We do not have long-term contractual supply agreements with our suppliers that obligate them to supply us with products exclusively or at specified quantities or prices. As a result, our current suppliers may decide to sell products to our competitors and may not continue selling products to us. In order to retain the competitive advantage that we believe results from these relationships, we need to continue to identify, develop and maintain relationships with qualified suppliers that can satisfy our high standards for quality and safety and our requirements for delivery of flooring and other products in a timely and efficient manner at attractive prices. The need to develop new relationships will be particularly important as we seek to expand our operations and enhance our product offerings in the future. The loss of one or more of our existing suppliers or our inability to develop relationships with new suppliers could reduce our competitiveness, slow our plans for further expansion and cause our net sales and operating results to be adversely affected.
We will require significant capital to fund our expanding business, which may not be available to us on satisfactory terms or at all. If we are unable to maintain sufficient levels of cash flow or if we do not have sufficient availability under the ABL Facility, we may not meet our growth expectations or we may require additional financing, which could adversely affect our financial health and impose covenants that limit our business activities.
We plan to continue investing for growth, including opening new stores, remodeling existing stores, adding staff, adding distribution center capacity and upgrading our information technology systems and other infrastructure. These investments will require significant capital, which we plan on funding with cash flow from operations and borrowings under the ABL Facility.
If our business does not generate sufficient cash flow from operations to fund these activities or if these investments do not yield cash flows in line with past performance or our expectations, we may need additional equity or debt financing. If such financing is not available to us, or is not available
25
on satisfactory terms, our ability to operate and expand our business or respond to competitive pressures would be curtailed, and we may need to delay, limit or eliminate planned store openings or operations or other elements of our growth strategy. If we raise additional capital by issuing equity securities or securities convertible into equity securities, your ownership would be diluted.
We depend on a number of suppliers, and any failure by any of them to supply us with quality products on attractive terms and prices may adversely affect our business, financial condition and operating results.
We depend on our suppliers to deliver quality products to us on a timely basis at attractive prices. Additionally, we source the products that we sell from over 180 domestic and international suppliers. However, in the future, we may not be able to acquire desired merchandise in sufficient quantities on terms acceptable to us, which may impair our relationship with our customers, impair our ability to attract new customers, reduce our competitiveness and adversely affect our business, financial condition and operating results.
Changes in tax laws, trade policies and regulations or in our operations may impact our effective tax rate and may adversely affect our business, financial condition and operating results.
Changes in tax laws in any of the multiple jurisdictions in which we operate, or adverse outcomes from tax audits that we may be subject to in any of the jurisdictions in which we operate, could result in an unfavorable change in our effective tax rate, which could adversely affect our business, financial condition and operating results.
Additionally, results of the November 2016 United States elections and reform proposals advanced by the U.S. Congress have introduced greater uncertainty with respect to the deductibility of net interest expense, tax and trade policies, tariffs and government regulations affecting trade between the United States and other countries. We import approximately 68% of the products we sell, including a significant amount of product from China. Major developments in tax policy or trade relations, such as the disallowance of tax deductions for imported merchandise or the imposition of unilateral tariffs on imported products, could have a material adverse effect on our business, results of operations and liquidity. If there are any adverse changes in tax laws or trade policies that result in an increase in our costs, we may not be able to adjust the prices of our products, especially in the short-term, to recover such costs, and a rise in such costs could adversely affect our business, financial condition and operating results.
The failure of our suppliers to adhere to the quality standards that we set for our products could lead to government investigations, litigation, write-offs and recalls, which could damage our reputation and our brand, increase our costs, and otherwise adversely affect our business.
We do not control the operations of our suppliers. Although we conduct an initial due diligence investigation prior to engaging our suppliers and require our suppliers to certify compliance with applicable laws and regulations, we cannot guarantee that our suppliers will comply with applicable laws and regulations or operate in a legal, ethical and responsible manner. Additionally, it is possible that we may not be able to identify noncompliance by our suppliers notwithstanding these precautionary measures. Violation of applicable laws and regulations by our suppliers or their failure to operate in a legal, ethical or responsible manner, could expose us to legal risks, cause us to violate laws and regulations and reduce demand for our products if, as a result of such violation or failure, we attract negative publicity. In addition, the failure of our suppliers to adhere to the quality standards that we set for our products could lead to government investigations, litigation, write-offs and recalls, which could damage our reputation and our brand, increase our costs, and otherwise adversely affect our business.
26
We procure the majority of our products from suppliers located outside of the United States, and as a result, we are subject to risks associated with obtaining products from abroad that could adversely affect our business, financial condition and results of operations.
We procure the majority of our products from suppliers located outside of the United States. As a result, we are subject to risks associated with obtaining products from abroad, including:
Additionally, we import approximately 45% of the products we sell from China. The Chinese government has in the past imposed restrictions on manufacturing facilities, including a shut-down of transportation of materials and power plants to reduce air pollution. If, in the future, restrictions are imposed that include our operations, our suppliers' ability to supply current or new orders would be significantly impacted. These and other factors beyond our control could disrupt the ability of our suppliers to ship certain products to us cost-effectively or at all, expose us to significant operational and legal risk and negatively affect our reputation, any of which could adversely affect our business, financial condition and results of operations.
Our ability to offer compelling products, particularly products made of more exotic species or unique stone, depends on the continued availability of sufficient suitable natural products.
Our business strategy depends on offering a wide assortment of compelling products to our customers. We sell, among other things, flooring made from various wood species and natural stone from quarries throughout the world. Our ability to obtain an adequate volume and quality of hard-to-find products depends on our suppliers' ability to furnish those products, which, in turn, could be affected by many things, including events such as forest fires, insect infestation, tree diseases, prolonged drought, other adverse weather and climate conditions and the exhaustion of stone quarries. Government regulations relating to forest management practices also affect our suppliers' ability to harvest or export timber and other products, and changes to regulations and forest management policies, or the implementation of new laws or regulations, could impede their ability to do so. If our suppliers cannot deliver sufficient products, and we cannot find replacement suppliers, our net sales and operating results may be adversely affected.
27
Our business exposes us to personal injury, product liability and warranty claims and related governmental investigations, which could result in negative publicity, harm our brand and adversely affect our business, financial condition and operating results.
Our stores and distribution centers are warehouse environments that involve the operation of forklifts and other machinery and the storage and movement of heavy merchandise, all of which are activities that have the inherent danger of injury or death to employees or customers despite safety precautions, training and compliance with federal, state and local health and safety regulations. While we have insurance coverage in place in addition to policies and procedures designed to minimize these risks, we may nonetheless be unable to avoid material liabilities for an injury or death arising out of these activities.
In addition, we face an inherent risk of exposure to product liability or warranty claims or governmental investigations in the event that the use of our products is alleged to have resulted in economic loss, personal injury or property damage or violated environmental or other laws. If any of our products proves to be defective or otherwise in violation of applicable law, we may be required to recall or redesign such products. Further, in such instances, we may be subject to legal action. We generally seek contractual indemnification from our suppliers. However, such contractual indemnification may not be enforceable against the supplier, particularly because many of our suppliers are located outside of the United States. Any personal injury, product liability or warranty claim made against us, whether or not it has merit, or governmental investigation related to our products, could be time-consuming and costly to defend or respond to, may not be covered by insurance carried by us, could result in negative publicity, could harm our brand and could adversely affect our business, financial condition and operating results. In addition, any negative publicity involving our suppliers, employees, and other parties who are not within our control could adversely affect us.
Unfavorable allegations, government investigations and legal actions surrounding our products and us could harm our reputation, impair our ability to grow or sustain our business, and adversely affect our business, financial condition and operating results.
We rely on our reputation for offering great value, superior service and a broad assortment of high-quality, safe products. If we become subject to unfavorable allegations, government investigations or legal actions involving our products or us, such circumstances could harm our reputation and our brand and adversely affect our business, financial condition and operating results. If this negative impact is significant, our ability to grow or sustain our business could be jeopardized.
For example, a 60 Minutes segment that aired on March 1, 2015 alleged that another retailer of home flooring products sold flooring containing unsafe levels of formaldehyde. Flooring products that use formaldehyde resins, including laminate and engineered flooring, are subject to applicable laws and regulations governing formaldehyde emissions. The 60 Minutes segment alleged that the retailer's products were falsely labeled as being compliant with the emissions standards of CARB. The report also suggested that the flooring could cause adverse health effects. The retailer became subject to numerous lawsuits and government investigations, including by the Consumer Products Safety Commission.
In December 2015, a similar lawsuit was filed as a putative nationwide class action against our subsidiary F&D. The lawsuit alleged that certain Chinese-manufactured laminate flooring products sold by F&D were falsely labeled as compliant with formaldehyde emissions standards established by CARB. In June 2016, management believed a settlement of the case was both probable and estimable and accrued $14 million with respect to such case in the second quarter of fiscal 2016. During the third quarter of fiscal 2016, F&D reached an agreement with one of the manufacturers whose products were involved in the case to cover $3.5 million of our losses related to this lawsuit. We recorded the $3.5 million receivable as an offset to litigation settlement expenses. Legal expenses incurred in connection with the case were recorded in general & administrative expenses during the period in which they were
28
incurred. In September 2016, F&D entered into a classwide settlement to resolve the lawsuit. The settlement class was defined as all end users of Chinese-manufactured laminate flooring sold by F&D nationwide between January 1, 2012 and August 1, 2015. As part of the settlement, all settlement class members who did not exclude themselves from the settlement granted F&D a release of all claims arising out of or relating to their purchase of Chinese-manufactured laminate flooring from F&D, with the exception of personal injury claims. The settlement did not involve an admission of liability by F&D. Seven members of the settlement class excluded themselves from the settlement. The settlement was granted final approval by the court on January 10, 2017.
Although the claims asserted in the December 2015 lawsuit have been resolved, we cannot predict whether we will face additional lawsuits that are not covered by the settlement or the release. If additional lawsuits are filed, we could incur significant costs, be liable for damages, be subject to fines, penalties, injunctive relief, criminal charges or other legal risks, which could reduce demand for our products and adversely affect our business, financial condition and operating results.
Negative publicity surrounding such matters, including publicity about other retailers, may harm our reputation and affect the demand for our products. In addition, if more stringent laws or regulations are adopted in the future, we may have difficulty complying with the new requirements imposed by such laws and regulations, and in turn, our business, financial condition and operating results could be adversely affected. Moreover, regardless of whether any such changes are adopted, we may become subject to claims or governmental investigations alleging violations of applicable laws and regulations. Any such matter may subject us to fines, penalties, injunctions, litigation and/or potential criminal violations. Any one of these results could negatively affect our business, financial condition and operating results and impair our ability to grow or sustain our business.
If we violate or are alleged to have violated environmental, health and safety laws and regulations, we could incur significant costs and other negative effects that could reduce demand for our products and adversely affect our business, financial condition and operating results.
In addition to the applicable laws and regulations discussed above, certain portions of our operations are subject to laws and regulations governing the environmental protection of natural resources and health and safety, including the use, storage, handling, generation, transportation, treatment, emission, release, discharge and disposal of certain hazardous materials and wastes. In addition, certain of our products are subject to laws and regulations relating to the importation, exportation, acquisition or sale of certain plants and plant products, including those illegally harvested, and the emissions of hazardous materials.
We operate our business in accordance with standards and procedures designed to comply with the applicable laws and regulations in these areas and work closely with our suppliers in order to comply with such laws and regulations. If we violate or are alleged to have violated these laws, we could incur significant costs, be liable for damages, experience delays in shipments of our products, be subject to fines, penalties, criminal charges or other legal risks, or suffer reputational harm, any of which could reduce demand for our products and adversely affect our business, financial condition and operating results. In addition, there can be no assurance that such laws or regulations will not become more stringent in the future or that we will not incur additional costs in the future in order to comply with such laws or regulations.
We are engaged in various legal actions, claims and proceedings arising in the ordinary course of business and, while we cannot predict the outcomes of such proceedings and other contingencies with certainty, this litigation and any potential future litigation could have an adverse impact on us.
We are engaged in various legal actions, claims and proceedings arising in the ordinary course of business, including claims related to breach of contract, product liabilities, intellectual property matters and employment related matters resulting from our business activities. As with most actions
29
such as these, an estimate of any possible and/or ultimate liability cannot always be determined. Regardless of the outcome, litigation can have an adverse impact on us because of defense and settlement costs, diversion of management resources, and other factors. Additionally, we cannot guarantee that we will not become engaged in additional legal actions, claims, proceedings or governmental investigations in the future. Any such action could result in negative publicity, harm to our reputation and adversely affect our business, financial condition and operating results.
Labor activities could cause labor relations difficulties for us.
Currently none of our employees are represented by a union; however, our employees have the right at any time to form or affiliate with a union. As we continue to grow, enter different regions and operate distribution centers, unions may attempt to organize all or part of our employee base at certain stores or distribution centers within certain regions. We cannot predict the adverse effects that any future organizational activities will have on our business, financial condition and operating results. If we were to become subject to work stoppages, we could experience disruption in our operations and increases in our labor costs, either of which could adversely affect our business, financial condition and operating results.
Federal, state or local laws and regulations, or our failure to comply with such laws and regulations, could increase our expenses, restrict our ability to conduct our business and expose us to legal risks.
We are subject to a wide range of general and industry-specific laws and regulations imposed by federal, state and local authorities in the countries in which we operate including those related to customs, foreign operations (such as the FCPA), truth-in-advertising, consumer protection (such as the Telephone Consumer Protection Act), privacy, product safety, the environment (such as the Lacey Act), intellectual property infringement, zoning and occupancy matters as well as the operation of retail stores and distribution facilities. In addition, various federal and state laws govern our relationship with, and other matters pertaining to, our employees, including wage and hour laws, laws governing independent contractor classifications, requirements to provide meal and rest periods or other benefits, family leave mandates, requirements regarding working conditions and accommodations to certain employees, citizenship or work authorization and related requirements, insurance and workers' compensation rules and anti-discrimination laws. In recent years, we and other parties in the flooring industry have been or currently are parties to litigation involving claims that allege violations of the foregoing laws, including claims related to product safety and patent claims. See "—Unfavorable allegations, government investigations and legal actions surrounding our products and us could harm our reputation and impair our ability to grow or sustain our business." In addition, there has been an increase in the number of wage and hour class action claims that allege misclassification of overtime eligible workers and/or failure to pay overtime-eligible workers for all hours worked, particularly in the retail industry. Although we believe that we have complied with these laws and regulations, there is nevertheless a risk that we will become subject to claims that allege we have failed to do so. Any claim that alleges a failure by us to comply with any of the foregoing laws and regulations may subject us to fines, penalties, injunctions, litigation and/or potential criminal violations, which could adversely affect our reputation, business, financial condition and operating results.
Certain of our products may require us to spend significant time and resources in order to comply with applicable advertising, labeling, importation, exportation, environmental, health and safety laws and regulations because if we violate these laws or regulations, we could experience delays in shipments of our goods, be subject to fines or penalties, be liable for costs and damages or suffer reputational harm, any of which could reduce demand for our merchandise and adversely affect our business, financial condition and operating results.
Any changes to the foregoing laws or regulations or any new laws or regulations that are passed or go into effect may make it more difficult for us to operate our business and in turn adversely affect our operating results.
30
We may also be subject to audits by various taxing authorities. Similarly, changes in tax laws in any of the multiple jurisdictions in which we operate, or adverse outcomes from tax audits that we may be subject to in any of the jurisdictions in which we operate, could result in an unfavorable change in our effective tax rate, which could adversely affect our business, financial condition and operating results. In addition, given the nature of our business, certain of our sales are exempt from state sales taxes. If we are audited and fail to maintain proper documentation, any adjustments resulting from such audits could increase our tax liability, including any interest or penalties.
If our efforts to ensure the privacy and security of information related to our customers, us, our employees, our suppliers and other third parties are not successful, we could become subject to litigation, investigations, liability and negative publicity that could significantly harm our reputation and relationships with our customers and adversely affect our business, financial condition and operating results.
Our business, like that of most retailers, involves the receipt, storage and transmission of customers' personal information, consumer preferences and payment card data, as well as other confidential information related to us, our employees, our suppliers and other third parties, some of which is entrusted to third-party service providers and vendors that provide us with technology, systems and services that we use in connection with the receipt, storage and transmission of such information. Cyber-attacks designed to gain access to these types of sensitive information by breaching critical systems of large organizations are constantly evolving, and high profile electronic security breaches leading to unauthorized release of sensitive information have occurred in recent years with increasing frequency at a number of major U.S. companies, including several large retailers, notwithstanding widespread recognition of the cyber-attack threat and improved data protection methods.
Despite our security measures and those of third parties with whom we do business, such as our banks, merchant card processing and other technology vendors, our respective systems and facilities may be vulnerable to criminal cyber-attacks or security incidents due to malfeasance, intentional or inadvertent security breaches by employees, or other vulnerabilities such as defects in design or manufacture. Unauthorized parties may also attempt to gain access to our systems or facilities through fraud, trickery or other forms of deception targeted at our customers, employees, suppliers and service providers. Any such incidents could compromise our networks and the information stored there could be accessed, publicly disclosed, lost or stolen.
As noted above, the techniques used by criminals to obtain unauthorized access to sensitive data change frequently and often are not recognized until launched against a target; accordingly, we may be unable to anticipate these techniques or implement adequate preventative measures. In addition, advances in computer capabilities, new technological discoveries or other developments may also compromise or result in the obsolescence of the technology used to protect sensitive information. An actual or anticipated attack may cause us to incur additional costs, including costs related to diverting or deploying personnel, implementing preventative measures, training employees and engaging third-party experts and consultants. Further, any security breach could expose us to risks of data loss, regulatory and law enforcement investigations, litigation and liability and could seriously disrupt our operations and any resulting negative publicity could significantly harm our reputation and relationships with our customers and adversely affect our business, financial condition and operating results.
A material disruption in our information systems, including our website and call center, could adversely affect our business or operating results and lead to reduced net sales and reputational damage.
We rely on our information systems to process transactions, summarize our results of operations and manage our business. In particular, our website and our call center are important parts of our integrated connected customer strategy and customers use these systems as information sources on the range of products available to them and as a way to order our products. Therefore, the reliability and capacity of our information systems is critical to our operations and the implementation
31
of our growth initiatives. However, our information systems are subject to damage or interruption from planned upgrades in technology interfaces, power outages, computer and telecommunications failures, computer viruses, cyber-attacks or other security breaches and catastrophic events such as fires, floods, earthquakes, tornadoes, hurricanes, acts of war or terrorism and usage errors by our employees. If our information systems are damaged or cease to function properly, we may have to make a significant investment to fix or replace them, and we may suffer losses of critical data and/or interruptions or delays in our operations. In addition, to keep pace with changing technology, we must continuously implement new information technology systems as well as enhance our existing systems. In particular, in 2017 we intend to implement a new human resources information system, and any disruption in doing so could negatively impact the operation of our business. Moreover, the successful execution of some of our growth strategies, in particular the expansion of our connected customer and online capabilities, is dependent on the design and implementation of new systems and technologies and/or the enhancement of existing systems. Any material disruption in our information systems, or delays or difficulties in implementing or integrating new systems or enhancing or expanding current systems, could have an adverse effect on our business, in particular our call center and online operations, and our operating results and could lead to reduced net sales and reputational damage.
We are subject to payments-related risks that could increase our operating costs, expose us to fraud, subject us to potential liability and potentially disrupt our business.
We accept payments using a variety of methods, including credit cards, debit cards, gift cards and physical bank checks. These payment options subject us to many compliance requirements, including, but not limited to, compliance with the Payment Card Industry Data Security Standards, which represents a common set of industry tools and measurements to help ensure the safe handling of sensitive information. They also subject us to potential fraud by criminal elements seeking to discover and take advantage of security vulnerabilities that may exist in some of these payment systems. For certain payment methods, including credit cards and debit cards, we pay interchange and other fees, which may increase over time and raise our operating costs and lower profitability. We rely on third parties to provide payment processing services, including the processing of credit cards, debit cards and gift cards, and it could disrupt our business if these companies become unwilling or unable to provide these services to us. We are also subject to payment card association operating rules, including data security rules, certification requirements, and rules governing electronic funds transfers, which could change or be reinterpreted to make it difficult or impossible for us to comply. If we fail to comply with these rules or requirements, or if our data security systems are breached or compromised, there is the potential that parties could seek damages from us, we may be liable for card issuing banks' costs, subject to fines and higher transaction fees, and lose our ability to accept credit cards and debit card payments from our customers, process electronic funds transfers, or facilitate other types of online payments, we could lose the confidence of customers and our business, financial condition and operating results could be adversely affected. We may also need to expend significant management and financial resources to become or remain compliant with relevant standards and requirements, which could divert resources from other initiatives and adversely affect our business, financial condition and operating results.
Our facilities and systems, as well as those of our suppliers, are vulnerable to natural disasters and other unexpected events, and as a result we may lose merchandise and be unable to effectively deliver it to our stores.
Our retail stores, store support center and distribution centers, as well as the operations of our suppliers from which we receive goods and services, are vulnerable to damage from earthquakes, tornadoes, hurricanes, fires, floods and similar events. If any of these events result in damage to our facilities, systems or equipment, or those of our suppliers, they could adversely affect our ability to stock our stores and deliver products to our customers, and could adversely affect our net sales and
32
operating results. In addition, we may incur costs in repairing any damage beyond our applicable insurance coverage. In particular, any disruption to any of our distribution centers could have a material impact on our business.
Material damage to, or interruptions in, our information systems as a result of external factors, staffing shortages and difficulties in updating our existing software or developing or implementing new software could adversely affect our business, financial condition and operating results.
We depend largely upon our information technology systems in the conduct of all aspects of our operations. Such systems are subject to damage or interruption from power outages, computer and telecommunications failures, computer viruses and security breaches. Damage or interruption to our information systems may require a significant investment to fix or replace them, and we may suffer interruptions in our operations in the interim including issues operating our distribution centers and/or managing our inventory. In addition, costs and potential problems and interruptions associated with the implementation of new or upgraded systems and technology, or with maintenance or adequate support of existing systems, could also disrupt or reduce the efficiency of our operations. Further, the software programs supporting many of our systems were licensed to us by independent software developers. The inability of these developers or us to continue to maintain and upgrade these information systems and software programs would disrupt or reduce the efficiency of our operations if we were unable to convert to alternate systems in an efficient and timely manner and could adversely affect our business, financial condition and operating results. Any material interruptions or failures in our information systems may adversely affect our business, financial condition and operating results.
As we have a high concentration of stores in the southern region of the United States, we are subject to regional risks.
We have a high concentration of stores in the southern region of the United States. If this market suffers an economic downturn or other significant adverse event, our comparable store sales, net sales, profitability and the ability to implement our planned expansion could be adversely affected. Any natural disaster, extended adverse weather or other serious disruption in this market due to fire, tornado, hurricane, or any other calamity could damage inventory and could result in decreased net sales.
Our success depends substantially upon the continued retention of our key personnel, which we consider to be our executive officers.
We believe that our success has depended and continues to depend to a significant extent on the efforts and abilities of our key personnel, which we consider to be our executive officers. We have employment agreements with each of our executive officers. See "Executive And Director Compensation—Fiscal 2016 Compensation—Elements of Our Executive Compensation Program—Employment Agreements." Our failure to retain members of that team could impede our ability to build on the efforts they have undertaken with respect to our business.
We do not maintain "key man" life insurance policies on our key personnel.
We do not have "key man" life insurance policies for any of our key personnel. If we were to obtain "key man" insurance for our key personnel, there can be no assurance that the amounts of such policies would be sufficient to pay losses experienced by us as a result of the loss of any of those personnel.
33
Our success depends upon our ability to attract, train and retain highly qualified managers and staff.
Our success depends in part on our ability to attract, hire, train and retain qualified managers and staff. Purchasing hard surface flooring is an infrequent event for BIY and DIY consumers, and the typical consumer in these groups has little knowledge of the range, characteristics and suitability of the products available before starting the purchasing process. Therefore, consumers in the hard surface flooring market expect to have sales associates serving them who are knowledgeable about the entire assortment of products offered by the retailer and the process of choosing and installing hard surface flooring.
Each of our stores is managed by a store manager who has the flexibility (with the support of regional managers) to use his or her knowledge of local market dynamics to customize each store in a way that is most likely to increase net sales and profitability. Our store managers are also expected to anticipate, gauge and quickly respond to changing consumer demands in these markets. Further, it generally takes a substantial amount of time for our store managers to develop the entrepreneurial skills that we expect them to have in order to make our stores successful.
There is a high level of competition for qualified regional managers, store managers and sales associates among home improvement and flooring retailers in local markets, and as a result, we may not succeed in attracting and retaining the personnel we require to conduct our current operations and support our plans for expansion. If our recruiting and retention efforts are not successful, we may have a shortage of qualified employees in future periods. Any such shortage would decrease our ability to effectively serve our customers. Such a shortage would also likely lead to higher wages for employees and a corresponding reduction in our operating results. In addition, as we expand into new markets, we may find it more difficult to hire, develop and retain qualified employees and may experience increased labor costs. Any failure by us to attract, train and retain highly qualified managers and staff could adversely affect our operating results and future growth opportunities.
The effectiveness of our advertising strategy is a driver of our future success.
We believe that our growth was in part a result of our successful investment in local advertising. As we enter new markets that often have more expensive advertising rates, we may need to increase our advertising expenses to broaden the reach and frequency of our advertising to increase the recognition of our brand. If our advertisements fail to draw customers in the future, or if the cost of advertising or other marketing materials increases significantly, we could experience declines in our net sales and operating results.
Our intellectual property rights are valuable, and any failure to protect them could reduce the value of our products and brand and harm our business.
We regard our intellectual property as having significant value, and our brand is an important factor in the marketing of our products. However, we cannot assure you that the steps we take to protect our trademarks or intellectual property will be adequate to prevent others from copying or using our trademarks or intellectual property without authorization. If our trademarks or intellectual property are copied or used without authorization, the value of our brand, its reputation, our competitive advantages and our goodwill could be harmed.
We may be involved in disputes from time to time relating to our intellectual property and the intellectual property of third parties.
We may become parties to disputes from time to time over rights and obligations concerning intellectual property, and we may not prevail in these disputes. Third parties may raise claims against us alleging infringement or violation of the intellectual property of that third-party. Even if we prevail in such disputes, the costs we incur in defending such dispute may be material and costly. Some third-
34
party intellectual property rights may be extremely broad, and it may not be possible for us to conduct our operations in such a way as to avoid violating those intellectual property rights. Any such intellectual property claim could subject us to costly litigation and impose a significant strain on our financial resources and management personnel regardless of whether such claim has merit. The liability insurance we maintain may not adequately cover potential claims of this type, and we may be required to pay monetary damages or license fees to third parties, which could have a material adverse effect on our business, financial condition and operating results.
Our ability to control higher health care costs is limited and could adversely affect our business, financial condition and operating results.
With the passage in 2010 of the U.S. Patient Protection and Affordable Care Act (as amended, the "Affordable Care Act"), we are required to provide affordable coverage, as defined in the Affordable Care Act, to all employees, or otherwise be subject to a payment per employee based on the affordability criteria in the Affordable Care Act. Additionally, some states and localities have passed state and local laws mandating the provision of certain levels of health benefits by some employers. These requirements limit our ability to control employee health care costs.
Efforts to modify, repeal or otherwise invalidate all, or certain provisions of, the Affordable Care Act and/or adopt a replacement healthcare reform law may impact our employee healthcare costs. At this time, there is uncertainty concerning whether the Affordable Care Act will be repealed or what requirements will be included in a new law, if enacted. If health care costs rise, we may experience increased operating costs, which may adversely affect our business, financial condition and operating results.
We are a holding company with no business operations of our own and depend on cash flow from our subsidiaries to meet our obligations.
We are a holding company with no business operations of our own or material assets other than the equity of our subsidiaries. All of our operations are conducted by our subsidiaries. As a holding company, we will require dividends and other payments from our subsidiaries to meet cash requirements.
The terms of our ABL Facility, a $200 million asset-based revolving credit facility, and our Term Loan Facility, a $350 million senior secured term loan facility, restrict our subsidiaries from paying dividends and otherwise transferring cash or other assets to us except in certain limited circumstances. If we become insolvent or there is a liquidation or other reorganization of any of our subsidiaries, our stockholders likely will have no right to proceed against their assets. Creditors of those subsidiaries will be entitled to payment in full from the sale or other disposal of the assets of those subsidiaries before we, as an equity holder, would be entitled to receive any distribution from that sale or disposal. If our subsidiaries are unable to pay dividends or make other payments to us when needed, we will be unable to satisfy our obligations.
We face risks related to our indebtedness.
As of , 2017, we were highly leveraged and the principal amount of our total indebtedness was approximately $ million (including $ million of indebtedness outstanding under the Term Loan Facility). In addition, as of , 2017, we had the ability to access $ million of unused borrowings then available under the ABL Facility without violating any covenants thereunder and had $ million in outstanding letters of credit.
As set forth under "Use of Proceeds," after giving effect to our use of the net proceeds from this offering, the principal amount of our total indebtedness would have been approximately $ million as of December 29, 2016.
35
Our indebtedness, combined with our lease and other financial obligations and contractual commitments, could adversely affect our business, financial condition and operating results by:
We may also incur substantial additional indebtedness in the future, subject to the restrictions contained in our Credit Facilities. If such new indebtedness is in an amount greater than our current debt levels, the related risks that we now face could intensify. However, we cannot assure you that any such additional financing will be available to us on acceptable terms or at all.
Significant amounts of cash are required to service our indebtedness and operating lease obligations, and any failure to meet our debt service obligations could adversely affect our business, financial condition and operating results.
Our ability to pay interest on and principal of our debt obligations will primarily depend upon our future operating performance. As a result, prevailing economic conditions and financial, business and other factors, many of which are beyond our control, will affect our ability to make these payments.
If we do not generate sufficient cash flow from operations to satisfy our debt service obligations, we may have to undertake alternative financing plans, such as refinancing or restructuring our indebtedness, selling our assets, reducing or delaying capital investments or seeking to raise additional capital. Our ability to restructure or refinance our debt will depend on the condition of the capital markets and our financial condition at such time. Any refinancing of our debt could be at higher interest rates and may require us to comply with more onerous covenants, which could further restrict our business operations. The terms of existing or future debt instruments may restrict us from adopting some of these alternatives. In addition, any failure to make payments of interest and principal on our outstanding indebtedness on a timely basis would likely result in a reduction of our credit rating, which could harm our ability to incur additional indebtedness on acceptable terms.
36
See "Management's Discussion and Analysis of Financial Condition and Results of Operations—Liquidity and Capital Resources—Our Credit Facilities."
Our inability to generate sufficient cash flow to satisfy our debt obligations, or to refinance our obligations at all or on acceptable terms, could have an adverse effect on our business, financial condition and operating results.
We cannot assure you that our business will generate sufficient cash flow from operations or that future borrowings will be available to us in amounts sufficient to enable us to make payments on our indebtedness or to fund our operations.
Our debt agreements contain restrictions that may limit our flexibility in operating our business.
We are a holding company, and accordingly, substantially all of our operations are conducted through our subsidiaries. The credit agreements governing our Credit Facilities contain, and any future indebtedness would likely contain, a number of restrictive covenants that impose significant operating and financial restrictions, including restrictions on our ability to engage in acts that may be in our best long-term interests. The credit agreements governing our Credit Facilities include covenants that, among other things, restrict our and our subsidiaries' ability to:
Based on the foregoing factors, the operating and financial restrictions and covenants in our current debt agreements and any future financing agreements could adversely affect our ability to finance future operations or capital needs or to engage in other business activities.
In addition, a breach of any of the restrictive covenants in our Credit Facilities may constitute an event of default, permitting the lenders to declare all outstanding indebtedness under both our Credit Facilities to be immediately due and payable or to enforce their security interest, which could adversely affect our ability to respond to changes in our business and manage our operations. Upon the occurrence of an event of default under any of the agreements governing our Credit Facilities, the lenders could elect to declare all amounts outstanding to be due and payable and exercise other remedies as set forth in the credit agreements. If any of our indebtedness under either of our Credit Facilities were to be accelerated, there can be no assurance that our assets would be sufficient to repay this indebtedness in full, which could adversely affect our ability to continue to operate as a going concern. See "Management's Discussion and Analysis of Financial Condition and Results of Operations—Liquidity and Capital Resources—Our Credit Facilities" for more information.
37
Our fixed lease obligations could adversely affect our operating results.
We are required to use a significant portion of cash generated by our operations to satisfy our fixed lease obligations, which could adversely affect our ability to obtain future financing to support our growth or other operational investments. We will require substantial cash flows from operations to make our payments under our operating leases, all of which provide for periodic increases in rent. As of December 29, 2016, our minimum annual rental obligations under long-term operating leases for the fiscal years ending December 28, 2017, December 27, 2018 and December 26, 2019 are approximately $63.3 million, $71.9 million and $73.6 million, respectively. If we are not able to make payments under our operating leases, this could trigger defaults under other leases or, in certain circumstances, under our Credit Facilities, which could cause the counterparties or lenders under those agreements to accelerate the obligations due thereunder.
Changes to accounting rules or regulations could adversely affect our operating results.
Our consolidated financial statements are prepared in accordance with GAAP. New accounting rules or regulations and changes to existing accounting rules or regulations have occurred and may occur in the future. Future changes to accounting rules or regulations, such as changes to revenue recognition or lease accounting guidance or a requirement to convert to international financial reporting standards, could adversely affect our operating results through increased cost of compliance.
Risks Related to this Offering and Ownership of Our Common Stock
You may not be able to resell your shares at or above the offering price or at all, and our stock price may be volatile, which could result in a significant loss or impairment of your investment.
Prior to this offering, there has been no public market for our common stock. An active public market for our common stock may not develop or be sustained after this offering, in which case it may be difficult for you to sell your shares of our common stock at a price that is attractive to you or at all. The price of our common stock in any such market may be higher or lower than the price that you pay in this offering. If you purchase shares of our common stock in this offering, you will pay a price that was not established in a competitive market. Rather, you will pay the price that we negotiated with the representatives of the underwriters, which may not be indicative of prices that will prevail in the trading market.
The trading price of our common stock may be volatile and subject to wide price fluctuations in response to various factors, many of which are beyond our control, including those described above in "—Risks Related to Our Business" and the following:
38
Furthermore, the stock markets have experienced extreme price and volume fluctuations that have affected and continue to affect the market prices of equity securities of many companies. These fluctuations sometimes have been unrelated or disproportionate to the operating performance of those companies. These and other factors may cause the market price and demand for our common stock to fluctuate substantially, which may limit or prevent investors from readily selling their shares of common stock and may otherwise adversely affect the price or liquidity of our common stock.
In addition, in the past, when the market price of a stock has been volatile, holders of that stock have sometimes instituted securities class action litigation against the company that issued the stock. If any of our stockholders were to bring a lawsuit against us, we could incur substantial costs defending it or paying for settlements or damages. Such a lawsuit could also divert the time and attention of our management from our operating business. As a result, such litigation may adversely affect our business, financial condition and operating results.
If securities or industry analysts do not publish or cease publishing research or reports about us, our business, our market, or our competitors, or if they change their recommendations regarding our common stock in a negative way, the price and trading volume of our common stock could decline.
The trading market for our common stock will be influenced by the research and reports that industry or securities analysts may publish about us, our business, our market, or our competitors. If any of the analysts who cover us change their recommendation regarding our common stock in a negative way, or provide more favorable relative recommendations about our competitors, the price of our common stock would likely decline. If any analyst who covers us were to cease coverage of us or fail to regularly publish reports on us, we could lose visibility in the financial markets, which in turn could cause our common stock price or trading volume to decline.
The large number of shares eligible for public sale in the future, or the perception of the public that these sales may occur, could depress the market price of our common stock.
The market price of our common stock could decline as a result of (i) sales of a large number of shares of our common stock in the market after this offering, particularly sales by our directors, employees (including our executive officers) and significant stockholders, and (ii) a large number of shares of our common stock being registered or offered for sale. These sales, or the perception that
39
these sales could occur, may depress the market price of our common stock. We will have shares of common stock outstanding after this offering (or shares if the underwriters' exercise their option to purchase additional shares in full). Of these shares, the common stock sold in this offering will be freely tradable.
Additionally, as of the closing of this offering, shares of our common stock will be issuable upon exercise of stock options that vest and are exercisable at various dates through , 2026, with an average weighted exercise price of $ per share. Of such options, are currently exercisable. As soon as practicable after the closing of this offering, we intend to file a registration statement on Form S-8 under the Securities Act to register shares of our common stock issued or reserved for issuance under the Incentive Plans. The Form S-8 registration statement will become effective immediately upon filing, and shares covered by that registration statement will thereupon be eligible for sale in the public markets, subject to vesting restrictions, the lock-up agreements described below and the limitations of Rule 144 under the Securities Act ("Rule 144") applicable to affiliates.
We and certain of our stockholders, directors and officers have agreed to a "lock-up," pursuant to which neither we nor they will sell any shares without the prior consent of the representatives of the underwriters for 180 days after the date of this prospectus, subject to certain exceptions and extensions under certain circumstances. Following the expiration of the applicable lock-up period, all of our shares of common stock will be eligible for future sale, subject to the applicable volume, manner of sale, holding period and other limitations of Rule 144. In addition, our Sponsors have certain demand registration rights, and all of our stockholders have "piggy-back" registration rights with respect to the common stock that they will retain following this offering. See "Shares Eligible for Future Sale" and "Description of Capital Stock—Registration Rights" for a discussion of the shares of common stock that may be sold into the public market in the future, including common stock held by Ares and Freeman Spogli.
You will incur immediate and substantial dilution in your investment because our earlier investors paid less than the initial public offering price when they purchased their shares.
If you purchase shares in this offering, you will incur immediate dilution of $ in net tangible book value per share (or $ if the underwriters exercise their option to purchase additional shares in full), based on an assumed initial public offering price of $ per share, the midpoint of the price range set forth on the cover page of this prospectus, because the price that you pay will be greater than the net tangible book value per share of the shares acquired. This dilution arises because our earlier investors paid less than the initial public offering price when they purchased their shares of our common stock. Furthermore, there will be options to purchase shares of common stock outstanding upon the closing of this offering that have exercise prices below the initial public offering price. To the extent such options are exercised in the future, there may be further dilution to new investors. See "Dilution."
In the future, we expect to issue stock options, restricted stock and/or other forms of stock-based compensation, which have the potential to dilute stockholders' value and cause the price of our common stock to decline.
In the future, we expect to offer stock options, restricted stock and/or other forms of stock based compensation to our eligible employees, consultants and Compensated Directors (as defined in "Executive and Director Compensation—Compensation of our Directors for Fiscal 2016—Director Compensation"). If we grant more equity awards to attract and retain key personnel, the expenses associated with such additional equity awards could materially adversely affect our results of operations and may also result in additional dilution to our stockholders. If any options that we issue are exercised or any restrictions on restricted stock that we issue lapse and those shares are sold into the public market, the market price of our common stock may decline. In addition, the availability of shares of common stock for award under the Incentive Plans or the grant of stock options, restricted stock or other forms of stock based compensation may adversely affect the market price of our common stock.
40
Our dual-class capitalization structure and the conversion features of our Class C common stock may dilute the voting power of the holders of our Class A common stock.
Following the closing of this offering, we will have a dual-class capitalization structure, which may pose a significant risk of dilution to our Class A common stockholders. The shares of our Class C common stock are automatically converted into shares of our Class A common stock on the basis of one share of Class A common stock for each share of Class C common stock in the event that the holder of such Class C common stock is not Freeman Spogli or any of its affiliates. In addition, Freeman Spogli or any of its affiliates may convert their shares of Class C common stock into shares of our Class A Common Stock, in whole or in part, at any time and from time to time at their option, on the basis of one share of Class A common stock for each share of Class C common stock so long as at such time either Ares and its affiliates or Freeman Spogli and its affiliates do not own more than 24.9% of our Class A common stock after giving effect to any such conversion. Conversion of our Class C common stock into Class A common stock would dilute the voting power of the holders of Class A common stock, including holders of shares purchased in this offering.
Our ability to raise capital in the future may be limited.
Our business and operations may consume resources faster than we anticipate. In the future, we may need to raise additional funds through the issuance of new equity securities, debt or a combination of both. Additional financing may not be available on favorable terms or at all. If adequate funds are not available on acceptable terms, we may be unable to fund our capital requirements. If we issue new debt securities, the debt holders would have rights senior to holders of our common stock to make claims on our assets and the terms of any debt could restrict our operations, including our ability to pay dividends on our common stock. If we issue additional equity securities or securities convertible into equity securities, existing stockholders will experience dilution and the new equity securities could have rights senior to those of our common stock. Because our decision to issue securities in any future offering will depend on market conditions and other factors beyond our control, we cannot predict or estimate the amount, timing or nature of our future offerings. Thus, you bear the risk of our future securities offerings reducing the market price of our common stock and diluting their interest.
Our principal stockholders will continue to have substantial control over us after this offering, will be able to influence corporate matters and may take actions that conflict with your interests and have the effect of delaying or preventing changes of control or changes in management, or limiting the ability of other stockholders to approve transactions they deem to be in their best interest.
Upon the closing of this offering, our directors, executive officers and holders of more than 5% of our Class A common stock, together with their affiliates, will beneficially own, in the aggregate, approximately % of our outstanding Class A common stock, assuming no exercise of the underwriters' option to purchase additional shares. Ares will beneficially own, in the aggregate, approximately % of our outstanding Class A common stock and Freeman Spogli will beneficially own, in the aggregate, approximately % of our outstanding Class A common stock and 100% of our outstanding Class C common stock. These amounts compare to approximately % of our outstanding Class A common stock represented by the shares sold by us in this offering, assuming no exercise of the underwriters' option to purchase additional shares. As a result, these stockholders acting together, or Ares or Freeman Spogli acting alone, will be able to exercise significant influence over all matters requiring stockholder approval, including the election of directors and approval of significant corporate transactions, such as a merger or other sale of us or our assets. The Investor Rights Agreement also contains agreements among our Sponsors with respect to voting on the election of directors and board committee membership. See also "—Our dual-class capitalization structure and the conversion features of our Class C common stock may dilute the voting power of the holders of our
41
Class A common stock." The interests of Ares or Freeman Spogli could conflict in material respects with yours, and this concentration of ownership could limit your ability to influence corporate matters and may have the effect of delaying or preventing a third-party from acquiring control over us. Mr. Kaplan and Ms. Lee serve as officers and principals of certain Ares affiliated entities. In addition, NAX 18, LLC, a consulting entity controlled by Mr. Axelrod, provides consulting services to certain Ares affiliated entities. Messrs. Brutocao and Roth serve as officers and principals of certain Freeman Spogli affiliated entities. In addition, Peter Starrett Associates, a consulting entity controlled by Mr. Starrett, provides consulting services to certain Freeman Spogli affiliated entities. Our certificate of incorporation provides that no officer or director of ours who is also an officer, director, employee, managing director or other affiliate of our Sponsors will be liable to us or our stockholders for breach of any fiduciary duty by reason of the fact that any such individual directs a corporate opportunity to our Sponsors instead of us, or does not communicate information regarding a corporate opportunity to us that the officer, director, employee, managing director or other affiliate has directed to our Sponsors.
Although we do not expect to rely on the "controlled company" exemption, since we will qualify as a "controlled company" within the meaning of the rules of the New York Stock Exchange upon completion of this offering, we will qualify for exemptions from certain corporate governance requirements.
Under the rules of the New York Stock Exchange, a company of which more than 50% of the voting power is held by another person or group of persons acting together is a "controlled company" and may elect not to comply with certain rules of the New York Stock Exchange regarding corporate governance, including:
These requirements will not apply to us as long as we remain a "controlled company." Although we will qualify as a "controlled company" upon completion of this offering, we do not expect to rely on this exemption, and we intend to fully comply with all corporate governance requirements under the rules of the New York Stock Exchange. However, if we were to utilize some or all of these exemptions, you may not have the same protections afforded to stockholders of companies that are subject to all of the rules of the New York Stock Exchange regarding corporate governance.
We do not currently expect to pay any cash dividends.
The continued operation and growth of our business will require substantial funding. Accordingly, we do not currently expect to pay any cash dividends on shares of our common stock. Any determination to pay dividends in the future will be at the discretion of our board of directors and will depend upon our operating results, financial condition, contractual restrictions, restrictions imposed by applicable law and other factors our board of directors deem relevant. Additionally, under our Credit Facilities, our subsidiaries are currently restricted from paying cash dividends except in limited circumstances, and we expect these restrictions to continue in the future. Accordingly, if you purchase shares in this offering, realization of a gain on your investment will depend on the appreciation of the
42
price of our common stock, which may never occur. Investors seeking cash dividends in the foreseeable future should not purchase our common stock. See "Dividend Policy."
We will incur significant expenses as a result of becoming a public company, which will negatively impact our financial performance and could cause our results of operations or financial condition to suffer.
As a public company, we will incur significant legal, accounting, insurance and other expenses that we have not incurred as a private company, including costs associated with public company reporting requirements. We also have incurred and will incur costs associated with the Sarbanes-Oxley Act, Dodd-Frank Wall Street Reform and Consumer Protection Act and related rules implemented by the Securities and Exchange Commission ("SEC"). The expenses incurred by public companies generally for reporting and corporate governance purposes have been increasing. We expect these rules and regulations to increase our legal and financial compliance costs and to make some activities more time-consuming and costly, although we are currently unable to estimate these costs with any degree of certainty. In estimating these costs, we took into account expenses related to insurance, legal, accounting, and compliance activities, as well as other expenses not currently incurred. These laws and regulations could also make it more difficult or costly for us to obtain certain types of insurance, including director and officer liability insurance, and we may be forced to accept reduced policy limits and coverage or incur substantially higher costs to obtain the same or similar coverage. These laws and regulations could also make it more difficult for us to attract and retain qualified persons to serve on our board of directors, our board committees or as our executive officers. Furthermore, if we are unable to satisfy our obligations as a public company, we could be subject to delisting of our Class A common stock, fines, sanctions and other regulatory action and potentially civil litigation.
Failure to establish and maintain effective internal controls in accordance with Section 404 of the Sarbanes-Oxley Act could have an adverse effect on our business and stock price.
We are not currently required to comply with the rules of the SEC implementing Section 404 of the Sarbanes-Oxley Act and are therefore not required to make a formal assessment of the effectiveness of our internal controls over financial reporting for that purpose. Upon becoming a public company, we will be required to comply with the SEC's rules implementing Sections 302 and 404 of the Sarbanes-Oxley Act, which will require management to certify financial and other information in our quarterly and annual reports and provide an annual management report on the effectiveness of controls over financial reporting. Though we will be required to disclose changes made in our internal controls and procedures on a quarterly basis, we will not be required to make our first annual assessment of our internal controls over financial reporting pursuant to Section 404 until the year following our first annual report required to be filed with the SEC.
To comply with the requirements of being a public company, we may need to undertake various actions, such as implementing new internal controls and procedures and hiring additional accounting or internal audit staff. Testing and maintaining internal controls can divert our management's attention from other matters that are important to the operation of our business. In addition, when evaluating our internal controls over financial reporting, we may identify material weaknesses that we may not be able to remediate in time to meet the applicable deadline imposed upon us for compliance with the requirements of Section 404. If we identify material weaknesses in our internal controls over financial reporting or are unable to comply with the requirements of Section 404 in a timely manner or assert that our internal controls over financial reporting are effective, or if our independent registered public accounting firm is unable to express an opinion as to the effectiveness of our internal controls over financial reporting, investors may lose confidence in the accuracy and completeness of our financial reports and the market price of our common stock could be negatively affected, and we could become subject to investigations by the New York Stock Exchange, the SEC or other regulatory authorities, which could require additional financial and management resources.
43
Anti-takeover provisions could impair a takeover attempt and adversely affect existing stockholders and the market value of our common stock.
Certain provisions of our certificate of incorporation and bylaws that will be in effect upon the closing of this offering and applicable provisions of Delaware law may have the effect of rendering more difficult, delaying or preventing an acquisition of our company, even when this would be in the best interest of our stockholders. These provisions include:
Further, Delaware law imposes conditions on the voting of "control shares" and on certain business combination transactions with "interested stockholders."
Our issuance of shares of preferred stock could delay or prevent a change of control of the Company. Our board of directors has the authority to cause us to issue, without any further vote or action by our stockholders, up to shares of preferred stock, par value $0.001 per share, in one or more series, to designate the number of shares constituting any series and to fix the rights, preferences, privileges and restrictions thereof, including dividend rights, voting rights, rights and terms of redemption, redemption price or prices and liquidation preferences of such series. The issuance of shares of preferred stock may have the effect of delaying, deferring or preventing a change in control of our company without further action by our stockholders, even where stockholders are offered a premium for their shares.
In addition, the issuance of shares of preferred stock with voting rights may adversely affect the voting power of the holders of our other classes of voting stock either by diluting the voting power of our other classes of voting stock if they vote together as a single class, or by giving the holders of any
44
such preferred stock the right to block an action on which they have a separate class vote even if the action were approved by the holders of our other classes of voting stock.
These provisions could delay or prevent hostile takeovers and changes in control or changes in our management. Also, the issuance of shares of preferred stock with dividend or conversion rights, liquidation preferences or other economic terms favorable to the holders of preferred stock could adversely affect the market price for our common stock by making an investment in our common stock less attractive. For example, a conversion feature could cause the trading price of our common stock to decline to the conversion price of the preferred stock. Any provision of our certificate of incorporation or bylaws or Delaware law that has the effect of delaying or deterring a change in control or otherwise makes an investment in our common stock less attractive could limit the opportunity for our stockholders to receive a premium for their shares of our common stock and could also affect the price that some investors are willing to pay for our common stock. See "Description of Capital Stock."
45
SPECIAL NOTE REGARDING FORWARD-LOOKING STATEMENTS
This prospectus contains forward-looking statements. All statements other than statements of historical fact contained in this prospectus, including statements regarding our future operating results and financial position, business strategy and plans and objectives of management for future operations, are forward-looking statements. These statements involve known and unknown risks, uncertainties and other important factors that may cause our actual results, performance or achievements to be materially different from any future results, performance or achievements expressed or implied by the forward-looking statements.
In some cases, you can identify forward-looking statements by terms such as "may," "will," "should," "expects," "intends," "plans," "anticipates," "could," "seeks," "intends," "target," "projects," "contemplates," "believes," "estimates," "predicts," "budget," "potential" or "continue" or the negative of these terms or other similar expressions. The forward-looking statements in this prospectus are only predictions. Although we believe that the expectations reflected in the forward-looking statements in this prospectus are reasonable, we cannot guarantee future events, results, performance or achievements. A number of important factors could cause actual results to differ materially from those indicated by the forward-looking statements in this prospectus, including, without limitation, those factors described in "Risk Factors" and "Management's Discussion and Analysis of Financial Condition and Results of Operations." Some of the key factors that could cause actual results to differ from our expectations include the following:
46
Because forward-looking statements are inherently subject to risks and uncertainties, some of which cannot be predicted or quantified, you should not rely on these forward-looking statements as predictions of future events. The forward-looking statements contained in this prospectus speak only as of the date hereof. New risks and uncertainties arise over time, and it is not possible for us to predict those events or how they may affect us. If a change to the events and circumstances reflected in our forward-looking statements occurs, our business, financial condition and operating results may vary materially from those expressed in our forward-looking statements. Except as required by applicable law, we do not plan to publicly update or revise any forward-looking statements contained herein after we distribute this prospectus, whether as a result of any new information, future events or otherwise.
47
FISCAL YEAR AND CERTAIN FINANCIAL MEASURES AND TERMS
Fiscal Year
We operate on a 52- or 53-week fiscal year ending on the Thursday on or preceding December 31. When a 53-week fiscal year occurs, we report the additional week at the end of the fiscal fourth quarter. 52-week fiscal years consist of thirteen-week periods in the first, second, third and fourth quarters of the fiscal year. Fiscal 2012, 2013, 2014 and 2016 included 52-weeks and ended on December 27, 2012, December 26, 2013, December 25, 2014 and December 29, 2016, respectively. Fiscal 2015 ended on December 31, 2015 and was comprised of 53-weeks.
Certain Financial Measures and Terms
In this prospectus, in addition to presenting our financial data in accordance with accounting principles generally accepted in the United States (referred to as "GAAP"), we present certain other financial measures, such as EBITDA, Adjusted EBITDA, Adjusted EBITDA margin, CAGR, comparable store sales and net working capital. We define these terms, other than EBITDA and Adjusted EBITDA, as follows:
"Adjusted EBITDA margin" means, for any period, the Adjusted EBITDA for that period divided by the net sales for that period.
"CAGR" means compound annual growth rate.
"Comparable store sales" include net sales from our stores beginning on the first day of the thirteenth full fiscal month following the store's opening. Because our e-commerce sales are fulfilled by individual stores, they are included in comparable store sales only to the extent such fulfilling store meets the above mentioned store criteria.
"Net working capital" means, as of any date, current assets (excluding cash and cash equivalents) less current liabilities (excluding the current portion of long-term debt).
For definitions of EBITDA and Adjusted EBITDA and reconciliations of those measures to the most directly comparable GAAP measures, see "Prospectus Summary—Summary Consolidated Financial and Other Data" and "Selected Consolidated Financial Data." The use of certain of these measures is also discussed under "Management's Discussion and Analysis of Financial Condition and Results of Operations—Key Performance Indicators." These financial measures are intended to provide additional information only and do not have any standard meanings prescribed by GAAP. Use of these terms differs among companies in the retail industry, and therefore measures disclosed by us may not be comparable to measures disclosed by other companies. Each of these financial measures has its limitations as an analytical tool, and you should not consider them in isolation or as a substitute for analysis of our results as reported under GAAP.
In addition, when used in this prospectus, unless the context otherwise requires:
"Cash-on-cash returns" means, for any period for a given store, four-wall Adjusted EBITDA for that period for that store, divided by the total initial net cash investment for that store.
"Four-wall Adjusted EBITDA" means, for any period for a given store, the Adjusted EBITDA for that period before corporate general and administrative, distribution center expenses, and pre-opening expenses, which we consider in our evaluation of the ongoing performance of our stores from period to period.
"Pre-tax payback" means, for a given store, starting with the first day it is open, the date on which cumulative four-wall Adjusted EBITDA for such store equals our total initial net cash investment for such store.
"Total initial net cash investment" means, for a given store, our initial net cash investment in that store, which consists of initial inventory (net of payables), pre-opening expenses and capital investment (net of tenant improvement allowances).
48
MARKET, INDUSTRY AND OTHER DATA
Unless otherwise indicated, information contained in this prospectus concerning our industry and the markets in which we operate is based on information from independent industry and research organizations, such as Catalina Research, Inc., and other industry publications, surveys and forecasts, and management estimates. Management estimates are derived from publicly available information released by independent industry analysts and other third-party sources, as well as data from our internal research, and are based on assumptions made by us upon reviewing such data and our knowledge of our industry and markets, which we believe to be reasonable. In addition, projections, assumptions and estimates of the future performance of our industry and our future performance are necessarily subject to a high degree of uncertainty and risk due to a variety of factors, including those described in "Risk Factors" and "Special Note Regarding Forward-Looking Statements." These and other factors could cause our results to differ materially from those expressed in the estimates made by the independent industry analysts, other third-party sources and us.
49
We estimate that the net proceeds we will receive from selling common stock in this offering will be approximately $ , after deducting the underwriting discount and estimated offering expenses payable by us (or, if the underwriters exercise their option to purchase additional shares of Class A common stock in full, approximately $ , after deducting the underwriting discount and estimated offering expenses payable by us), based on an assumed initial public offering price of $ per share, the midpoint of the price range set forth on the cover page of this prospectus. A $1.00 increase (decrease) in the assumed initial public offering price of $ per share would increase (decrease) the net proceeds of this offering by approximately $ (or, if the underwriters exercise their option to purchase additional shares in full, approximately $ ). Similarly, a one million share increase (decrease) in the number of shares offered by us, as set forth on the cover of this prospectus, at the assumed initial public offering price of $ per share would increase (decrease) the net proceeds of this offering by approximately $ million (or, if the underwriters exercise their option to purchase additional shares in full, approximately $ ).
We intend to use all of the net proceeds of this offering to repay a portion of the amounts outstanding under the Term Loan Facility, including accrued and unpaid interest. The proceeds of the Term Loan Facility were used to (i) repay our prior senior secured term loan facility with GCI Capital Markets LLC, dated as of May 1, 2013 (the "GCI Facility"), (ii) repay our prior term loan facility with Wells Fargo Bank, N.A., dated as of May 1, 2013, as amended (the "Prior Term Loan Facility"), (iii) pay the Special Dividend (as defined below), (iv) make certain option adjustment payments and (v) repay a portion of our prior asset-based revolving credit facility (the "Prior ABL Facility"). See "Management's Discussion and Analysis of Financial Condition and Results of Operations—Liquidity and Capital Resources."
As of , 2017, we had approximately $ million of indebtedness outstanding under the Term Loan Facility. The interest rate on the Term Loan Facility as of , 2017 was %. The Term Loan Facility matures on September 30, 2023. Any amounts repaid under the Term Loan Facility will not be available for future borrowing following repayment. See "Management's Discussion and Analysis of Financial Condition and Results of Operations—Liquidity and Capital Resources—Our Credit Facilities" for more information.
50
We currently intend to retain all available funds and any future earnings for use in the operation and growth of our business, and therefore we do not currently expect to pay any cash dividends on our common stock. Any future determination to pay dividends will be at the discretion of our board of directors and will depend on then existing conditions, including our operating results, financial condition, contractual restrictions, capital requirements, business prospects and other factors that our board of directors may deem relevant. In addition, our Credit Facilities contain covenants that restrict our ability to pay cash dividends.
In September 2016, in connection with the 2016 Refinancing, we paid our common stockholders a special cash dividend of $202.5 million in the aggregate (the "Special Dividend"). Other than the Special Dividend, we did not declare or pay any cash dividends on our common stock in fiscal 2015 or fiscal 2016.
51
The following table sets forth our capitalization as of December 29, 2016 on:
The table below should be read in conjunction with "Use of Proceeds," "Selected Consolidated Financial Data," "Management's Discussion and Analysis of Financial Condition and Results of Operations," "Description of Capital Stock," and our consolidated financial statements and the related notes included in this prospectus.
| |
As of December 29, 2016 |
||||||
|---|---|---|---|---|---|---|---|
| |
Actual | Pro Forma | |||||
| |
(in thousands, except share data) |
||||||
Cash and cash equivalents |
$ | 451 | $ | ||||
| | | | | | | | |
| | | | | | | | |
| | | | | | | | |
Debt(1): |
|||||||
Term Loan Facility |
$ | 350,000 | $ | ||||
ABL Facility |
50,000 | ||||||
Unamortized debt discount and debt issuance costs |
(9,257 | ) | |||||
| | | | | | | | |
Total debt |
390,743 | ||||||
| | | | | | | | |
Stockholders' equity: |
|||||||
Undesignated preferred stock, par value $0.001 per share; 100,000 shares authorized, no shares issued and outstanding, actual; and shares authorized, no shares issued and outstanding, pro forma |
— | ||||||
Class A common stock, par value $0.001 per share; 500,000 shares authorized, 238,789 shares issued and outstanding, actual; and shares authorized, shares issued and outstanding, pro forma |
— | ||||||
Class B common stock, par value $0.001 per share; 100,000 shares authorized, 1,230 shares issued and outstanding, actual; and shares authorized, no shares issued and outstanding, pro forma |
— | ||||||
Class C common stock, par value $0.001 per share; 500,000 shares authorized, 19,500 shares issued and outstanding, actual; and shares authorized, shares issued and outstanding, pro forma |
— | ||||||
Additional paid-in capital |
117,353 | ||||||
Accumulated other comprehensive loss |
176 | ||||||
Retained earnings(2) |
16,754 | ||||||
| | | | | | | | |
Total stockholders' equity(2) |
134,283 | ||||||
| | | | | | | | |
Total capitalization(2) |
$ | 525,026 | $ | ||||
| | | | | | | | |
| | | | | | | | |
| | | | | | | | |
52
If you invest in our common stock, your interest will be immediately diluted to the extent of the difference between the initial public offering price per share of our common stock and the pro forma net tangible book value per share of our common stock immediately after this offering.
The historical net tangible book value of our common stock as of December 29, 2016 was $ million, or $ per share. Historical net tangible book value is the amount of our total tangible assets less our total liabilities. Historical net tangible book value per share is our historical net tangible book value, divided by the number of outstanding shares of common stock, after giving effect to the -for-one stock split of our common stock to be effected prior to the consummation of this offering.
Pro forma net tangible book value gives effect to (i) the -for-one stock split of our common stock to be effected prior to the consummation of this offering, (ii) the sale by us of shares of common stock in this offering at an assumed initial public offering price of $ per share, the midpoint of the price range set forth on the cover page of this prospectus, after deducting the underwriting discount and estimated offering expenses payable by us, and (iii) the repayment of a portion of the Term Loan Facility from the net proceeds of this offering received by us as described under "Use of Proceeds." As of December 29, 2016, our pro forma net tangible book value would have been approximately $ million, or approximately $ per share. This represents an immediate increase in pro forma net tangible book value of $ per share to our existing stockholders and an immediate dilution of $ per share to investors purchasing common stock in this offering.
The following table illustrates this dilution on a per share basis to new investors:
Assumed initial public offering price per share |
$ | |||
Historical net tangible book value per share as of December 29, 2016 |
||||
Increase in pro forma net tangible book value per share attributable to new investors purchasing shares in this offering |
||||
Pro forma net tangible book value per share after this offering |
||||
Dilution per share to new investors purchasing shares in this offering |
$ | |||
| | | | | |
| | | | | |
| | | | | |
A $1.00 increase (decrease) in the assumed initial public offering price of $ per share would increase (decrease) the pro forma net tangible book value after this offering by $ per share and decrease (increase) the dilution to new investors by approximately $ per share, assuming the number of shares offered by us, as set forth on the cover page of this prospectus, remained the same and after deducting the underwriting discount and estimated offering expenses payable by us.
Similarly, a one million share increase (decrease) in the number of shares offered by us, as set forth on the cover of this prospectus, would increase (decrease) the pro forma net tangible book value after this offering by approximately $ per share and decrease (increase) the dilution to new investors by $ per share, assuming the assumed initial public offering price of $ per share (the midpoint of the price range set forth on the cover of this prospectus) remained the same and after deducting the underwriting discount and estimated offering expenses payable by us.
The table below summarizes, as of December 29, 2016, on a pro forma basis described above, the number of shares of our common stock, the total consideration and the average price per share (i) paid to us by our existing stockholders and (ii) to be paid by new investors purchasing our common stock in this offering at an assumed initial public offering price of $ per share, the midpoint of
53
the price range set forth on the cover page of this prospectus, before deducting the underwriting discount and estimated offering expenses payable by us.
| |
|
|
Total Consideration |
|
||||||||||||
|---|---|---|---|---|---|---|---|---|---|---|---|---|---|---|---|---|
| |
Shares Purchased | |
||||||||||||||
| |
Average Price Per Share |
|||||||||||||||
| |
Number | Percent | Amount | Percent | ||||||||||||
Existing stockholders |
% | $ | % | $ | ||||||||||||
New investors |
% | % | ||||||||||||||
Total |
100.0 | % | $ | 100.0 | % | $ | ||||||||||
A $1.00 increase (decrease) in the assumed initial public offering price of $ per share would increase (decrease) total consideration paid by new investors by $ and increase (decrease) the percentage of total consideration paid by new investors by %, assuming the number of shares offered by us, as set forth on the cover page of this prospectus, remained the same and before deducting the underwriting discount and estimated offering expenses payable by us.
Similarly, a one million share increase (decrease) in the number of shares offered by us, as set forth on the cover of this prospectus, would increase (decrease) total consideration paid by new investors by $ and increase (decrease) the percent of total consideration paid by new investors by %, assuming the assumed initial public offering price of $ per share (the midpoint of the price range set forth on the cover of this prospectus) remained the same and before deducting the underwriting discount and estimated offering expenses payable by us.
If the underwriters' option to purchase additional shares in this offering is exercised in full, the percentage of shares of our common stock held by existing stockholders will be reduced to % of the total number of shares of our common stock outstanding after this offering, and the number of shares held by new investors will increase to shares, or % of the total number of shares of our common stock outstanding after this offering.
The discussion and tables above are based on shares of our common stock outstanding as of December 29, 2016, assuming the -for-one stock split of our common stock to be effected prior to the consummation of this offering, and exclude the following:
If all of these options were exercised, then our existing stockholders, including the holders of these options, would own % and our new investors would own % of the total number of shares of our common stock outstanding upon the closing of this offering. In such event, the total consideration paid by our existing stockholders, including the holders of these options, would be approximately $ million, or %, the total consideration paid by our new investors would be $ million, or %, the average price per share paid by our existing stockholders would be $ , and the average price per share paid by our new investors would be $ .
54
SELECTED CONSOLIDATED FINANCIAL DATA
The following tables set forth our selected consolidated financial data. You should read the following selected consolidated financial data in conjunction with "Management's Discussion and Analysis of Financial Condition and Results of Operations," our unaudited consolidated financial statements, and our consolidated financial statements and the related notes thereto and other financial data included elsewhere in this prospectus. We operate on a 52- or 53-week fiscal year ending on the Thursday on or preceding December 31. The data presented contains references to fiscal 2012, fiscal 2013, fiscal 2014, fiscal 2015 and fiscal 2016, which represent our fiscal years ended December 27, 2012, December 26, 2013, December 25, 2014 and December 29, 2016 all of which were 52-week periods, and December 31, 2015, which was a 53-week period.
We have derived the selected consolidated statement of operations data for fiscal 2014, 2015 and 2016 and the related selected balance sheet data as of fiscal 2015 and 2016 year end from our audited consolidated financial statements, which are included elsewhere in this prospectus. The selected consolidated statement of operations data for fiscal 2012 and 2013 and the selected balance sheet data as of fiscal 2012, 2013, and 2014 year end, have been derived from our audited consolidated financial
55
statements not included in this prospectus. Historical results are not indicative of the results to be expected in the future.
| |
Fiscal year ended | |||||||||||||||
|---|---|---|---|---|---|---|---|---|---|---|---|---|---|---|---|---|
| (in thousands, except share and per share amounts) |
12/27/2012 | 12/26/2013 | 12/25/2014 | 12/31/2015(1) | 12/29/2016 | |||||||||||
Net sales |
$ | 336,745 | $ | 443,995 | $ | 584,588 | $ | 784,012 | $ | 1,050,759 | ||||||
Cost of sales |
202,651 | 274,172 | 355,051 | 471,390 | 621,497 | |||||||||||
| | | | | | | | | | | | | | | | | |
Gross profit |
134,094 | 169,823 | 229,537 | 312,622 | 429,262 | |||||||||||
Selling & store operating expenses |
85,932 | 106,835 | 146,485 | 202,637 | 271,876 | |||||||||||
General & administrative expenses |
20,571 | 30,530 | 38,984 | 49,917 | 64,025 | |||||||||||
Pre-opening expenses |
1,544 | 5,196 | 7,412 | 7,380 | 13,732 | |||||||||||
Litigation settlement |
— | — | — | — | 10,500 | |||||||||||
Executive severance(2) |
— | — | 2,975 | 296 | — | |||||||||||
Casualty gain(3) |
(1,421 | ) | — | — | — | — | ||||||||||
| | | | | | | | | | | | | | | | | |
Operating income |
27,468 | 27,262 | 33,681 | 52,392 | 69,129 | |||||||||||
Interest expense |
6,528 | 7,684 | 8,949 | 9,386 | 12,803 | |||||||||||
Loss on early extinguishment of debt |
— | 1,638 | — | — | 1,813 | |||||||||||
| | | | | | | | | | | | | | | | | |
Income before income taxes |
20,940 | 17,940 | 24,732 | 43,006 | 54,513 | |||||||||||
Provision for income taxes |
8,102 | 6,857 | 9,634 | 16,199 | 11,474 | |||||||||||
| | | | | | | | | | | | | | | | | |
Net income |
$ | 12,838 | $ | 11,083 | $ | 15,098 | $ | 26,807 | $ | 43,039 | ||||||
| | | | | | | | | | | | | | | | | |
| | | | | | | | | | | | | | | | | |
| | | | | | | | | | | | | | | | | |
Earnings per share: |
||||||||||||||||
Basic |
$ | 49.90 | $ | 42.92 | $ | 58.38 | $ | 103.48 | $ | 166.01 | ||||||
Diluted |
$ | 49.88 | $ | 42.55 | $ | 56.73 | $ | 99.99 | $ | 156.63 | ||||||
Weighted average shares outstanding: |
||||||||||||||||
Basic |
257,280 | 258,232 | 258,599 | 259,043 | 259,251 | |||||||||||
Diluted |
257,391 | 260,451 | 266,148 | 268,103 | 274,784 | |||||||||||
| |
Fiscal year ended |
|||
|---|---|---|---|---|
| |
12/29/2016 | |||
Pro forma statement of operations data: |
||||
Pro forma earnings per share(4): |
||||
Basic |
||||
Diluted |
||||
Pro forma weighted average shares outstanding(4): |
||||
Basic |
||||
Diluted |
||||
| |
Fiscal year ended | |||||||||||||||
|---|---|---|---|---|---|---|---|---|---|---|---|---|---|---|---|---|
| (in thousands) |
12/27/2012 | 12/26/2013 | 12/25/2014 | 12/31/2015(1) | 12/29/2016 | |||||||||||
Consolidated statement of cash flows data: |
||||||||||||||||
Net cash provided by (used in) operating activities |
$ | 23,336 | $ | (15,428 | ) | $ | 43,594 | $ | 20,380 | $ | 89,456 | |||||
Net cash used in investing activities |
(10,709 | ) | (25,056 | ) | (39,069 | ) | (45,021 | ) | (74,648 | ) | ||||||
Net cash (used in) provided by financing activities |
(15,777 | ) | 40,487 | (4,421 | ) | 24,680 | (14,675 | ) | ||||||||
56
| |
As of | ||||||||||||||||||
|---|---|---|---|---|---|---|---|---|---|---|---|---|---|---|---|---|---|---|---|
| |
|
|
|
|
12/29/2016 | ||||||||||||||
| (in thousands) |
12/27/2012 | 12/26/2013 | 12/25/2014 | 12/31/2015 | Actual | Pro forma adjusted(5) |
|||||||||||||
Consolidated balance sheet data: |
|||||||||||||||||||
Cash and cash equivalents |
$ | 172 | $ | 175 | $ | 279 | $ | 318 | $ | 451 | |||||||||
Net working capital |
48,025 | 89,311 | 78,577 | 109,565 | 95,550 | ||||||||||||||
Total assets |
480,374 | 555,093 | 635,498 | 748,888 | 831,166 | ||||||||||||||
Total debt(6) |
90,543 | 157,172 | 152,420 | 177,590 | 390,743 | ||||||||||||||
Total stockholders' equity |
275,186 | 264,132 | 282,236 | 312,365 | 134,283 | ||||||||||||||
| |
Fiscal year ended | |||||||||||||||
|---|---|---|---|---|---|---|---|---|---|---|---|---|---|---|---|---|
| |
12/27/2012 | 12/26/2013 | 12/25/2014 | 12/31/2015(1) | 12/29/2016(1) | |||||||||||
Other financial data: |
||||||||||||||||
Comparable store sales growth |
11.7% | 22.1% | 15.8% | 13.5% | 19.4% | |||||||||||
Number of stores open at the end of the period(7) |
31 | 39 | 48 | 58 | 70 | |||||||||||
Adjusted EBITDA (in thousands)(8) |
$ | 34,161 | $ | 41,853 | $ | 58,771 | $ | 80,403 | $ | 122,024 | ||||||
Adjusted EBITDA margin |
10.1% | 9.4% | 10.1% | 10.3% | 11.6% | |||||||||||
57
(in thousands)
|
Fiscal year ended December 29, 2016 |
|||
|---|---|---|---|---|
Net income, as reported |
$ | 43,039 | ||
Net decrease (increase) in interest expense(a) |
||||
Decrease (increase) in income tax expense(b) |
||||
| | | | | |
Pro forma net income |
$ | |||
| | | | | |
| | | | | |
| | | | | |
(in thousands)
|
Fiscal year ended December 29, 2016 |
|||
|---|---|---|---|---|
Interest expense, as reported |
$ | 12,803 | ||
Net increase attributable to 2016 Refinancing(c) |
||||
Decrease attributable to this offering(d) |
||||
Net increase (decrease) |
||||
| | | | | |
Pro forma interest expense |
$ | |||
| | | | | |
| | | | | |
| | | | | |
58
59
location and number of stores opened in that period. We also use Adjusted EBITDA as a basis to determine covenant compliance with respect to our Credit Facilities, to supplement GAAP measures of performance to evaluate the effectiveness of our business strategies, to make budgeting decisions, and to compare our performance against that of other peer companies using similar measures. EBITDA and Adjusted EBITDA are also used by analysts, investors and other interested parties as performance measures to evaluate companies in our industry.
| |
Fiscal year ended | |||||||||||||||
|---|---|---|---|---|---|---|---|---|---|---|---|---|---|---|---|---|
(in thousands)
|
12/27/2012 | 12/26/2013 | 12/25/2014 | 12/31/2015(1) | 12/29/2016 | |||||||||||
Net income |
$ | 12,838 | $ | 11,083 | $ | 15,098 | $ | 26,807 | $ | 43,039 | ||||||
Depreciation and amortization(a) |
4,641 | 6,362 | 11,073 | 16,794 | 25,089 | |||||||||||
Interest expense |
6,528 | 7,684 | 8,949 | 9,386 | 12,803 | |||||||||||
Loss on early extinguishment of debt(b) |
— | 1,638 | — | — | 1,813 | |||||||||||
Income tax expense |
8,102 | 6,857 | 9,634 | 16,199 | 11,474 | |||||||||||
| | | | | | | | | | | | | | | | | |
EBITDA |
32,109 | 33,624 | 44,754 | 69,186 | 94,218 | |||||||||||
Pre-opening expenses(c) |
1,589 | 5,316 | 7,563 | 7,535 | 13,626 | |||||||||||
Stock compensation expense(d) |
978 | 1,869 | 2,323 | 3,258 | 3,229 | |||||||||||
Loss on asset disposal(e) |
157 | 656 | 148 | 128 | 451 | |||||||||||
Executive severance(f) |
— | — | 2,975 | 296 | — | |||||||||||
Executive recruiting/relocation(g) |
751 | 54 | — | — | — | |||||||||||
Legal settlement(h) |
— | — | — | — | 10,500 | |||||||||||
Casualty gain(i) |
(1,421 | ) | — | — | — | — | ||||||||||
Other(j) |
(2 | ) | 334 | 1,008 | — | — | ||||||||||
| | | | | | | | | | | | | | | | | |
Adjusted EBITDA |
$ | 34,161 | $ | 41,853 | $ | 58,771 | $ | 80,403 | $ | 122,024 | ||||||
| | | | | | | | | | | | | | | | | |
| | | | | | | | | | | | | | | | | |
| | | | | | | | | | | | | | | | | |
60
61
MANAGEMENT'S DISCUSSION AND ANALYSIS OF FINANCIAL CONDITION AND
RESULTS OF OPERATIONS
You should read the following discussion and analysis of our financial condition and results of operations together with "Selected Consolidated Financial Data" and our consolidated financial statements and the related notes thereto and other financial information included elsewhere in this prospectus. Some of the information contained in this discussion and analysis or set forth elsewhere in this prospectus includes forward-looking statements that involve risks and uncertainties. You should review the "Special Note Regarding Forward-Looking Statements" and "Risk Factors" sections of this prospectus for a discussion of important factors that could cause actual results to differ materially from the results described in or implied by the forward-looking statements contained in the following discussion and analysis.
We operate on a 52- or 53-week fiscal year ending on the Thursday on or preceding December 31. The following discussion contains references to our fiscal years ended December 25, 2014 and December 29, 2016, which were 52-week periods, and December 31, 2015, which was a 53-week period.
Overview
Founded in 2000, Floor & Decor is a high-growth, differentiated, multi-channel specialty retailer of hard surface flooring and related accessories with 69 warehouse-format stores across 17 states as of December 29, 2016. We believe that we offer the industry's broadest assortment of tile, wood, laminate and natural stone flooring along with decorative and installation accessories at everyday low prices. We appeal to a variety of customers, including our Pro, DIY and BIY customers. Our warehouse-format stores, which average approximately 72,000 square feet, carry on average approximately 3,500 flooring and decorative and installation accessory SKUs, which equates to 1.3 million square feet of flooring products or $2.5 million of inventory at cost. We believe that our inspiring design centers and creative and informative visual merchandising also greatly enhance our customers' experience. In addition to our stores, our website FloorandDecor.com showcases our products.
We believe our strong financial results are a reflection of our consistent and disciplined culture of innovation and reinvestment, creating a differentiated business model in the hard surface flooring category. We have had eight consecutive years of double digit comparable store sales growth averaging 15.3% per year, with a 19.4% increase in fiscal 2016. Net sales increased $266.7 million, or 34.0%, from $784.0 million to $1,050.8 million in fiscal 2015 and fiscal 2016, respectively. Our net sales increased from $584.6 million in fiscal 2014 to $1,050.8 million in fiscal 2016, representing a CAGR of 34.1%. We have expanded our store base from 38 warehouse-format stores at the end of fiscal 2013 to 69 at the end of fiscal 2016, representing a CAGR of 22.0%.
During fiscal 2016, we continued to make long-term key strategic investments, including:
62
We believe that our compelling business model, plus the projected growth of the large and highly fragmented $10 billion hard surface flooring market (in manufacturers' dollars, an estimated $17 billion after the retail markup), provides us with an opportunity to significantly expand our store base in the U.S. from 69 warehouse-format stores as of December 29, 2016 to approximately 400 stores nationwide within the next 15 years based on our internal research with respect to housing density, demographic data, competitor concentration and other variables in both new and existing markets. Over the next several years, we plan to grow our store base by approximately 20% per year. Our ability to open profitable new stores depends on many factors, including the successful selection of new markets and store locations, our ability to negotiate leases on acceptable terms and our ability to attract highly qualified managers and staff. For further information see "Risk Factors—Risks Related to Our Business."
Key Performance Indicators
We consider a variety of performance and financial measures in assessing the performance of our business. The key measures we use to determine how our business is performing are comparable store sales, the number of new store openings, gross profit and gross margin, operating income and EBITDA and Adjusted EBITDA.
Comparable Store Sales
Our comparable store sales growth is a significant driver of our net sales, profitability, cash flow and overall business results. We believe that comparable store sales growth is generated by continued focus on providing a dynamic and expanding product assortment in addition to other merchandising initiatives, quality of customer service, enhancing sales and marketing strategies, improving visual merchandising and overall aesthetic appeal of stores and website, effectively serving our Pro customers, continued investment in store staff and infrastructure, growing our proprietary credit offering, and further integrating connected customer strategies and other key information technology enhancements.
Comparable store sales refer to period-over-period comparisons of our net sales among the comparable store base. A store is included in the comparable store sales calculation on the first day of the thirteenth full fiscal month following a store's opening, which is when we believe comparability has been achieved. Since our e-commerce sales are fulfilled by individual stores, they are included in comparable store sales only to the extent such fulfilling store meets the above mentioned store criteria. Changes in our comparable store sales between two periods are based on net sales for stores that were in operation during both of the two periods. Any change in square footage of an existing comparable store, including remodels and relocations, does not eliminate that store from inclusion in the calculation of comparable store sales. Stores that are closed temporarily and relocated within their primary trade areas are included in same store sales. Additionally, any stores that were closed during the current or prior fiscal year are excluded from the definition of comparable stores.
Our fiscal 2015 year, which ended December 31, 2015, included a 53rd week. When presenting comparable store sales for fiscal 2015 and fiscal 2016, we have excluded the last week of fiscal 2015.
63
Definitions and calculations of comparable store sales differ among companies in the retail industry, and therefore comparable store metrics disclosed by us may not be comparable to the metrics disclosed by other companies.
Comparable store sales allow us to evaluate how our retail stores are performing by measuring the change in period-over-period net sales in stores that have been open for thirteen months or more. Various factors affect comparable store sales, including:
Number of New Stores
The number and timing of new store openings, and the costs and fixed lease obligations associated therewith, have had, and are expected to continue to have, a significant impact on our results of operations. The number of new stores reflects the number of stores opened during a particular reporting period. Before we open new stores, we incur pre-opening expenses, which are defined below. While net sales at new stores are generally lower than net sales at our stores that have been open for more than one year, our new stores have historically been profitable in their first year. Generally, our newer stores have also averaged higher comparable store sales growth than our total store average.
Gross Profit and Gross Margin
Our gross profit is variable in nature and generally follows changes in net sales. Our gross profit and gross margin can also be impacted by changes in our prices, our merchandising assortment, shrink, damage, selling of discontinued products, the cost to transport our products from the manufacturer to our stores and our distribution center costs. With respect to our merchandising assortment, certain of our products tend to generate somewhat higher margins than other products within the same product categories or among different product categories. We have experienced modest inflation increases in certain of our product categories, but historically have been able to source from a different manufacturer or pass increases onto our consumers with modest impact on our gross margin. Our gross profit and gross margin, which reflect our net sales and our cost of sales and any changes to the components thereof, allow us to evaluate our profitability and overall business results.
Gross profit is calculated as net sales less cost of sales. Gross profit as a percentage of net sales is referred to as gross margin. Cost of sales consists of merchandise costs, as well as capitalized freight costs to transport inventory to our distribution centers and stores, and duty and other costs that are incurred to distribute the merchandise to our stores. Cost of sales also includes shrinkage, damage
64
product disposals, distribution, warehousing costs, sourcing and compliance costs. We receive cash consideration from certain vendors related to vendor allowances and volume rebates, which is recorded as a reduction of costs of sales as the inventory is sold or as a reduction of the carrying value of inventory while the inventory is still on hand. Costs associated with arranging and paying for freight to deliver products to customers is included in cost of sales. The components of our cost of sales may not be comparable to the components of cost of sales, or similar measures, of other retailers. As a result, data in this prospectus regarding our gross profit and gross margin may not be comparable to similar data made available by other retailers.
Operating Income, EBITDA, Adjusted EBITDA
EBITDA and Adjusted EBITDA are supplemental measures of financial performance that are not required by, or presented in accordance with, GAAP. We define EBITDA as net income before interest, loss on early extinguishment of debt, taxes, depreciation and amortization. We define Adjusted EBITDA as net income before interest, loss on early extinguishment of debt, taxes, depreciation and amortization, adjusted to eliminate the impact of certain items that we do not consider indicative of our core operating performance.
Operating income, EBITDA and Adjusted EBITDA are key metrics used by management and our board of directors to assess our financial performance and enterprise value. We believe that operating income, EBITDA and Adjusted EBITDA are useful measures, as they eliminate certain expenses that are not indicative of our core operating performance and facilitate a comparison of our core operating performance on a consistent basis from period to period. Opening each new store requires a unique composition of expenses that can differ depending on the location or type of market. Additionally, pre-opening expenses for a particular store are generally incurred before the store has opened to its customers and begins to generate revenue. Pre-opening expenses are incurred only when preparing to open new stores, and there can be no assurance as to the timing or number of stores that will be opened in a given period. Accordingly it is possible that some periods will have no pre-opening expenses and pre-opening expenses would no longer be incurred at all if only existing stores were operated going forward. Given the unique and non-recurring nature of these expenses, we exclude pre-opening expenses from the calculation of Adjusted EBITDA. We believe that these pre-opening expenses are not comparable to our recurring core operating performance during the periods shown because the amounts incurred in any particular period to implement our growth strategy will vary based on the timing, location and number of stores opened in that period. We also use Adjusted EBITDA as a basis to determine covenant compliance with respect to our Credit Facilities, to supplement GAAP measures of performance to evaluate the effectiveness of our business strategies, to make budgeting decisions and to compare our performance against that of other peer companies using similar measures. Operating income, EBITDA and Adjusted EBITDA are also frequently used by analysts, investors and other interested parties as performance measures to evaluate companies in our industry.
EBITDA and Adjusted EBITDA are non-GAAP measures of our financial performance and should not be considered as alternatives to net income as a measure of financial performance or any other performance measure derived in accordance with GAAP and they should not be construed as an inference that our future results will be unaffected by unusual or non-recurring items. Additionally, EBITDA and Adjusted EBITDA are not intended to be measures of liquidity or free cash flow for management's discretionary use. In addition, these non-GAAP measures exclude certain non-recurring and other charges. Each of these non-GAAP measures has its limitations as an analytical tool, and you should not consider them in isolation or as a substitute for analysis of our results as reported under GAAP. In evaluating EBITDA and Adjusted EBITDA, you should be aware that in the future we will incur expenses that are the same as or similar to some of the items eliminated in the adjustments made to determine EBITDA and Adjusted EBITDA, such as pre-opening expenses, stock compensation expense, loss (gain) on asset disposal, executive recruiting/relocation, and other adjustments. Our
65
presentation of EBITDA and Adjusted EBITDA should not be construed to imply that our future results will be unaffected by any such adjustments. Definitions and calculations of EBITDA and Adjusted EBITDA differ among companies in the retail industry, and therefore EBITDA and Adjusted EBITDA disclosed by us may not be comparable to the metrics disclosed by other companies.
Other Key Financial Definitions
Net Sales
The retail sector in which we operate is cyclical, and consequently our sales are affected by general economic conditions. Purchases of our products are sensitive to trends in the levels of consumer spending, which are affected by a number of factors such as consumer disposable income, housing market conditions, unemployment trends, stock market performance, consumer debt levels and consumer credit availability, interest rates and inflation, tax rates and overall consumer confidence in the economy.
Net sales reflect our sales of merchandise, less discounts and estimated returns and include our in-store sales and e-commerce sales. In certain cases, we arrange and pay for freight to deliver products to customers and bills the customer for the estimated freight cost, which is also included in net sales. Revenue is recognized when both collection or reasonable assurance of collection of payment and final delivery of the product have occurred. For orders placed through our website and shipped to our customers, revenue is recognized at the time we estimate the customer receives the merchandise, which is typically within a few days of shipment.
Selling and Store Operating Expenses
We expect that our selling and store operating expenses will increase in future periods with future growth. Selling and store operating expenses consist primarily of store personnel wages, bonuses and benefits, rent and infrastructure expenses, supplies, depreciation and amortization, training expenses and advertising costs. Credit card fees, insurance, personal property taxes and other miscellaneous operating costs are also included.
The components of our selling and store operating expenses may not be comparable to the components of similar measures of other retailers.
General and Administrative Expenses
We expect that our general and administrative expenses will increase in future periods with future growth and in part due to additional legal, accounting, insurance and other expenses that we expect to incur as a result of being a public company, including compliance with the Sarbanes-Oxley Act. General and administrative expenses include both fixed and variable components, and therefore, are not directly correlated with net sales.
General and administrative expenses consist primarily of costs incurred outside of our stores and include administrative personnel wages in our store support center and regional offices, bonuses and benefits, supplies, depreciation and amortization, and store support center expenses. Insurance, legal expenses, information technology costs, consulting and other miscellaneous operating costs are also included.
The components of our general and administrative expenses may not be comparable to the components of similar measures of other retailers.
Pre-Opening Expenses
We account for non-capital operating expenditures incurred prior to opening a new store or relocating an existing store as "pre-opening" expenses in its consolidated statements of income. Our pre-opening expenses begin on average three to six months in advance of a store opening or relocating due to, among other things, the amount of time it takes to prepare a store for its grand opening.
66
Pre-opening expenses primarily include the following: rent, advertising, training, staff recruiting, utilities, personnel, and equipment rental. A store is considered to be relocated if it is closed temporarily and re-opened within the same primary trade area.
Results of Operations
The following table summarizes key components of our results of operations for the periods indicated, in dollars and as a percentage of net sales:
| |
Fiscal year ended | |||||||||
|---|---|---|---|---|---|---|---|---|---|---|
| (in thousands) |
12/25/2014 | 12/31/2015(1) | 12/29/2016 | |||||||
Net sales |
$ | 584,588 | $ | 784,012 | $ | 1,050,759 | ||||
Cost of sales |
355,051 | 471,390 | 621,497 | |||||||
| | | | | | | | | | | |
Gross profit |
229,537 | 312,622 | 429,262 | |||||||
Selling & store operating expenses |
146,485 | 202,637 | 271,876 | |||||||
General & administrative expenses |
38,984 | 49,917 | 64,025 | |||||||
Pre-opening expenses |
7,412 | 7,380 | 13,732 | |||||||
Litigation settlement |
— | — | 10,500 | |||||||
Executive severance |
2,975 | 296 | — | |||||||
| | | | | | | | | | | |
Operating income |
33,681 | 52,392 | 69,129 | |||||||
Interest expense |
8,949 | 9,386 | 12,803 | |||||||
Loss on early extinguishment of debt |
— | — | 1,813 | |||||||
| | | | | | | | | | | |
Income before income taxes |
24,732 | 43,006 | 54,513 | |||||||
Provision for income taxes |
9,634 | 16,199 | 11,474 | |||||||
| | | | | | | | | | | |
Net income |
$ | 15,098 | $ | 26,807 | $ | 43,039 | ||||
| | | | | | | | | | | |
| | | | | | | | | | | |
| | | | | | | | | | | |
| |
Fiscal year ended | |||||||||
|---|---|---|---|---|---|---|---|---|---|---|
| |
12/25/2014 | 12/31/2015(1) | 12/29/2016 | |||||||
Net sales |
100.0 | % | 100.0 | % | 100.0 | % | ||||
Cost of sales |
60.7 | 60.1 | 59.1 | |||||||
| | | | | | | | | | | |
Gross profit |
39.3 | 39.9 | 40.9 | |||||||
Selling & store operating expenses |
25.1 | 25.8 | 25.9 | |||||||
General & administrative expenses |
6.6 | 6.5 | 6.1 | |||||||
Pre-opening expenses |
1.3 | 0.9 | 1.3 | |||||||
Litigation settlement |
0.0 | 0.0 | 1.0 | |||||||
Executive severance |
0.5 | 0.0 | 0.0 | |||||||
| | | | | | | | | | | |
Operating income |
5.8 | 6.7 | 6.6 | |||||||
Interest expense |
1.6 | 1.2 | 1.2 | |||||||
Loss on early extinguishment of debt |
0.0 | 0.0 | 0.2 | |||||||
| | | | | | | | | | | |
Income before income taxes |
4.2 | 5.5 | 5.2 | |||||||
Provision for income taxes |
1.6 | 2.1 | 1.1 | |||||||
| | | | | | | | | | | |
Net income |
2.6 | % | 3.4 | % | 4.1 | % | ||||
| | | | | | | | | | | |
| | | | | | | | | | | |
| | | | | | | | | | | |
67
Fiscal 2016 Compared to Fiscal Year 2015
Net Sales
The following table summarizes our change in net sales for fiscal 2016 compared to fiscal 2015:
| |
Fiscal year ended | |
|
||||||||||
|---|---|---|---|---|---|---|---|---|---|---|---|---|---|
| |
December 31, 2015 |
December 29, 2016 |
$ Change | % Change | |||||||||
Net sales |
$ | 784,012 | $ | 1,050,759 | $ | 266,747 | 34.0 | % | |||||
Net sales during fiscal 2016 increased $266.7 million, or 34.0%, compared to the corresponding prior year period. All of our product categories experienced comparable store sales increases during the period, driven by increases in laminate/luxury vinyl plank, decorative accessories and tile that were above our company average for fiscal 2016. Our comparable store sales increased 19.4%, or $149.1 million, while our non-comparable store sales contributed $117.6 million. The increase in comparable store sales was driven primarily by an increase in comparable customer transactions and to a lesser extent by comparable average ticket growth. We believe the increase in net sales, customer transactions and average ticket are due to the execution of our key strategic investments and an improved U.S. flooring market. As described in the "Overview" section above, we have hired key personnel in all departments, implemented connected customer strategies, including an improved website, and made key process and technology investments in merchandising and supply chain leading to better in-stock selection and higher quality products. We have invested in value added strategies targeting Pro customers, including dedicated sales teams. Non-comparable store sales were driven by the opening of 12 new stores during fiscal 2016.
Gross Profit and Gross Margin
The following table summarizes our change in gross profit and gross margin for fiscal 2016 compared to fiscal 2015:
| |
Fiscal year ended | |
|
||||||||||
|---|---|---|---|---|---|---|---|---|---|---|---|---|---|
(in thousands)
|
December 31, 2015 |
December 29, 2016 |
$ Change | % Change | |||||||||
Gross profit |
$ | 312,622 | $ | 429,262 | $ | 116,640 | 37.3 | % | |||||
Gross margin |
39.9 | % | 40.9 | % | |||||||||
Gross profit during fiscal 2016 increased $116.6 million, or 37.3%, compared to fiscal 2015. This increase in gross profit was primarily the result of increased sales volume.
Gross margin for fiscal 2016 increased approximately 100 basis points compared to fiscal 2015. This increase was primarily driven by approximately 120 basis points of product margin improvement resulting from increased sales of higher quality products that carry a higher gross margin and lower capitalized freight costs, slightly offset by approximately 10 basis points of higher supply chain and global sourcing and compliance costs as well as approximately 10 basis points due to higher inventory damage and shrinkage.
68
Selling and Store Operating Expenses
The following table summarizes our change in selling and store operating expenses for fiscal 2016 compared to fiscal 2015:
| |
Fiscal year ended | |
|
||||||||||
|---|---|---|---|---|---|---|---|---|---|---|---|---|---|
(in thousands)
|
December 31, 2015 |
December 29, 2016 |
$ Change | % Change | |||||||||
Selling and store operating expenses |
$ | 202,637 | $ | 271,876 | $ | 69,239 | 34.2 | % | |||||
Selling and store operating expenses as a % of net sales |
25.8 | % | 25.9 | % | |||||||||
Selling and store operating expenses increased $69.2 million, or 34.2%, due primarily to the addition of 12 new stores during fiscal 2016, and increased expenses in our comparable stores, which drove an increase in comparable store sales of 19.4%.
As a percentage of net sales, our selling and store operating expenses increased approximately 10 basis points to 25.9%. Our comparable store selling and store operating expenses decreased by approximately 130 basis points as a percentage of comparable store sales as we leveraged occupancy, personnel and advertising expenses on higher net sales. Our new stores have lower net sales and higher store operating expenses as a percentage of net sales than do our mature stores.
General and Administrative Expenses
The following table summarizes our change in general and administrative expenses for fiscal 2016 compared to fiscal 2015:
| |
Fiscal year ended | |
|
||||||||||
|---|---|---|---|---|---|---|---|---|---|---|---|---|---|
(in thousands)
|
December 31, 2015 |
December 29, 2016 |
$ Change | % Change | |||||||||
General and administrative expenses |
$ | 49,917 | $ | 64,025 | $ | 14,108 | 28.3 | % | |||||
General and administrative expenses as a % of net sales |
6.5 | % | 6.1 | % | |||||||||
General and administrative expenses, which are typically expenses incurred outside of our stores, increased $14.1 million, or 28.3%, due to investments we made in personnel for our regional and store support functions to support our store growth, higher incentive compensation accruals and higher consulting costs. Our general and administrative expenses as a percentage of net sales decreased by approximately 40 basis points primarily due to leveraging our expenses over increasing net sales.
Pre-Opening Expenses
The following table summarizes our change in pre-opening expenses for fiscal 2016 compared to fiscal 2015:
| |
Fiscal year ended | |
|
||||||||||
|---|---|---|---|---|---|---|---|---|---|---|---|---|---|
(in thousands)
|
December 31, 2015 |
December 29, 2016 |
$ Change | % Change | |||||||||
Pre-opening expenses |
$ | 7,380 | $ | 13,732 | $ | 6,352 | 86.1 | % | |||||
Pre-opening expenses as a % of net sales |
0.9 | % | 1.3 | % | |||||||||
Pre-opening expenses increased $6.4 million, or 86.1%. The increase is primarily due to a greater number of new stores opened or planned to be opened for which pre-opening expenses were incurred and to a lesser extent higher average occupancy and advertising costs per store during fiscal 2016 compared to fiscal 2015. During fiscal 2016, we opened 12 stores and incurred costs for three additional stores planned to open as well as one relocation in 2017 compared to opening ten stores and incurring costs for two additional stores that opened in 2016 during fiscal 2015.
69
Interest Expense
The following table summarizes our change in interest expense for fiscal 2016 compared to fiscal 2015:
| |
Fiscal year ended | |
|
||||||||||
|---|---|---|---|---|---|---|---|---|---|---|---|---|---|
(in thousands)
|
December 31, 2015 |
December 29, 2016 |
$ Change | % Change | |||||||||
Interest expense |
$ | 9,386 | $ | 12,803 | $ | 3,417 | 36.4 | % | |||||
Interest expense for fiscal 2016 increased $3.4 million compared to fiscal 2015. The increase in interest expense was entirely due to our average total debt increasing $64.4 million to $225.4 million for fiscal 2016 compared to $161.0 million in fiscal 2015. The effective interest rate was 5.7% in fiscal 2016 compared to 5.8% in fiscal 2015.
Taxes
The following table summarizes our change in provision for income taxes and our effective tax rates for fiscal 2016 compared to fiscal 2015:
| |
Fiscal year ended | |
|
||||||||||
|---|---|---|---|---|---|---|---|---|---|---|---|---|---|
(in thousands)
|
December 31, 2015 |
December 29, 2016 |
$ Change | % Change | |||||||||
Provision for income taxes |
$ | 16,199 | $ | 11,474 | $ | (4,725 | ) | (29.2 | )% | ||||
Effective tax rate |
37.7 | % | 21.0 | % | |||||||||
The provision for income taxes decreased $4.7 million, or 29.2%. The decrease in the provision for income taxes for fiscal 2016 compared to fiscal 2015 is attributable to the decrease in the effective tax rate, partially offset by an increase in income before income taxes. The decrease in the fiscal 2016 effective tax rate was due to an $8.5 million state and federal tax benefit related to a dividend equivalent payment to certain option holders.
Fiscal 2015 Compared to Fiscal 2014
Net Sales
The following table summarizes our change in net sales for fiscal 2015 compared to fiscal 2014:
| |
Fiscal year ended | |
|
||||||||||
|---|---|---|---|---|---|---|---|---|---|---|---|---|---|
| |
December 25, 2014 |
December 31, 2015 |
$ Change | % Change | |||||||||
Net sales |
$ | 584,588 | $ | 784,012 | $ | 199,424 | 34.1 | % | |||||
Net sales in fiscal 2015 increased $199.4 million, or 34.1%, compared to fiscal 2014. All of our product categories experienced comparable store sales increases during the period, driven by increases in tile, decorative accessories, and installation materials and tools that were above our average for fiscal 2015. Our comparable store sales increased 13.5%, or $78.8 million, while our non-comparable store sales contributed $120.6 million. The increase in comparable store sales was largely driven by an increase in comparable customer transactions and to a lesser extent by comparable average ticket growth. We believe the increase in net sales and average ticket was due to an improved U.S. flooring market and the execution of our key strategic investments, including hiring key personnel in all departments and improving our assortment by buying better products that offer more value, features and benefits. We also took over the management of all our distribution centers, which led to better in-stock selection and faster replenishment. Non-comparable store sales were driven by the opening of ten new stores during fiscal 2015. The 53rd week in fiscal 2015 added approximately $11.9 million in net sales.
70
Gross Profit and Gross Margin
The following table summarizes our change in gross profit and gross margin for fiscal 2015 and fiscal 2014:
| |
Fiscal year ended | |
|
||||||||||
|---|---|---|---|---|---|---|---|---|---|---|---|---|---|
(in thousands)
|
December 25, 2014 |
December 31, 2015 |
$ Change | % Change | |||||||||
Gross profit |
$ | 229,537 | $ | 312,622 | $ | 83,085 | 36.2 | % | |||||
Gross margin |
39.3 | % | 39.9 | % | |||||||||
Gross profit for fiscal 2015 increased $83.1 million, or 36.2%, compared to fiscal 2014. This increase in gross profit was primarily the result of increased sales and higher product margins.
Gross margin for fiscal 2015 increased approximately 60 basis points to 39.9% from 39.3% in fiscal 2014. This increase in gross margin was primarily attributable to higher product margin of approximately 40 basis points and approximately 40 basis points due to lower inventory shrinkage and damage, partially offset by approximately 30 basis points of higher distribution center and supply chain costs.
Selling and Store Operating Expenses
The following table summarizes our selling and store operating expenses for fiscal 2015 and fiscal 2014:
| |
Fiscal year ended | |
|
||||||||||
|---|---|---|---|---|---|---|---|---|---|---|---|---|---|
(in thousands)
|
December 25, 2014 |
December 31, 2015 |
$ Change | % Change | |||||||||
Selling and store operating expenses |
$ | 146,485 | $ | 202,637 | $ | 56,152 | 38.3 | % | |||||
Selling and store operating expenses as a % of net sales |
25.1 | % | 25.8 | % | |||||||||
Selling and store operating expenses in fiscal 2015 increased by $56.2 million, or 38.3% from fiscal 2014, due primarily to the addition of ten new stores in fiscal 2015, and to a lesser extent, increased expenses in our comparable stores, which drove an increase in comparable store sales of 13.5% and were incurred as a result of such increased net sales.
As a percentage of net sales, our selling and store operating expenses for fiscal 2015 increased approximately 70 basis points to 25.8% from 25.1% in fiscal 2014, due entirely to the addition of ten new stores. This was modestly offset by our comparable store selling and store operating expenses decreasing by 130 basis points as a percentage of comparable store sales. Our new stores have lower net sales and higher store operating expenses as a percentage of net sales than our total store average.
General and Administrative Expenses
The following table summarizes our change in general and administrative expenses for fiscal 2015 and fiscal 2014:
| |
Fiscal year ended | |
|
||||||||||
|---|---|---|---|---|---|---|---|---|---|---|---|---|---|
(in thousands)
|
December 25, 2014 |
December 31, 2015 |
$ Change | % Change | |||||||||
General and administrative expenses |
$ | 38,984 | $ | 49,917 | $ | 10,933 | 28.0 | % | |||||
General and administrative expenses as a % of net sales |
6.6 | % | 6.5 | % | |||||||||
71
General and administrative expenses, which are typically expenses incurred outside of our stores, increased $10.9 million, or 28.0%, due to our continued investment in personnel to support store growth as well as higher incentive compensation accruals. Our general and administrative expenses as a percentage of net sales decreased by approximately 10 basis points primarily due to leveraging personnel and operating costs over increasing net sales.
Pre-Opening Expenses
The following table summarizes our change in pre-opening expenses for fiscal 2015 and fiscal 2014:
| |
Fiscal year ended | |
|
||||||||||
|---|---|---|---|---|---|---|---|---|---|---|---|---|---|
(in thousands)
|
December 25, 2014 |
December 31, 2015 |
$ Change | % Change | |||||||||
Pre-opening expenses |
$ | 7,412 | $ | 7,380 | $ | (32 | ) | (0.4 | )% | ||||
Pre-opening expenses as a % of net sales |
1.3 | % | 0.9 | % | |||||||||
Pre-opening expenses in fiscal 2015 were flat compared to fiscal 2014. As a percentage of net sales, pre-opening expenses for fiscal 2015 decreased approximately 40 basis points from fiscal 2014 primarily due to leveraging expenses over increasing net sales. We had a minimal decrease in pre-opening expenses in fiscal 2015 compared to fiscal 2014 due to the timing of store openings. During fiscal 2015, we opened ten stores and incurred costs for two additional stores planned to open in 2016 compared to opening nine stores and incurring costs for one additional store that opened in 2015 during fiscal 2014.
Interest Expense
The following table summarizes our change in interest expense for fiscal 2015 and fiscal 2014:
| |
Fiscal year ended | |
|
||||||||||
|---|---|---|---|---|---|---|---|---|---|---|---|---|---|
(in thousands)
|
December 25, 2014 |
December 31, 2015 |
$ Change | % Change | |||||||||
Interest expense |
$ | 8,949 | $ | 9,386 | $ | 437 | 4.9 | % | |||||
Interest expense in fiscal 2015 increased $0.4 million, or 4.9%. The increase in interest expense was due to our average total debt increasing to $161.1 million in fiscal 2015 compared to $147.9 million in fiscal 2014, offset by a reduction in the effective interest rate of 5.8% for fiscal 2015 from 6.1% for fiscal 2014.
Taxes
The following table summarizes our change in provision for income taxes and our effective tax rate for fiscal 2015 and fiscal 2014:
| |
Fiscal year ended | |
|
||||||||||
|---|---|---|---|---|---|---|---|---|---|---|---|---|---|
(in thousands)
|
December 25, 2014 |
December 31, 2015 |
$ Change | % Change | |||||||||
Provision for income taxes |
$ | 9,634 | $ | 16,199 | $ | 6,565 | 68.1 | % | |||||
Effective tax rate |
39.0 | % | 37.7 | % | |||||||||
The provision for income taxes increased $6.6 million, or 68.1%. The increase in the provision for income taxes for fiscal 2015 compared to fiscal 2014 is attributable to the increase in income before
72
income taxes. The decrease in the effective tax rate was due to net favorable discrete items for fiscal 2015, primarily related to federal and state provision to return adjustments.
Seasonality
Historically, our business has had very little seasonality. Our specialty hard surface flooring and decorative home product offering makes us less susceptible to holiday shopping seasonal patterns compared to other retailers. However, we generally conduct a clearance event during our third fiscal quarter followed by a smaller clearance event towards the end of the year. The timing of these clearance events is driven by operational considerations rather than customer demand and could change from year to year.
Interim Results
The following table sets forth our historical quarterly results of operations as well as certain operating data for each of our most recent 12 fiscal quarters. This unaudited quarterly information has been prepared on the same basis as our annual audited financial statements appearing elsewhere in this document and includes all adjustments, consisting only of normally recurring adjustments, that we consider necessary to present fairly the financial information for the fiscal quarters presented.
The quarterly data should be read in conjunction with our audited consolidated and unaudited condensed consolidated financial statements and the related notes thereto appearing elsewhere in this prospectus.
| |
Fiscal 2014 | Fiscal 2015 | Fiscal 2016 | ||||||||||||||||||||||||||||||||||
|---|---|---|---|---|---|---|---|---|---|---|---|---|---|---|---|---|---|---|---|---|---|---|---|---|---|---|---|---|---|---|---|---|---|---|---|---|---|
(in thousands, except operating data)
|
First Quarter |
Second Quarter |
Third Quarter |
Fourth Quarter |
First Quarter |
Second Quarter |
Third Quarter |
Fourth Quarter(1) |
First Quarter |
Second Quarter |
Third Quarter |
Fourth Quarter(1) |
|||||||||||||||||||||||||
Net sales |
$ | 127,536 | $ | 144,540 | $ | 152,976 | $ | 159,536 | $ | 170,552 | $ | 191,440 | $ | 199,211 | $ | 222,809 | $ | 235,301 | $ | 265,853 | $ | 271,311 | $ | 278,294 | |||||||||||||
Year-over-year increase |
28.0% | 30.1% | 31.4% | 36.4% | 33.7% | 32.4% | 30.2% | 39.7% | 38.0% | 38.9% | 36.2% | 24.9% | |||||||||||||||||||||||||
Gross profit |
$ | 51,508 | $ | 56,459 | $ | 58,593 | $ | 62,977 | $ | 67,450 | $ | 75,507 | $ | 79,295 | $ | 90,370 | $ | 93,897 | $ | 109,652 | $ | 110,967 | $ | 114,746 | |||||||||||||
Year-over-year increase |
32.1% | 26.4% | 37.3% | 44.8% | 31.0% | 33.7% | 35.3% | 43.5% | 39.2% | 45.2% | 39.9% | 27.0% | |||||||||||||||||||||||||
Operating income |
$ | 5,811 | $ | 10,154 | $ | 8,641 | $ | 9,075 | $ | 8,700 | $ | 13,384 | $ | 11,633 | $ | 18,675 | $ | 13,962 | $ | 10,628 | $ | 24,569 | $ | 19,970 | |||||||||||||
Net income |
$ | 2,188 | $ | 4,880 | $ | 4,124 | $ | 3,906 | $ | 3,963 | $ | 6,825 | $ | 6,052 | $ | 9,967 | $ | 7,101 | $ | 5,012 | $ | 14,219 | $ | 16,707 | |||||||||||||
| |
Fiscal 2014 | Fiscal 2015 | Fiscal 2016 | ||||||||||||||||||||||||||||||||||
|---|---|---|---|---|---|---|---|---|---|---|---|---|---|---|---|---|---|---|---|---|---|---|---|---|---|---|---|---|---|---|---|---|---|---|---|---|---|
Other financial data
|
First Quarter |
Second Quarter |
Third Quarter |
Fourth Quarter |
First Quarter |
Second Quarter |
Third Quarter |
Fourth Quarter(1) |
First Quarter |
Second Quarter |
Third Quarter |
Fourth Quarter |
|||||||||||||||||||||||||
Comparable store sales growth |
11.4% | 15.7% | 17.0% | 18.5% | 16.3% | 12.9% | 10.4% | 14.9% | 22.4% | 22.6% | 19.3% | 14.0% | |||||||||||||||||||||||||
Number of stores open at end of period(2) |
39 | 41 | 44 | 48 | 51 | 53 | 56 | 58 | 61 | 64 | 68 | 70 | |||||||||||||||||||||||||
Adjusted EBITDA (in thousands)(3) |
$ | 12,771 | $ | 15,659 | $ | 15,068 | $ | 15,273 | $ | 15,239 | $ | 20,441 | $ | 19,244 | $ | 25,479 | $ | 23,430 | $ | 34,601 | $ | 33,171 | $ | 30,822 | |||||||||||||
Adjusted EBITDA margin |
10.0% | 10.8% | 9.8% | 9.6% | 8.9% | 10.7% | 9.7% | 11.4% | 10.0% | 13.0% | 12.2% | 11.1% | |||||||||||||||||||||||||
EBITDA and Adjusted EBITDA are key metrics used by management and our board of directors to assess our financial performance and enterprise value. We believe that EBITDA and Adjusted EBITDA are useful measures, as they eliminate certain expenses that are not indicative of our core operating performance and facilitate a comparison of our core operating performance on a consistent basis from period to period. Opening each new store requires a unique composition of expenses that can differ depending on the location or type of market. Additionally, pre-opening expenses for a particular store are generally incurred before the store has opened to its customers and begins to generate revenue. Pre-opening expenses are incurred only when preparing to open new stores, and there can be no assurance as to the timing or number of stores that will be opened in a given period. Accordingly it is possible that some periods will have no pre-opening expenses and pre-opening expenses would no longer be incurred at all if only existing stores were operated going forward. Given the unique and non-recurring nature of these expenses, we exclude pre-opening expenses from the calculation of Adjusted EBITDA. We believe that these pre-opening expenses are not
73
comparable to our recurring core operating performance during the periods shown because the amounts incurred in any particular period to implement our growth strategy will vary based on the timing, location and number of stores opened in that period. We also use Adjusted EBITDA as a basis to determine covenant compliance with respect to our Credit Facilities, to supplement GAAP measures of performance to evaluate the effectiveness of our business strategies, to make budgeting decisions, and to compare our performance against that of other peer companies using similar measures. EBITDA and Adjusted EBITDA are also used by analysts, investors and other interested parties as performance measures to evaluate companies in our industry.
EBITDA and Adjusted EBITDA are non-GAAP measures of our financial performance and should not be considered as alternatives to net income as a measure of financial performance or any other performance measure derived in accordance with GAAP and they should not be construed as an inference that our future results will be unaffected by unusual or non-recurring items. Additionally, EBITDA and Adjusted EBITDA are not intended to be measures of liquidity or free cash flow for management's discretionary use. In addition, these non-GAAP measures exclude certain non-recurring and other charges. Each of these non-GAAP measures has its limitations as an analytical tool, and you should not consider them in isolation or as a substitute for analysis of our results as reported under GAAP. In evaluating EBITDA and Adjusted EBITDA, you should be aware that in the future we will incur expenses that are the same as or similar to some of the items eliminated in the adjustments made to determine EBITDA and Adjusted EBITDA, such as pre-opening expenses, stock compensation expense, loss (gain) on asset disposal, executive recruiting/relocation, and other adjustments. Our presentation of EBITDA and Adjusted EBITDA should not be construed to imply that our future results will be unaffected by any such adjustments. Definitions and calculations of EBITDA and Adjusted EBITDA differ among companies in the retail industry, and therefore EBITDA and Adjusted EBITDA disclosed by us may not be comparable to the metrics disclosed by other companies.
The reconciliations of net income to EBITDA and Adjusted EBITDA for the periods noted below are set forth in the table as follows:
| |
Fiscal 2014 | Fiscal 2015 | Fiscal 2016 | ||||||||||||||||||||||||||||||||||
|---|---|---|---|---|---|---|---|---|---|---|---|---|---|---|---|---|---|---|---|---|---|---|---|---|---|---|---|---|---|---|---|---|---|---|---|---|---|
(in thousands)
|
First Quarter |
Second Quarter |
Third Quarter |
Fourth Quarter |
First Quarter |
Second Quarter |
Third Quarter |
Fourth Quarter(1) |
First Quarter |
Second Quarter |
Third Quarter |
Fourth Quarter |
|||||||||||||||||||||||||
Net income |
$ | 2,188 | $ | 4,880 | $ | 4,124 | $ | 3,906 | $ | 3,963 | $ | 6,825 | $ | 6,052 | $ | 9,967 | $ | 7,101 | $ | 5,012 | $ | 14,219 | $ | 16,707 | |||||||||||||
Depreciation and amortization(a) |
2,440 | 2,449 | 2,882 | 3,302 | 3,547 | 4,131 | 4,421 | 4,695 | 5,337 | 6,447 | 6,154 | 7,151 | |||||||||||||||||||||||||
Interest expense |
2,265 | 2,346 | 2,164 | 2,174 | 2,279 | 2,320 | 2,267 | 2,520 | 2,486 | 2,475 | 2,401 | 5,441 | |||||||||||||||||||||||||
Loss on early extinguishment of debt(b) |
— | — | — | — | — | — | — | — | — | 153 | — | 1,660 | |||||||||||||||||||||||||
Income tax expense |
1,358 | 2,928 | 2,353 | 2,995 | 2,458 | 4,239 | 3,314 | 6,188 | 4,375 | 2,988 | 7,949 | (3,838 | ) | ||||||||||||||||||||||||
| | | | | | | | | | | | | | | | | | | | | | | | | | | | | | | | | | | | | | |
EBITDA |
8,251 | 12,603 | 11,523 | 12,377 | 12,247 | 17,515 | 16,054 | 23,370 | 19,299 | 17,075 | 30,723 | 27,121 | |||||||||||||||||||||||||
Pre-opening expenses(c) |
1,023 | 2,104 | 2,601 | 1,835 | 1,985 | 1,797 | 2,355 | 1,398 | 3,329 | 2,609 | 5,010 | 2,678 | |||||||||||||||||||||||||
Stock compensation expense(d) |
542 | 539 | 620 | 622 | 964 | 748 | 775 | 771 | 755 | 706 | 745 | 1,023 | |||||||||||||||||||||||||
Loss (gain) on asset disposal(e) |
(20 | ) | 165 | — | 3 | 43 | 18 | 60 | 7 | 47 | 211 | 193 | — | ||||||||||||||||||||||||
Executive severance(f) |
2,975 | — | — | — | — | 363 | — | (67 | ) | — | — | — | — | ||||||||||||||||||||||||
Legal settlement(h) |
— | — | — | — | — | — | — | — | — | 14,000 | (3,500 | ) | — | ||||||||||||||||||||||||
Other(i) |
— | 248 | 324 | 436 | — | — | — | — | — | — | — | — | |||||||||||||||||||||||||
| | | | | | | | | | | | | | | | | | | | | | | | | | | | | | | | | | | | | | |
Adjusted EBITDA |
$ | 12,771 | $ | 15,659 | $ | 15,068 | $ | 15,273 | $ | 15,239 | $ | 20,441 | $ | 19,244 | $ | 25,479 | $ | 23,430 | $ | 34,601 | $ | 33,171 | $ | 30,822 | |||||||||||||
| | | | | | | | | | | | | | | | | | | | | | | | | | | | | | | | | | | | | | |
| | | | | | | | | | | | | | | | | | | | | | | | | | | | | | | | | | | | | | |
| | | | | | | | | | | | | | | | | | | | | | | | | | | | | | | | | | | | | | |
Liquidity and Capital Resources
Liquidity is provided primarily by our cash flows from operations and the ABL Facility. As of December 29, 2016, we had $122.2 million in unrestricted liquidity, consisting of $0.5 million in cash and cash equivalents and $121.7 million immediately available for borrowing under the ABL Facility without violating any covenants thereunder.
During fiscal 2016, we generated $89.5 million in cash provided by operating activities. Additionally, on September 30, 2016, we refinanced our existing indebtedness by amending our existing asset-based revolving credit facility with the ABL Facility, a $200.0 million asset based revolving credit
74
facility maturing on September 30, 2021, and entering into the Term Loan Facility, a $350.0 million senior secured term loan facility maturing on September 30, 2023. We used cash from the Term Loan Facility as follows, (i) $202.5 million was used to fund the Special Dividend, (ii) $22.5 million was used to make related cash payments in respect of certain options to purchase our common stock in accordance with the terms of the 2011 Plan (the "Option Payments"), (iii) $77.6 million was used to repay and terminate the GCI Facility, (iv) $19.8 million was used to repay and terminate the Prior Term Loan Facility, and (v) $13.0 million was used to repay a portion of the Prior ABL Facility. We refer to the refinancing, Special Dividend and Option Payments collectively as the "2016 Refinancing." We used the cash provided by operating activities to (a) fund capital expenditures and (b) repay a portion of the Prior ABL Facility.
A portion of the Option Payments were for unvested options, and option holders are required to repay any amounts related to options that do not vest prior to such option holder's termination of employment. In the event that an option holder defaults on such repayment, we will record the amount as additional stock based compensation expense in that reporting period.
Our primary cash needs are for merchandise inventories, payroll, store rent, and other operating expenses and capital expenditures associated with opening new stores and remodeling existing stores, as well as information technology, e-commerce and store support center infrastructure. We also use cash for the payment of taxes and interest.
The most significant components of our operating assets and liabilities are merchandise inventories and accounts payable, and to a lesser extent accounts receivable, prepaid expenses and other assets, other current and non-current liabilities, taxes receivable and taxes payable. Our liquidity is not generally seasonal, and our uses of cash are primarily tied to when we open stores and make other capital expenditures. We believe that cash expected to be generated from operations and the availability of borrowings under the ABL Facility will be sufficient to meet liquidity requirements, anticipated capital expenditures and payments due under our Credit Facilities for at least the next 12 months.
Merchandise inventory is our most significant working capital asset and is considered "in-transit" or "available for sale," based on whether we have physically received the products at an individual store location or in one of our four distribution centers. In-transit inventory generally varies due to contractual terms, country of origin, transit times, international holidays, weather patterns and other factors, but for the last two years, less than 20% of our inventory was in-transit, while over 80% of our inventory was available for sale in our stores or at one of our four distribution centers.
We measure realizability of our inventory by monitoring sales, gross margin, inventory aging, weeks of supply or inventory turns as well as by reviewing SKUs that have been determined by our merchandising team to be discontinued. Based on our analysis of these factors, we believe our inventory is realizable.
Twice a year, we conduct a clearance event with the goal of selling through discontinued inventory, followed by donations of the aged discontinued inventory that we are unable to sell. We generally conduct a larger clearance event during our third fiscal quarter followed by a smaller clearance event towards the end of the fiscal year. We define aged discontinued inventory as inventory in discontinued status for more than 12 months that we intend to donate. As of December 29, 2016, we had $0.4 million of aged discontinued inventory.
Total capital expenditures in fiscal 2017 are planned to be between approximately $95 million to $104 million and will be funded primarily by cash generated from operations. We intend to make the following capital expenditures in fiscal 2017:
75
During the fourth quarter of fiscal 2017, we plan to relocate all the existing inventory from our currently leased distribution center in Savannah, Georgia to a newly leased distribution center in Savannah, Georgia that is currently under construction and, in connection therewith, we anticipate incurring related costs of less than $1 million in fiscal 2017. Additionally, in fiscal 2018, we plan to relocate all the existing inventory from our currently leased distribution center in Miramar, Florida to the newly leased distribution center in Savannah, Georgia and, in connection therewith, we anticipate incurring related costs of less than $1 million in fiscal 2018.
Cash Flow Analysis
A summary of our operating, investing and financing activities are shown in the following table:
| |
Fiscal year ended | |||||||||
|---|---|---|---|---|---|---|---|---|---|---|
(in thousands)
|
12/25/2014 | 12/31/2015 | 12/29/2016 | |||||||
Net cash provided by operating activities |
$ | 43,594 | $ | 20,380 | $ | 89,456 | ||||
Net cash used in investing activities |
(39,069 | ) | (45,021 | ) | (74,648 | ) | ||||
Net cash (used in) provided by financing activities |
(4,421 | ) | 24,680 | (14,675 | ) | |||||
| | | | | | | | | | | |
Increase in cash and cash equivalents |
$ | 104 | $ | 39 | $ | 133 | ||||
| | | | | | | | | | | |
| | | | | | | | | | | |
| | | | | | | | | | | |
Net Cash Provided By Operating Activities
Cash from operating activities consists primarily of net income adjusted for non-cash items, including depreciation and amortization, stock-based compensation, deferred taxes and the effects of changes in operating assets and liabilities.
Net cash provided by operating activities was $89.5 million for fiscal 2016 and $20.4 million for fiscal 2015. The net cash provided by operating activities was primarily the result of an increase in net income and improved working capital management with better inventory management in anticipation of factory closures for Chinese New Year in fiscal 2016 as well as timing of tax payments.
Net cash provided by operating activities was $20.4 million for fiscal 2015 and $43.6 million for fiscal 2014. The decrease in fiscal 2015 compared to fiscal 2014 reflects the increased inventory receipts received at the end of fiscal 2015 to improve in-stock positions in anticipation of Chinese New Year factory closures in early 2016, income tax payments made in fiscal 2015, partially offset by an increase in accounts payable due to the increased inventory and associated changes in working capital.
Net Cash Used in Investing Activities
Investing activities consist primarily of capital expenditures for new store openings, existing store remodels (including leasehold improvements, new racking, new fixtures, new vignettes and new design centers) and new infrastructure and information systems.
Capital expenditures were $74.6 million compared to $45.0 million for fiscal 2016 and fiscal 2015, respectively. The growth is primarily related to opening more new stores in fiscal 2016 as well as capital expenditures for stores opening in early fiscal 2017 compared to the same period in fiscal 2015. For fiscal 2016, approximately 46% of capital expenditures was for new stores, 33% was for existing store remodel and distribution center investments, and the remainder was for information technology and e-commerce investments.
76
Capital expenditures were $45.0 million compared to $39.1 million for fiscal 2015 and fiscal 2014, respectively. The increase in capital expenditures for fiscal 2015 was primarily due to a large investment in our distribution centers and existing store expenditures. For fiscal 2015, approximately 55% of capital expenditures was for new stores, 34% was for existing store remodel and distribution center investments, and the remainder was for information technology and e-commerce investments. For fiscal 2014, approximately 62% of capital expenditures was for new stores, 23% was for existing store remodel investments, and the remainder was for information technology and e-commerce investments.
Net Cash (Used In) Provided By Financing Activities
Financing activities consist primarily of borrowings and related repayments under our credit agreements, as well as dividends paid to common stockholders.
Net cash used in financing activities was $14.7 million for fiscal 2016 and net cash provided by financing activities was $24.7 million for fiscal 2015. The net cash used in financing activities for fiscal 2016 was primarily due to (i) the Special Dividend, (ii) the Option Payments, (iii) $20.3 million to repay and terminate the GCI Facility, (iv) $78.0 million to repay and terminate the Prior Term Loan Facility and (v) $42.9 million to pay down a portion of the ABL Facility, mostly offset by borrowing $350.0 million on the Term Loan Facility.
Net cash provided by financing activities was $24.7 million for fiscal 2015 and net cash used in financing activities was $4.4 million for fiscal 2014. The increase in fiscal 2015 compared to fiscal 2014 was driven primarily by proceeds from borrowings under our credit agreements. The cash provided by operations for fiscal 2014 allowed us to make capital investments, as well as, pay down a portion of the Prior Term Loan Facility.
Our Credit Facilities
We have two arrangements governing our material outstanding indebtedness: our ABL Facility and our Term Loan Facility.
The indebtedness outstanding under our Credit Facilities is secured by substantially all of our assets. In particular, the indebtedness outstanding under (i) the ABL Facility is secured by a first-priority security interest in all of our current assets, including inventory and accounts receivable, and a second-priority security interest in the collateral that secures the Term Loan Facility on a first-priority basis, and (ii) the Term Loan Facility is secured by a first-priority security interest in all of our fixed assets and intellectual property, and a second- priority interest in the collateral that secures the ABL Facility on a first- priority basis.
The Term Loan Facility requires quarterly repayments of approximately $875 thousand, which commenced on December 31, 2016, with the remainder due and payable at maturity.
As of December 29, 2016, the Term Loan Facility bore interest based on one of the following rates, at our option:
77
The ABL Facility initially accrued interest ranging from LIBOR + 1.50% to LIBOR + 2.00%, and as of December 29, 2016 was subject to a pricing grid based on average daily availability under such facility ranging from LIBOR + 1.25% to 1.50%. The ABL Facility allows us to borrow up to $200 million, subject to the borrowing base requirements, set forth in the credit agreement governing the ABL Facility. As of December 29, 2016, we had the ability to access $121.7 million of unused borrowings under the ABL Facility without violating any covenants thereunder and had $10.1 million in outstanding letters of credit.
The credit agreements governing our Credit Facilities contain customary restrictive covenants that, among other things and with certain exceptions, limit our ability to (i) incur additional indebtedness and liens in connection therewith; (ii) pay dividends and make certain other restricted payments; (iii) effect mergers or consolidations; (iv) enter into transactions with affiliates; (v) sell or dispose of property or assets; and (vi) engage in unrelated lines of business. In addition, these credit agreements subject us to certain reporting obligations and require that we satisfy certain financial covenants, including, among other things:
The Term Loan Facility has no financial maintenance covenants. As of December 29, 2016, we were in compliance in all material respects with the covenants of the Credit Facilities and no Event of Default (as defined in the credit agreements governing our Credit Facilities) had occurred.
For more information on our Credit Facilities, see "Use of Proceeds."
Contractual Obligations
We enter into long-term obligations and commitments in the normal course of business, primarily debt obligations and non-cancelable operating leases. As of December 29, 2016, without giving effect to this offering, our contractual cash obligations over the next several periods were as follows:
| |
Payments due by period | |||||||||||||||||||||
|---|---|---|---|---|---|---|---|---|---|---|---|---|---|---|---|---|---|---|---|---|---|---|
(in thousands)
|
Total | Fiscal 2017 | Fiscal 2018 | Fiscal 2019 | Fiscal 2020 | Fiscal 2021 | Thereafter | |||||||||||||||
Term loans |
$ | 350,000 | $ | 3,500 | $ | 3,500 | $ | 3,500 | $ | 4,375 | $ | 2,625 | $ | 332,500 | ||||||||
Revolving loan |
50,000 | — | — | — | — | 50,000 | — | |||||||||||||||
Estimated interest(1) |
122,951 | 18,530 | 18,344 | 18,158 | 19,540 | 16,266 | 32,113 | |||||||||||||||
Operating leases(2) |
717,537 | 63,340 | 71,913 | 73,580 | 71,598 | 67,875 | 369,231 | |||||||||||||||
Letters of credit |
10,119 | 10,119 | — | — | — | — | — | |||||||||||||||
Purchase obligations(3) |
157,384 | 157,384 | — | — | — | — | — | |||||||||||||||
| | | | | | | | | | | | | | | | | | | | | | | |
Total |
$ | 1,407,991 | $ | 252,873 | $ | 93,757 | $ | 95,238 | $ | 95,513 | $ | 136,766 | $ | 733,844 | ||||||||
| | | | | | | | | | | | | | | | | | | | | | | |
| | | | | | | | | | | | | | | | | | | | | | | |
| | | | | | | | | | | | | | | | | | | | | | | |
78
Off-Balance Sheet Arrangements
We do not have any relationship with unconsolidated entities or financial partnerships for the purpose of facilitating off-balance sheet arrangements or for other contractually narrow or limited purposes.
Critical Accounting Policies and Estimates
The preparation of financial statements in accordance with accounting principles generally accepted in the United States requires management to make estimates and assumptions about future events that affect amounts reported in our consolidated financial statements and related notes, as well as the related disclosure of contingent assets and liabilities at the date of the financial statements. Management evaluates its accounting policies, estimates and judgments on an ongoing basis. Management bases its estimates and judgments on historical experience and various other factors that are believed to be reasonable under the circumstances. Actual results may differ under different assumptions and conditions, and such differences could be material to the consolidated financial statements.
Management evaluated the development and selection of its critical accounting policies and estimates and believes that the following involve a higher degree of judgment or complexity and are the most significant to reporting our results of operations and financial position, and are therefore discussed as critical. The following critical accounting policies reflect the significant estimates and judgments used in the preparation of our consolidated financial statements. With respect to critical accounting policies, even a relatively minor variance between actual and expected experience can potentially have a materially favorable or unfavorable impact on subsequent results of operations. More information on all of our significant account policies can be found in Note 1—Nature of Business and Note 2—Summary of Significant Accounting Policies to our audited consolidated financial statements included elsewhere in this prospectus.
Revenue Recognition
Retail sales at our stores are recorded at the point of sale and are net of sales discounts and estimated returns. We recognize revenue and the related cost of sales when both collection or reasonable assurance of collection of payment and final delivery of the product have occurred. For orders placed through our website and shipped to our customers, we recognize revenue and the related cost of sales at the time we estimate the customer receives the merchandise, which is typically within a few days of shipment. In certain cases, we arrange and pay for freight to deliver products to our customers, and bill the customer for the estimated freight cost, which is included in net sales. Sales taxes collected are not recognized as revenue as these amounts are ultimately remitted to the appropriate taxing authorities.
We reserve for future returns of previously sold merchandise based on historical experience and various other assumptions that we believe to be reasonable. This reserve reduces sales and cost of sales, accordingly. Merchandise exchanges of similar product and price are not considered merchandise returns and, therefore, are excluded when calculating the sales returns reserve.
79
Gift Cards and Merchandise Credits
We sell gift cards to our customers in our stores and through our website and issue merchandise credits in our stores. We account for the programs by recognizing a liability at the time the gift card is sold or the merchandise credit is issued. The liability is relieved and revenue is recognized upon redemption. Prior to February 1, 2013, we recognized revenue on unredeemed gift cards based on the estimated rate of gift card breakage, which was applied over the period of estimated performance. Net sales related to the estimated breakage are included in net sales in the consolidated statement of income. On February 1, 2013, we entered into an agreement with an unrelated third-party who became the issuer of our gift cards going forward and also assumed the existing liability for unredeemed gift cards for which there were no currently existing claims under unclaimed property statutes. We are no longer the primary obligor for the third-party issued gift cards and are therefore not subject to claims under unclaimed property statutes, as the agreement effectively transfers the ownership of such unredeemed gift cards and the related future escheatment liability, if any, to the third-party. Accordingly, gift card breakage income of $0.6 million, $0.5 million, and $0.4 million was recognized in fiscal 2016, fiscal 2015, and fiscal 2014, respectively, for such unredeemed gift cards.
Inventory Valuation and Shrinkage
Inventories consist of merchandise held for sale and are stated at the lower of cost and net realizable value. When evidence exists that the net realizable value of inventory is lower than its cost, the difference is recorded in cost of sales in the consolidated statement of income as a loss in the period in which it occurs. We determine inventory costs using the weighted average cost method. We capitalize transportation, duties and other costs to get product to our retail locations. We provide provisions for losses related to shrinkage and other amounts that are otherwise not expected to be fully recoverable. These provisions are calculated based on historical shrinkage, selling price, margin and current business trends. The estimates have calculations that require management to make assumptions based on the current rate of sales, age, salability and profitability of inventory, historical percentages that can be affected by changes in our merchandising mix, customer preferences, rates of sell through and changes in actual shrinkage trends. We do not believe there is a reasonable likelihood that there will be a material change in the assumptions we use to calculate our inventory provisions. However, if actual results are not consistent with our estimates and assumptions, we may be exposed to losses or gains that could be material.
Income Taxes
We account for income taxes under the asset and liability method, which requires the recognition of deferred tax assets and liabilities for the future tax consequences attributable to differences between the financial statement carrying amounts and tax bases of existing assets and liabilities. Deferred tax assets and liabilities are measured using enacted tax rates expected to apply to taxable income in the years in which those temporary differences are expected to be recovered or settled. Changes in tax laws and rates could affect recorded deferred tax assets and liabilities in the future. The effect on deferred tax assets and liabilities of a change in tax laws or rates is recognized in the period that includes the enactment date of such a change.
The ultimate realization of deferred tax assets is dependent upon the generation of future taxable income during the periods in which the associated temporary differences became deductible. On a quarterly basis, we evaluate whether it is more likely than not that our deferred tax assets will be realized in the future and conclude whether a valuation allowance must be established.
We include any estimated interest and penalties on tax-related matters in income taxes payable and income tax expense. Current guidance clarifies the accounting for uncertainty in income taxes recognized in an entity's financial statements and prescribes threshold and measurement attributes for
80
financial statement disclosure of tax positions taken or expected to be taken on a tax return. Under the relevant authoritative literature, the impact of an uncertain income tax position on the income tax return must be recognized at the largest amount that is more likely than not to be sustained upon audit by the relevant taxing authority. An uncertain income tax position will not be recognized if it has less than a 50 percent likelihood of being sustained.
Goodwill and Other Indefinite-Lived Intangible Assets
We have identified each of the five geographic regions (the East, Northeast, Southeast, Central and West) of our operating segment as separate components and have determined that these components have similar economic characteristics and therefore should be aggregated into one reporting unit. We reached this conclusion based on the level of similarity of a number of quantitative and qualitative factors, including net sales, gross profit margin percentage, the manner in which we operate our business, the similarity of hard surface flooring products, operating procedures, marketing initiatives, store layout, employees, customers and methods of distribution, as well as the level of shared resources between the components.
We complete an impairment test of goodwill and other indefinite-lived intangible assets at least annually or more frequently if indicators of impairment are present. We obtain independent third-party valuation studies to assist us with determining the fair value of goodwill and indefinite-lived intangible assets. Our goodwill and other indefinite-lived intangible assets subject to impairment testing arose primarily as a result of our acquisition of F&D in November 2010.
We qualitatively assess goodwill to determine whether it is more likely than not that the fair value of our reporting unit is less than its carrying value. We also perform a two-step quantitative impairment test on goodwill. In the first step, we compare the fair value of the reporting unit to its carrying value. If the fair value of the reporting unit exceeds the carrying value of the net assets assigned to that unit, goodwill is considered not impaired, and we are not required to perform further testing. If the carrying value of the net assets assigned to the reporting unit exceeds the fair value of the reporting unit, then we must perform the second step of the impairment test in order to determine the implied fair value of the reporting unit's goodwill. If the carrying value of a reporting unit's goodwill exceeds its implied fair value, then we would record an impairment loss equal to the difference.
We estimate the fair value of our reporting unit using a combination of the income approach and the market approach. The income approach utilizes a discounted cash flow model incorporating management's expectations for future revenue, operating expenses, earnings before interest, taxes, depreciation and amortization, taxes and capital expenditures. We discount the related cash flow forecasts using our estimated weighted-average cost of capital at the date of valuation. The market approach utilizes comparative market multiples in the valuation estimate. Multiples are derived by relating the value of guideline companies in our industry and with similar growth prospects, based on either the market price of publicly traded shares or the prices of companies being acquired in the marketplace, to various measures of their earnings and cash flow. Such multiples are then applied to our historical and projected earnings and cash flow in developing the valuation estimate.
Preparation of forecasts and the selection of the discount rates involve significant judgments about expected future business performance and general market conditions. Significant changes in our forecasts, the discount rates selected or the weighting of the income and market approach could affect the estimated fair value of one or more of our reporting units and could result in a goodwill impairment charge in a future period.
Based on the goodwill asset impairment analysis performed quantitatively on October 23, 2015, we determined that the fair value of our reporting unit is substantially in excess of the carrying value. No events or changes in circumstances have occurred since the date of our most recent annual
81
impairment test to indicate that the fair value of a reporting unit would be less than its carrying amount.
We annually evaluate whether indefinite-lived assets continue to have an indefinite life or have impaired carrying values due to changes in the asset(s) or their related risks. The impairment review is performed by comparing the carrying value to the estimated fair value, determined using a discounted cash flow methodology. If the recorded carrying value of the indefinite-lived asset exceeds its estimated fair value, an impairment charge is recorded to write the asset down to its estimated fair value.
Our goodwill and other indefinite-lived intangible assets impairment loss calculations contain uncertainties because they require management to make significant judgments estimating the fair value of our reporting unit and indefinite-lived intangible assets, including the projection of future cash flows, assumptions about which market participants are the most comparable, the selection of discount rates and the weighting of the income and market approaches. These calculations contain uncertainties because they require management to make assumptions such as estimating economic factors and the profitability of future business operations and, if necessary, the fair value of a reporting unit's assets and liabilities among others. Further, our ability to realize the future cash flows used in our fair value calculations is affected by factors such as changes in economic conditions, changes in our operating performance and changes in our business strategies. Significant changes in any of the assumptions involved in calculating these estimates could affect the estimated fair value of our reporting unit and indefinite-lived intangible assets and could result in impairment charges in a future period.
We do not believe there is a reasonable likelihood that there will be a material change in the future estimates or assumptions we use in our goodwill or other tests of impairment. Based on the results of our annual impairment tests for goodwill and other indefinite-lived intangible assets, no impairment was recorded. Based on this assessment, we believe that our goodwill and other indefinite-lived intangible assets are not at risk of impairment. However, if actual results are not consistent with our estimates or assumptions or there are significant changes in any of these estimates, projections or assumptions, it could have a material effect on the fair value of these assets in future measurement periods and result in an impairment, which could materially affect our results of operations.
Long-Lived Assets
Long-lived assets, such as fixed assets and intangible assets with finite lives, are reviewed for impairment whenever events or changes in circumstances indicate that the carrying amount of an asset may not be recoverable. Conditions that may indicate impairment include, but are not limited to, a significant adverse change in customer demand or business climate that could affect the value of an asset, a product recall or an adverse action by a regulator. If the sum of the estimated undiscounted future cash flows related to the asset is less than the asset's carrying value, we recognize a loss equal to the difference between the carrying value and the fair value, usually determined by the estimated discounted cash flow analysis of the asset.
Since there is typically no active market for our definite-lived intangible assets, we estimate fair values based on expected future cash flows at the time they are identified. We estimate future cash flows based on store-level historical results, current trends and operating and cash flow projections. We amortize these assets with finite lives over their estimated useful lives on a straight-line basis. This amortization methodology best matches the pattern of economic benefit that is expected from the definite-lived intangible assets. We evaluate the useful lives of its intangible assets on an annual basis.
Stock-Based Compensation
We account for employee stock options in accordance with relevant authoritative literature. Given the absence of a public trading market for our common stock, the fair value of the common stock underlying our share-based awards was determined by our compensation committee, with input
82
from management as well as valuation reports prepared by an unrelated nationally recognized third-party valuation specialist, in each case using the income and market valuation approach. We believe that our compensation committee has the relevant experience and expertise to determine the fair value of our common stock. In accordance with the American Institute of Certified Public Accountants Accounting and Valuation Guide: Valuation of Privately-Held-Company Equity Securities Issued as Compensation, our compensation committee exercised reasonable judgment and considered numerous objective and subjective factors to determine the best estimate of the fair value of our common stock including:
These estimates will not be necessary to determine the fair value of new awards once the underlying shares begin trading publicly.
Stock options are granted with exercise prices equal to or greater than the estimated fair market value on the date of grant as authorized by our board of directors or compensation committee. Options granted have vesting provisions ranging from three to five years. Stock option grants are generally subject to forfeiture if employment terminates prior to vesting. We have selected the Black-Scholes option pricing model for estimating the grant date fair value of stock option awards granted. We have considered the retirement and forfeiture provisions of the options and utilized our historical experience to estimate the expected life of the options. We base the risk-free interest rate on the yield of a zero coupon U.S. Treasury security with a maturity equal to the expected life of the option from the date of the grant. We estimate the volatility of the share price of our common stock by considering the historical volatility of the stock of similar public entities. We estimate the dividend yield to be zero as we do not intend to pay dividends in the future. In determining the appropriateness of the public entities included in the volatility assumption we considered a number of factors, including the entity's life cycle stage, growth profile, size, financial leverage and products offered. Stock-based compensation cost is measured at the grant date based on the value of the award, net of estimated forfeitures, and is recognized as expense over the requisite service period based on the number of years for which the requisite service is expected to be rendered.
Self-Insurance Reserves
We are partially self-insured for workers' compensation and general liability claims less than certain dollar amounts and maintains insurance coverage with individual and aggregate limits. We also have a basket aggregate limit to protect against losses exceeding $5.0 million (subject to adjustment and
83
certain exclusions) for workers' compensation claims and general liability claims. Our liabilities represent estimates of the ultimate cost for claims incurred, including loss adjusting expenses, as of the balance sheet date. The estimated liabilities are not discounted and are established based upon analysis of historical data, actuarial estimates, regulatory requirements, an estimate of claims incurred but not yet reported and other relevant factors. The liabilities are reviewed by management utilizing third-party actuarial studies on a regular basis to ensure that they are appropriate. While we believe these estimates are reasonable based on the information currently available, if actual trends, including the severity or frequency of claims, medical cost inflation or fluctuations in premiums, differ from our estimates, our results of operations could be impacted.
Recently Issued Accounting Pronouncements
In January 2017, the Financial Accounting Standards Board ("FASB") issued Accounting Standards Update ("ASU") No. 2017-04, "Intangibles—Goodwill and Other (Topic 350): Simplifying the Test for Goodwill Impairment." This standard simplifies how an entity is required to test goodwill for impairment by eliminating Step 2 from the goodwill impairment test. ASU No. 2017-04 is effective for fiscal years beginning after December 15, 2019, and interim periods within those fiscal years, with early adoption permitted after January 1, 2017. The amendments in this update should be applied using a prospective approach. The adoption of ASU No. 2017-04 is not expected to have a material impact on our Consolidated Financial Statements.
In October 2016, the FASB issued ASU No. 2016-16, "Income Taxes (Topic 740): Intra-Entity Transfers of Assets Other Than Inventory." This standard update requires an entity to recognize the income tax consequences of intra-entity transfers of assets other than inventory when the transfer occurs. ASU No. 2016-16 is effective for fiscal years beginning after December 15, 2017, and interim periods within those fiscal years, with early adoption permitted. The amendments in this update should be applied using a modified retrospective approach. The adoption of ASU No. 2016-16 is not expected to have a material impact on our Consolidated Financial Statements.
In August 2016, the FASB issued ASU No. 2016-15, "Statement of Cash Flows (Topic 230): Classification of Certain Cash Receipts and Cash Payments." The standard update addresses eight specific cash flow issues with the objective of reducing the existing diversity in practice. ASU No. 2016-15 is effective for fiscal years beginning after December 15, 2017, and interim periods within those fiscal years, with early adoption permitted. The amendments in this update should be applied using a retrospective approach. The adoption of ASU No. 2016-15 is not expected to have a material impact on our Consolidated Statements of Cash Flows.
In March 2016, the FASB issued ASU No. 2016-09, "Compensation—Stock Compensation (Topic 718): Improvements to Employees Share-Based Payment Accounting." The update is intended to simplify several areas of accounting for share-based compensation arrangements, including the income tax impact, classification on the statement of cash flows and forfeitures. The amendments in this update are effective for fiscal years beginning after December 15, 2016, and interim periods within those years, with early adoption permitted. Depending on the amendment, methods used to apply the requirements of the update include modified retrospective, retrospective, and prospective. We elected to early adopt this standard during 2016. The adoption of this standard resulted in an immaterial modified retrospective adjustment on our consolidated balance sheet as of the beginning of fiscal 2016.
In February 2016, the FASB issued ASU No. 2016-02, "Leases (Topic 842)." ASU No. 2016-02 requires that lessees recognize lease assets and lease liabilities for all leases with greater than 12 month terms on the balance sheet. The guidance also requires disclosures about the amount, timing and uncertainty of cash flows arising from leases. This new guidance is effective for fiscal years beginning after December 15, 2018 and interim periods within those years, with early adoption permitted. The standard must be applied using a modified retrospective approach. We are currently evaluating the
84
impact that ASU No. 2016-02 will have on our Consolidated Financial Statements. When implemented, we believe the new standard will have a material impact on our consolidated balance sheet. We are currently evaluating the effect that implementation of this standard will have on our consolidated statements of income, cash flows, financial position and related disclosures.
In July 2015, the FASB issued ASU No. 2015-11, "Inventory (Topic 330): Simplifying the Measurement of Inventory." ASU No. 2015-11 provides new guidance for entities using first-in, first-out or average cost to simplify the subsequent measurement of inventory, which proposes that inventory should be measured at the lower of cost and net realizable value. Net realizable value is defined as the estimated selling prices in the ordinary course of business, less reasonably predictable costs of completion, disposal, and transportation. This guidance eliminates the option to subsequently measure inventory at replacement cost or net realizable value less an approximately normal profit margin. This new guidance is effective for fiscal years beginning after December 15, 2016 and interim periods within those years, with early adoption permitted. The amendments in this update should be applied prospectively. The adoption of ASU No. 2015-11 is not expected to have a material impact on our Consolidated Financial Statements.
In May 2014, the FASB issued ASU No. 2014-09, "Revenue from Contracts with Customers (Topic 606)." ASU No. 2014-09 provides new guidance related to the core principle that an entity recognizes revenue to depict the transfer of promised goods or services to customers in an amount that reflects the consideration to which the entity expects to be entitled to receive in exchange for those goods or services provided. In July 2015, the FASB issued ASU No. 2015-14, "Revenue from Contracts with Customers (Topic 606): Deferral of the Effective Date," to defer the effective date by one year to December 15, 2017 for interim and annual reporting periods beginning after that date, and permitted early adoption of the standard, but not before the original effective date of December 15, 2016. In March 2016, the FASB issued ASU No. 2016-08 "Revenue from Contracts with Customers (Topic 606): Principal versus Agent Considerations (Reporting Revenue Gross versus Net)," which clarifies the guidance in ASU No. 2014-09 and has the same effective date as the original standard. In April 2016, the FASB issued ASU No. 2016-10, "Revenue from Contracts with Customers (Topic 606): Identifying Performance Obligations and Licensing." In May 2016, the FASB issued ASU 2016-12, "Revenue from Contracts with Customers (Topic 606): Narrow-Scope Improvements and Practical Expedients. The 2016 updates to the revenue recognition guidance relate to principal versus agent assessments, identifying performance obligations, the accounting for licenses, and certain narrow scope improvements and practical expedients. This new standard could impact the timing and amounts of revenue recognized. As we evaluate the impact of this standard, the more significant change relates to the timing of revenue recognized for certain transactions for which we allow customers to store their merchandise at the retail store for final delivery at a later date. We are continuing to evaluate the impact this standard, and related amendments and interpretive guidance, will have on our consolidated financial statements. We plan to adopt the new standard on a modified retrospective basis beginning the first day of fiscal 2018.
Quantitative and Qualitative Disclosure of Market Risk
Foreign Currency Risk
We contract for production with third parties primarily in Asia and Europe. While substantially all of these contracts are stated in U.S. dollars, there can be no assurance that the cost for the future production of our products will not be affected by exchange rate fluctuations between the U.S. dollar and the local currencies of these contractors. Due to the number of currencies involved, we cannot quantify the potential impact of future currency fluctuations on net income (loss) in future years. To date, such exchange fluctuations have not had a material impact on our financial condition or results of operations.
85
Interest Rate Risk
Our operating results are subject to risk from interest rate fluctuations on our Credit Facilities, which carry variable interest rates. As of December 29, 2016, our outstanding variable rate debt aggregated approximately $400.0 million. Based on December 29, 2016 debt levels, an increase or decrease of 1% in the effective interest rate would cause an increase or decrease in interest cost of approximately $4.0 million over the next 12 months. To lessen our exposure to changes in interest rate risk, we entered into $205.0 million interest rate cap agreements in November 2016 with Bank of America and Wells Fargo (collectively, the "Cap Agreements") that cap our LIBOR at 2.0% beginning in December 2016.
Impact of Inflation/Deflation
We do not believe that inflation has had a material impact on our net sales or operating results for the past three fiscal years. However, substantial increases in costs, including the price of raw materials, labor, energy and other inputs used in the production of our merchandise, could have a significant impact on our business and the industry in the future. Additionally, while deflation could positively impact our merchandise costs, it could have an adverse effect on our average unit retail price, resulting in lower net sales and operating results.
Changes in and Disagreements with Accountants on Accounting and Financial Disclosure
None.
Internal Control over Financial Reporting
The process of improving our internal controls has required and will continue to require us to expend significant resources to design, implement and maintain a system of internal controls that is adequate to satisfy our reporting obligations as a public company. There can be no assurance that any actions we take will be completely successful. We will continue to evaluate the effectiveness of our disclosure controls and procedures and internal control over financial reporting on an ongoing basis. As part of this process, we may identify specific internal controls as being deficient.
We have begun documenting and testing internal control procedures in order to comply with the requirements of Section 404(a) of the Sarbanes-Oxley Act. Section 404 requires annual management assessments of the effectiveness of our internal control over financial reporting and a report by our independent auditors addressing these assessments. We must comply with Section 404 no later than the time we file our annual report for fiscal 2018 with the SEC.
86
Our Company
Founded in 2000, Floor & Decor is a high-growth, differentiated, multi-channel specialty retailer of hard surface flooring and related accessories with 72 warehouse-format stores across 17 states. We believe that we offer the industry's broadest in-stock assortment of tile, wood, laminate and natural stone flooring along with decorative and installation accessories at everyday low prices positioning us as the one-stop destination for our customers' entire hard surface flooring needs. We appeal to a variety of customers, including Pro, DIY and BIY. Our Pro customers are loyal, shop often and help promote our brand. The combination of our category and product breadth, low prices, in-stock inventory in project-ready quantities, proprietary credit offerings, free storage options and dedicated customer service positions us to gain share in the attractive Pro customer segment. We believe our DIY customers spend significant time planning their projects while conducting extensive research in advance. We provide our customers with the education and inspiration they need before making a purchase through our differentiated online and in-store experience.
Our warehouse-format stores, which average approximately 72,000 square feet, are typically larger than any of our specialty retail flooring competitors' stores. Other large format home improvement retailers only allocate a small percentage of their floor space to hard surface flooring and accessories. When our customers walk into a Floor & Decor store for the first time, we believe they are amazed by our visual presentation, our store size, our everyday low prices and the breadth and depth of our merchandise. We believe that our inspiring design centers, creative and informative visual merchandising, and accessible price points greatly enhance our customers' experience. Our stores are easy to navigate and designed to interactively showcase the wide array of designs and product styles a customer can create with our flooring and decorative accessories. We engage our customers both through our trained store associates and designers who can assist in narrowing choices and making the process of home renovation easier, as well as our staff dedicated to serving Pro customers. By carrying a deep level of hard surface flooring inventory and wide range of tools and accessories, we seek to offer our customers immediate availability on everything they need to complete their entire flooring or remodeling project. In addition to our stores, our website FloorandDecor.com showcases our products, offers informational training and design ideas and has our products available for sale, which a customer can pick up in-store or have delivered. Our ability to purchase directly from manufacturers through our direct sourcing model enables us to be fast to market with a balanced assortment of bestseller and unique, hard to find items that are the latest trend-right products. We believe these factors create a differentiated value proposition for Floor & Decor and drive customer loyalty with our Pro, DIY and BIY hard surface flooring customers in our markets, as evidenced by our track record of consistent double digit comparable store sales growth. Based on these characteristics, we believe Floor & Decor is redefining and expanding the addressable market size of the hard surface flooring category and that we have an opportunity to significantly expand our store base to approximately 400 stores nationwide within the next 15 years, as described in more detail below.
Our company was founded in 2000 by our Vice Chairman Vincent West, who opened the first Floor & Decor store in Atlanta, Georgia, with the vision of being the low-price leader for hard surface flooring. As we have grown, we have implemented a customer-focused and decentralized approach to managing our business. We provide our store leadership and regional operating teams with regular training and sophisticated information technology systems. We also train and incentivize our store associates to deliver a superior experience to our customers. Taken together, these elements create a customer-centric culture that helps us achieve our operational and financial goals.
Over the last five years, we have invested significant resources across our business and infrastructure to support innovation and growth. We believe that these investments will continue to strengthen our customer value proposition and further differentiate Floor & Decor from our
87
competition, positioning us for continued market share gains. We have made significant investments in product innovation across all categories, improving our assortment and seeking to provide more value to our Pro, DIY and BIY customers. We have also invested in technology and personnel to support our stores. From fiscal 2011 to fiscal 2014, our general and administrative expenses and capital expenditures grew at a rate exceeding our net sales growth. We believe that these investments have enabled us to drive successful, scalable growth, as demonstrated by the doubling of our average net sales per store between fiscal 2011 and fiscal 2016 (for all stores open prior to fiscal 2011). We believe that our investment in our business will continue to improve our customer value proposition, differentiating us and strengthening our competitive advantage.
We believe our strong financial results are a reflection of our consistent and disciplined culture of innovation and reinvestment, creating a differentiated business model in the hard surface flooring category, as evidenced by the following:
| Net Sales (in millions) |
Comparable Store Sales Growth |
|
|---|---|---|
|
|
|
Our Competitive Strengths
We believe our strengths, described below, set us apart from our competitors and are the key drivers of our success.
88
Unparalleled Customer Value Proposition. Our customer value proposition is a critical driver of our business. The key components include:
Differentiated Assortment Across a Wide Variety of Hard Surface Flooring Categories. Our stores are generally larger than those of our specialty retail flooring competitors, and we allocate substantially more square footage to hard surface flooring and accessories than large home improvement retailers. We believe we have the most comprehensive in-stock, trend-right product assortment in the industry within our categories with on average approximately 3,500 SKUs in each store, which based on our market experience is a far greater in-stock offering than any other flooring retailer. Additionally, we customize our product assortment at the store level for the regional preferences of each market. We have an ongoing product line review process across all categories that allows us to identify and interpret emerging trends in hard surface flooring. We work with our suppliers to quickly introduce new products and styles in our stores. We appeal to a wide range of customers through our "good/better/best" merchandise selection, as well as through our broad range of product styles from classic to modern, as well as new trend-right products. We consistently innovate with proprietary brands and products that appeal to certain customers with over 50 proprietary brands, including AquaGuard® and NuCore®.
Low Prices. We provide everyday low prices in the retail hard surface flooring market. Our merchandising and individual store teams competitively shop each market so that we can offer our flooring products and related accessories at low prices. We also work with our vendors to identify and create new, affordable products in categories traditionally considered high-end to further democratize hard surface flooring by providing a greater number of options to a larger customer base. We believe we are unique in our industry in employing an "everyday low price" strategy, where we strive to offer our products at consistently everyday low prices throughout the year instead of engaging in frequent promotional activities. Our ability to provide these low prices is supported by our direct-sourcing model, which strives to eliminate third-party intermediaries and shortens time to market. We believe this strategy creates trust with our Pro, DIY and BIY customers because they consistently receive low prices at Floor & Decor without having to wait for a sale or negotiate to obtain the lowest price.
One-Stop Project Destination with Immediate Availability. We carry an extensive range of products, from flooring and decorative accessories to thin set, underlayment, grout and tools, to fulfill a customer's entire flooring project. Our large in-stock assortment, including decorative and installation accessories, differentiates us from our competitors. Our stores stock job-size quantities to immediately fulfill a customer's entire flooring project. In the instance where product is not available in the store, our four regional distribution centers and neighboring stores can quickly ship a product to meet a customer's needs. On average, each warehouse-format store carries approximately 3,500 SKUs, which equates to 1.3 million square feet of flooring products or $2.5 million of inventory at cost. Customers also have access to all of our inventory for in-store pick up or delivery through FloorandDecor.com.
Unique and Inspiring Shopping Environment. Our stores average approximately 72,000 square feet and are typically designed with warehouse features including high ceilings, clear signage, bright lighting and industrial racking and are staffed with knowledgeable store associates. We offer an easy-to-navigate store layout with clear lines of sight and departments organized by our major product categories of tile, wood, laminate, natural stone, decorative accessories and installation accessories. We believe our unique signage, which clearly displays individual product features and benefits, improves the ease of shopping and facilitates customer decision making. We use merchandise displays and point of sale marketing throughout our stores to highlight product features, benefits and design elements. These
89
features educate and enable customers to visualize how the product would look in their homes or businesses. Furthermore, we encourage customers to interact with our merchandise, to experiment with potential designs and to see the actual product they will purchase, an experience that is not possible in flooring stores that do not carry in-stock inventory in project-ready quantities. The majority of our stores have design centers that showcase project ideas to further inspire our customers, and we employ experienced designers in all of our stores to provide free design consulting. Additionally, we provide a robust online experience for potential customers on FloorandDecor.com. For our DIY customers, we also offer weekly "how-to" installation classes on Saturdays. We believe inspiring and educating customers within our stores and on our website provides us with a significant competitive advantage in serving our customers.
Extensive Service Offering to Enhance the Pro Customer Experience. Our focus on meeting the unique needs of the Pro customer, and by extension the BIY customer, drives our estimated sales mix of approximately 60% Pro and BIY customers, which we believe represents a higher percentage than our competitors. We provide an efficient one-stop shopping experience for our Pro customers, offering low prices on a broad selection of high-quality flooring products, deep inventory levels to support immediate availability of our products, modest financial credit, free storage for purchased inventory, the convenience of early store hours and, in most stores, separate entrances for merchandise pick-up. Additionally, each store has a dedicated Pro sales force with technology to service our Pro customer more efficiently, and we have rolled out Pro Zones, which are areas offering a variety of services to Pro customers, in a majority of our stores. We believe by serving the needs of Pro customers, we drive repeat and high-ticket purchases, customer referrals and brand awareness from this attractive and loyal customer segment.
Decentralized Culture with an Experienced Store-Level Team and Emphasis on Training. We have a decentralized culture that empowers managers at the store and regional levels to make key decisions to maximize the customer experience. Our store managers, who carry the title Chief Executive Merchant, have significant flexibility to customize product mix, pricing, marketing, merchandising, visual displays and other elements in consultation with their regional leaders. We tailor the merchandising assortment for each of our stores for local market preferences, which we believe differentiates us from our national competitors that tend to have standard assortments across markets. Throughout the year, we train all of our employees on a variety of topics, including product knowledge, leadership and store operations. Our store managers and store department managers are an integral part of our company, and many have over 15 years of relevant industry experience in retail. We have made important investments in the training and development of our people, including the creation of a full time training department. Approximately 70% of our new store management positions are filled through internal promotions. We also have incentive compensation programs for all employees, regardless of position or title. We train prospective store managers at our Floor & Decor University, which is part of an extensive training program. Once a year, we hold a four day training session with our senior management, regional directors and store managers, where we focus on the upcoming year's strategic priorities to keep our entire business aligned. We believe our decentralized culture and coordinated training foster an organization aligned around providing a superior customer experience, ultimately contributing to higher net sales and profitability.
Sophisticated, Global Supply Chain. Our merchandising team has developed direct sourcing relationships with manufacturers and quarries in over 18 countries. Through these relationships, we believe we understand the best places to procure our various product categories. We currently source our products from more than 180 vendors worldwide and have developed long-term relationships with many of them. We often collaborate with our vendors to design and manufacture products for us to address emerging customer preferences that we observe in our stores and markets. We procure the majority of our products directly from the manufacturers, which eliminates additional costs from exporters, importers, wholesalers and distributors. We believe direct sourcing is a key competitive
90
advantage, as many of our specialty retail flooring competitors are too small to have the scale or the resources to work directly with suppliers. Over the past several years, we have established a Global Sourcing and Compliance Department to, among other things, enhance our policies and procedures to address compliance with appropriate regulatory bodies, including compliance with the requirements of the Lacey Act, the CARB and the EPA. We also utilize third -party consultants for audits, testing and surveillance to ensure product safety and compliance. Additionally, we have invested in technology and personnel to collaborate throughout the entire supply chain process to support our direct sourcing model, which has improved our ability to find, manage and source trend-right merchandise quickly and at lower costs, allowing us to offer products at low prices while maintaining attractive gross margins.
Highly Experienced Management Team with Proven Track Record. Led by our Chief Executive Officer, Tom Taylor, our management team brings substantial expertise from leading retailers and other companies across core functions, including store operations, merchandising, marketing, real estate, e-commerce, supply chain management, finance, legal and information technology. Tom Taylor, who joined us in 2012, spent 23 years at The Home Depot, where he most recently served as Executive Vice President of Merchandising and Marketing with responsibility for all stores in the United States and Mexico. Over the course of his career at The Home Depot, Tom Taylor helped expand the store base from fewer than 15 stores to over 2,000 stores. Our Executive Vice President and Chief Merchandising Officer, Lisa Laube, has over 30 years of merchandising and leadership experience with leading specialty retailers, including most recently as President of Party City. Our Executive Vice President and Chief Financial Officer, Trevor Lang, brings more than 20 years of accounting and finance experience, including 17 years of Chief Financial Officer and Vice President of Finance experience at public companies, including most recently as the Chief Financial Officer and Chief Administrative Officer of Zumiez Inc. Our entire management team drives our organization with a focus on strong merchandising, superior customer experience, expanding our store footprint, and fostering a strong, decentralized culture. We believe our management team is an integral component of our achieving strong financial results.
Our Growth Strategy
We expect to continue to drive our strong net sales and profit growth through the following strategies:
Open Stores in New and Existing Markets. We believe there is an opportunity to significantly expand our store base in the United States from 72 warehouse-format stores currently to approximately 400 stores nationwide over the next 15 years based on our internal research with respect to housing density, demographic data, competitor concentration and other variables in both new and existing markets. We plan to target new store openings in both existing and new, adjacent and underserved markets. We have a disciplined approach to new store development, based on an analytical, research-driven site selection method and a rigorous real estate approval process. We believe our new store model delivers strong financial results and returns on investment, targeting net sales on average of $10 million to $13 million and positive four-wall Adjusted EBITDA in the first year, pre-tax payback in two to three years and cash-on-cash returns of greater than 50% in the third year. On average, our stores opened after 2011 have exceeded this model. Over the past several years, we have made significant investments in personnel, information technology, warehouse infrastructure and connected customer strategies to support our current growth and the expansion of our stores. We intend to grow our store base by approximately 20% annually over the next several years. The performance of our new stores opened over the last three years, the performance of our older stores over that same time frame, our disciplined real estate strategy and the track record of our management team in successfully opening retail stores support our belief in the significant store expansion opportunity.
91
Increase Comparable Store Sales. We expect to grow our comparable store sales by continuing to offer our customers a dynamic and expanding selection of compelling, value-priced hard surface flooring and accessories while maintaining strong service standards for our customers. We regularly introduce new products into our assortment through our category product line review process, including collaboration with our vendors to bring to market innovative products such as water-resistant laminates. Because almost half of our stores have been opened for less than three years, we believe they will continue to drive comparable store sales growth as they ramp to maturity. While our newer stores generally have higher comparable store sales growth, our stores opened prior to 2012 averaged comparable store sales growth of 15.5% for fiscal 2016. We believe that we can continue to enhance our customer experience by focusing on service, optimizing sales and marketing strategies, investing in store staff and infrastructure, remodeling existing stores and improving visual merchandising and the overall aesthetic appeal of our stores. We also believe that growing our proprietary credit offering, further integrating connected customer strategies and enhancing other key information technology, will contribute to increased comparable store sales. As we increase awareness of Floor & Decor's brand, we believe there is a significant opportunity to gain additional market share, especially from independent flooring retailers and large format home improvement retailers. We are also adding adjacent categories that align with flooring projects like frameless glass in the bathroom and customized countertops for the kitchen. We believe the combination of these initiatives plus the expected growth of the hard surface flooring category described in more detail under "Our Industry" below will continue to drive strong comparable store sales growth.
Continue to Invest in the Pro Customer. We believe our differentiated focus on Pro customers has created a competitive advantage for us and will continue to drive our net sales growth. We will invest in gaining and retaining Pro customers due to their frequent and high-ticket purchases, loyalty and propensity to refer other potential customers. We have made important investments in the Pro services regional team to better recruit and train the Pro services team in each store, new technology such as integrated CRM software to help us further penetrate and grow our Pro business, dedicated phone lines for our Pro customers to call and text, commercial credit and open account terms, jobsite delivery, a dedicated website for Pro customers, training on technical flooring installation solutions, and tools to facilitate large commercial jobs sourced throughout the store. We plan to further invest in initiatives to increase speed of service, improve financing solutions, leverage technology, elevate our Pro branding, dedicate additional store and regional staffing to support Pro customers and enhance the in-store experience for our Pro customers. We have implemented a "Pro Zone" in a majority of our stores that focuses on the specific needs of the Pro customer. Additionally, we communicate our value proposition and various Pro-focused offerings by hosting a number of Pro networking events. Building on our success in serving the Pro customer, in 2016 we entered the adjacent commercial sales channel, thus increasing the size of the addressable market we serve. Our commercial effort, which we have branded F&D Commercial, initially targets corporate customers with large flooring needs across the hospitality, multi-family and retail sectors. We believe Pro customers will continue to be an integral part of our sales growth, and the commercial channel will provide incremental revenue and profit opportunities in the future.
Expand Our "Connected Customer" Experience. Floor & Decor's online experience allows our Pro, BIY and DIY customers to explore our product selection and design ideas before and after visiting our stores and offers the convenience of making online purchases for delivery or pick up in-store. We believe our online platform reflects our brand attributes and provides a powerful tool to educate, inspire and engage our consumers, and we view our website and multi-channel strategies as leading our brand. Our research indicates that 71% of our shoppers have visited our website. We continuously invest in our connected customer strategies to improve how our customers experience our brand. For example, we regularly update our website, which provides our customers with inspirational vignettes, videos, products and education. Additional initiatives include: (i) implementing our new CRM to obtain a single view of our customers, (ii) developing personalized content based on location,
92
purchase and browsing history, (iii) developing more relevant content and improved search and purchasing tools to help customers add decorative and installation accessories, (iv) creating frequently asked questions to help customers choose the best product for their jobs and (v) implementing online scheduling tools to access our designers. We believe this reinforces our unique customer value proposition and ultimately drives sales. Currently, e-commerce sales represent less than 5% of our total net sales. While the hard surface flooring category has a relatively low penetration of e-commerce sales due to the nature of the product, we believe our connected customer presence represents an attractive growth opportunity to drive consumers to Floor & Decor.
Enhance Margins Through Increased Operating Leverage Since 2011, we have invested significantly in our sourcing and distribution network, integrated IT systems and corporate overhead to support our growth. We expect to leverage these investments as we grow our net sales. Additionally, we believe operating margin improvement opportunities will include enhanced product sourcing processes and overall leveraging of our store-level fixed costs, existing infrastructure, supply chain, corporate overhead and other fixed costs resulting from increased sales productivity. We anticipate that the planned expansion of our store base and growth in comparable store sales will also support increasing economies of scale.
Our Industry
Floor & Decor operates in the large, growing and highly fragmented $10 billion hard surface flooring market (in manufacturers' dollars), which is part of the larger $20 billion U.S. floor coverings market (in manufacturers' dollars) based on the Catalina Floor Coverings Report. We estimate that after the retail markup, we represent only approximately 5% of an estimated $17 billion market. The competitive landscape of the hard surface flooring market includes big-box home improvement centers, national and regional specialty flooring retailers, and independent flooring retailers. We believe we benefit from growth in the overall hard surface flooring market, which, based on the Catalina Floor Coverings Report, grew on average 8% per year from 2012 to 2016 and is estimated to grow on average 5% per year from 2017 through 2021. We believe that growth in the hard surface flooring market has been and will continue to be driven by home remodeling demand drivers such as the aging household inventory, millennials forming households, existing home sales and the secular shift from carpet to hard surface flooring. In addition, we believe we have an opportunity to increase our market share as our competitors are unable to compete on our combination of price, service and in-stock assortment.
Based on our internal market research, key long-term industry trends include increasing spend on home renovations, aging of the existing housing stock, rising level of home ownership, growing average size of homes and favorable demographic trends. Based on the National Association of Home Builders Remodeling Market Index, current market conditions and future market indicators suggest that remodeling demand is accelerating in a strengthening home remodel cycle. For more than a decade, hard surface flooring has consistently taken share from carpet as a percentage of the total floor coverings market, increasing from 39% of the market in 2002 to 51% in 2015 based on the Catalina Floor Coverings Report. Historically, mix shift towards hard surface flooring has been driven by product innovation, changing consumer preferences, better hygiene qualities, increasing ease of installation and higher durability. Product innovation, which has been aided by the increasing use of technology such as inkjet tile printing, waterproof wood-look flooring and water-resistant laminates, and
93
non-traditional uses of hard surface flooring including walls, fireplaces and patios have increased the size of the hard surface flooring market and has allowed us to better serve customer needs.
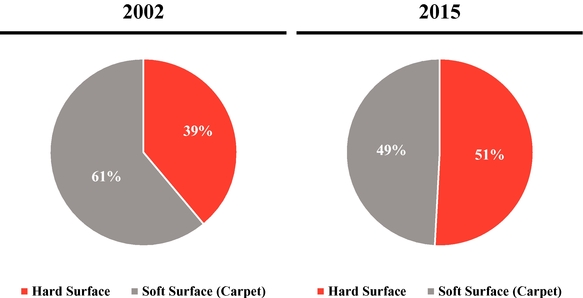
We believe we have an opportunity to continue to gain share in the hard surface flooring market with the largest selection of tile, wood, laminate, natural stone, decorative accessories and installation accessories. Our strong focus on the customer experience drives us to remain innovative and locally relevant while maintaining low prices and in-stock merchandise in a one-stop shopping destination.
Our Products
We offer an assortment of tile, wood, laminate and natural stone flooring, along with decorative and installation accessories at everyday low prices. Our objective is to carry a broad and deep product offering in order to be the one-stop destination for our customer's entire project needs. We seek to showcase products in our stores and online to provide multiple avenues for inspiration throughout a customer's decision-making process.
Our strategy is to fulfill the product needs of our Pro, DIY and BIY customers with our extensive assortment, in-stock inventory and merchandise selection across a broad range of price points. We offer bestseller products in addition to the more unique, hard to find items that we believe our customers have come to expect from us. We source our products from around the world, constantly seeking new and exciting merchandise to offer our customers. Our goal is to be at the forefront of hard surface flooring trends in the market, while offering low prices given our ability to source directly from manufacturers and quarries.
We utilize a regional merchandising strategy in order to carry products in our stores that cater to the preferences of our local customer base. This strategy is executed by our experienced merchandising team, which consists of store support center merchants and regional merchants, who work with our individual stores to ensure they have the appropriate product mix for their location. Our store support center merchants are constantly seeking new products and following trends by attending trade shows and conferences, as well as by shopping the competition, while our store associates are in touch with customers in the store. We schedule regular meetings to review information gathered and make future product development decisions. This constant connectivity between our stores, regional merchants, store support center merchants and our vendors allows us to quickly bring new and compelling products to market.
94
Our fiscal 2016 net sales by key product categories are set forth below:

Category
|
Products Offered | Select Product Highlights | ||
|---|---|---|---|---|
Tile |
Porcelain, White Body, Ceramic | We offer a wide selection of Porcelain, White Body and Ceramic tiles from 4"x4" all the way up to 24"x72". We source many products directly from Italy, where many design trends in tile originate. We offer traditional stone looks as well as wood-looking planks and contemporary products like cement-look and vein cut styles. We work with many factories in the United States, China, Italy, Mexico, Brazil and other countries to bring the most in-demand styles at low prices. | ||
Wood |
Solid Prefinished Hardwood, Solid Unfinished Hardwood, Engineered Hardwood, Bamboo, Cork |
We sell common species such as Oak, Walnut, Birch and Maple but also exotics such as Bamboo, Brazilian Cherry, African Mahogany and Taun, all in multiple colors. Our wood flooring comes in multiple widths from 21/4" up to 93/4" wide planks. Customers have the option of buying prefinished or unfinished flooring in many of our stores. |
||
Natural Stone |
Granite, Travertine, Marble, Slate |
Natural stone is quarried around the world, and we typically buy directly from the source. For example, we buy marble from Italy, Spain, Turkey and China, travertine from Turkey, Peru and Mexico, and slate from India. We work with factories in these countries and others to cut stone tiles in many sizes, finishes and colors. |
95
Category
|
Products Offered | Select Product Highlights | ||
|---|---|---|---|---|
Laminate/Luxury Vinyl Plank ("LVP") |
Laminate Flooring, Luxury Vinyl Wood Plank, Vinyl Composite Tile |
Wood look Laminate, NuCore® and Luxury Vinyl Plank flooring is offered in styles that mimic our bestselling wood species, colors and finishes. Our product offers easy locking installation, many are water-resistant and all are great for customers who want the beauty of real hardwood but the ease and convenience that laminate, NuCore® and LVP offers. |
||
Decorative Accessories |
Glass Tile, Stone Mosaics, Decoratives, Prefabricated Countertops, Medallions, Wall Tile |
With over 700 choices in glass, stone mosaics and decoratives, we can customize nearly any look or style a customer desires. This high margin, trend-forward, distinctive category is a favorite of our designers and offers customers an inexpensive way to quickly update a backsplash or shower. |
||
Accessories (Installation Materials and Tools) |
Grout, Adhesives, Mortar, Backer Board, Power Tools, Wood Moldings |
This category offers everything a customer needs to complete his or her project, including backer board, mortar, grout, wood glues, molding and tools. We sell top brands, which we believe are highly valued by our customers. |
Stores
We operate 72 warehouse-format stores across 17 states and one small 5,500 square foot design center. Most of our stores are situated in highly visible retail and industrial locations. Our warehouse-format stores average approximately 72,000 square feet and carry on average approximately 3,500 flooring, decorative and installation accessory SKUs, which equates to approximately 1.3 million square feet of flooring products or $2.5 million of inventory at cost.
96
The map below reflects our store base:
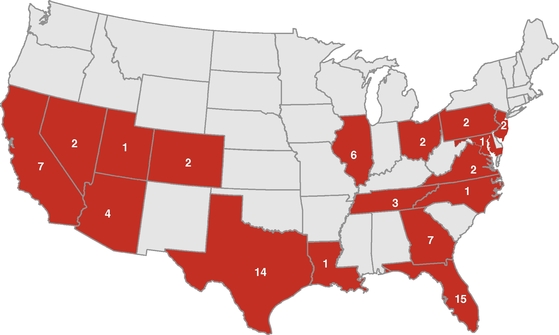
Each of our stores is led by a store manager who holds the title Chief Executive Merchant and is supported by an operations manager, department managers and a Pro sales manager. Our store managers focus on providing superior customer service and creating customized store offerings that are tailored to meet the specific needs of their stores. Beyond the store managers, each store is staffed with associates, the number of whom vary depending on sales volume and size of the store. We dedicate significant resources to training all of our new store managers through Floor & Decor University and in the field across all product areas, with store-level associates receiving certification on specific product areas. Ongoing training and continuing education is provided for all employees throughout the year.
We believe there is an opportunity to significantly expand our store base in the United States from our 72 warehouse-format stores currently to approximately 400 stores nationwide within the next 15 years based on our internal research with respect to housing density, demographic data, competitor concentration and other variables in both new and existing markets. Over the next several years, we plan to grow our store base by approximately 20% per year, with approximately half being opened in existing geographies and approximately half being opened in new markets. We have developed a disciplined approach to new store development, based on an analytical, research-driven method to site selection and a rigorous real estate review and approval process. By focusing on key demographic characteristics for new site selection, such as aging of homes, length of home ownership and median income, we expect to open stores with attractive returns.
When opening new stores, inventory orders are placed several months prior to a new store opening. Significant investment is made in building out or constructing the site, hiring and training employees in advance, and advertising and marketing the new store through pre-opening events to draw the flooring industry community together. Each new store is thoughtfully designed with store interiors that include interchangeable displays on wheels, racking to access products and stand-up visual displays to allow ease of shopping and an exterior highlighted by a large, bold Floor & Decor sign. The majority of our stores have design centers that showcase project ideas to further inspire our customers, and in all of our stores, we employ experienced designers to provide design consulting to our customers free of charge. We have rolled out Pro Zones, which are dedicated areas offering a variety of services to Pro customers, in a majority of our stores.
97
Our new store model targets a store size of 60,000-80,000 square feet, total initial net cash investment of approximately $4 million, targeting net sales on average of $10 million to $13 million and positive four-wall Adjusted EBITDA in the first year, pre-tax payback in two to three years and cash-on-cash returns of greater than 50% in the third year. On average, our stores opened after 2012 have exceeded this model. We believe the success of our stores across geographies and vintages supports the portability of Floor & Decor into a wide range of markets. The performance of our new stores is inherently uncertain and is subject to numerous factors that are outside of our control. As a result, we cannot assure you that our new stores will achieve our target results.
Connected Customer
Our website and our call center are important parts of our integrated connected customer strategy. We aim to elevate the customer experience through our website FloorandDecor.com. Growing our e-commerce sales provides us with additional opportunity to enhance our connected customer experience for our customers. Home renovation and remodeling projects typically require significant investments of time and money from our DIY customers, and they consequently plan their projects carefully and conduct extensive research online. FloorandDecor.com is an important tool for engaging them throughout this process, educating them on our product offerings and providing them with design ideas. Our Pro customers use the website to browse our broad product assortment, to continually educate themselves on new techniques and trends and to share our virtual catalogue and design ideas with their customers. In addition, sales associates at our call center are available to assist our customers with their projects and questions. We designed the website to be a reflection of our stores and to promote our wide selection of high quality products and low prices. To this end, we believe the website provides the same region-specific product selection that customers can expect in our stores, but also the opportunity to extend our assortment by offering the entire portfolio of products.
In addition to highlighting our broad product selection, we believe FloorandDecor.com offers a convenient opportunity for customers to purchase products online and pick them up in our stores. For fiscal 2016, approximately 90% of our e-commerce sales were picked up in-store. As we continue to grow, we believe connected customer will become an increasingly important part of our strategy.
Marketing and Advertising
We use a multi-platform approach to increasing Floor & Decor's brand awareness, while historically maintaining a low average advertising to net sales ratio of approximately 3%. We use traditional advertising media, combined with social media and online marketing, to share the Floor & Decor story with a growing audience. We take the same customized approach with our marketing as we do with our product selection; each region has a varied media mix based on local trends and what we believe will most efficiently drive sales. To further enhance our targeting efforts, our store managers have significant input into the store's marketing spend.
A key objective of our messaging is to make people aware of our stores, products and services. Based on internal research, we estimate the conversion rate from a customer visiting one of our stores to purchasing our products is 79%.
As part of our focus on local markets, our stores have events that promote Floor & Decor as a hub for the local home improvement community. We feature networking events for Pro customers, giving them a chance to meet our sales teams, interact with others in the home improvement industry and learn about our newest products. For DIY customers, we regularly offer how-to classes on product installation. We believe these events serve to raise the profile of the Floor & Decor stores in our communities while showcasing our tremendous selection of products and services.
98
We want our customers to have a great experience at their local Floor & Decor store. With our TV and radio commercials, print and outdoor ads, in-store flyers, online messaging and community events, we show our customers that we are a trusted resource with a vast selection, all at a low price.
Sourcing
Floor & Decor has a well-developed and geographically diverse supplier base. We source our industry leading merchandise assortment from over 180 suppliers in over 18 countries, and maintain good relationships with our vendors. No supplier accounts for more than 10% of our net sales. We continue to increase our sourcing from suppliers outside of the United States, and where appropriate, we are focused on bypassing agents, brokers, distributors and other middlemen in our supply chain in order to reduce costs and lead time. Over the past several years, we have established a Global Sourcing and Compliance Department to, among other things, develop and implement policies and procedures to address compliance with appropriate regulatory bodies, including compliance with the requirements of the Lacey Act, CARB and the EPA. In addition we utilize third -party consultants for audits, testing and surveillance to ensure product safety and compliance. Additionally, we have invested in technology and personnel to collaborate throughout the entire supply chain process. We believe that our direct sourcing model and the resulting relationships we have developed with our suppliers are distinct competitive advantages. The cost savings we achieve by directly sourcing our merchandise enable us to offer our customers low prices. Additionally, our close relationships with suppliers allow us to collaborate with them directly to develop and quickly introduce innovative and quality products that meet our customers' evolving tastes and preferences at low prices. We plan to continue increasing the percentage of merchandise that we directly source from suppliers.
Distribution and Order Fulfillment
We have invested significant resources to develop and enhance our distribution network. We have four distribution centers strategically located across the United States in port cities near Savannah, Georgia; Miami, Florida; Houston, Texas; and Los Angeles, California. Third-party brokers arrange the shipping of our international and domestic purchases to our distribution centers and stores and bill us for shipping costs according to the terms of the purchase agreements with our suppliers. We are typically able to transport inventory from our distribution centers to our stores in less than one week. This quick turnaround time enhances our ability to maintain project-ready quantities of the products stocked in our stores. To further strengthen our distribution capabilities, we have converted all of our distribution centers to Company-operated facilities. In conjunction with the change in responsibility, we have implemented a new warehouse management and transportation management system tailored to our unique needs across all four distribution centers. We believe the system will increase service levels, reduce shrinkage and damage, help us better manage our inventory and allow us to better implement our connected customer initiatives. We recently moved our West Coast distribution center from Carson, California to Moreno Valley, California. We are in the process of exiting the previously occupied 220,000 square foot leased distribution center located in Carson, California in the first quarter of 2017. We have signed a lease for a new 1.4 million square foot distribution center that is being constructed in Savannah, Georgia. We plan to relocate all the existing inventory from our currently leased 378,000 square foot distribution center located in Savannah, Georgia starting in the fourth quarter of 2017 and commencing in the early part of the first quarter of 2018. After this relocation occurs, we plan to cancel our lease in the current 378,000 square foot distribution center in Savannah, Georgia. Concurrent with this relocation, we plan to shut down our 322,000 square foot leased distribution center, in Miramar, Florida and consolidate this inventory in our new 1.4 million square foot leased distribution center in Savannah, Georgia. After this relocation occurs, we plan to exit our current 322,000 square foot leased distribution center in Miramar, Florida.
99
We believe that our current distribution network, along with these planned changes, is sufficient to support our growth over the next few years. However, we continue to seek opportunities to enhance our distribution capabilities and align them with our strategic growth initiatives, including distribution center capacity.
Management Information Systems
We believe that technology plays a crucial role in the continued growth and success of our business. We have sought to integrate technology into all facets of our business, including supply chain, merchandising, store operations, point-of-sale, e-commerce, finance, accounting and human resources. The integration of technology allows us to analyze the business in real time and react accordingly. Our sophisticated inventory management system is our primary tool for forecasting, placing orders and managing in-stock inventory. The data-driven platform includes sophisticated forecasting tools based on historical trends in sales, inventory levels and vendor lead times at the store and distribution center level by SKU, allowing us to support store managers in their regional merchandising efforts. We rely on the forecasting accuracy of our system to maintain the in-stock, project-ready quantities that our customers rely on. In addition, our employee training certifications are entirely electronic, allowing us to effectively track the competencies of our staff and manage talent across stores. We believe that our systems are sufficiently scalable to support the continued growth of the business.
Competition
The retail hard surface flooring market is highly fragmented and competitive. We face significant competition from large home improvement centers, national and regional specialty flooring chains and independent flooring retailers. Some of our competitors are organizations that are larger, are better capitalized, have existed longer, have product offerings that extend beyond hard surface flooring and related accessories, and have a more established market presence with substantially greater financial, marketing, personnel and other resources than we have. In addition, while the hard surface flooring category has a relatively low threat of new internet-only entrants due to the nature of the product, the growth opportunities presented by e-commerce could outweigh these challenges and result in increased competition in this portion of our connected customer strategy. Further, because the barriers to entry into the hard surface flooring industry are relatively low, manufacturers and suppliers of flooring and related products, including those whose products we currently sell, could enter the market and start directly competing with us.
We believe that the key competitive factors in the retail hard surface flooring industry include:
100
We believe that we compete favorably with respect to each of these factors by providing a highly diverse selection of products to our customers, at an attractive value, in appealing and convenient retail stores.
Our Structure
FDO Holdings, Inc. (which will be renamed Floor & Decor Holdings, Inc.) was incorporated as a Delaware corporation in October 2010 in connection with our Sponsors' acquisition of F&D in November 2010, which in turn converted from a Georgia corporation into a Delaware corporation in connection therewith.
The following chart illustrates our current corporate structure:
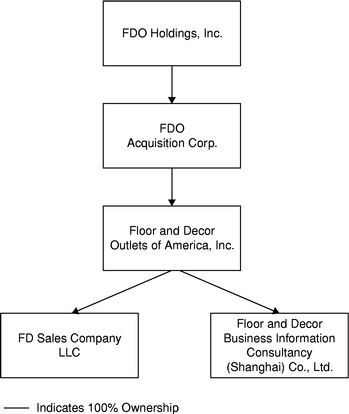
Employees
As of December 29, 2016, we had 4,391 employees, 2,881 of whom were full-time and none of whom were represented by a union. Of these employees, 3,877 work in our stores, 375 work in corporate, store support, infrastructure, e-commerce or similar functions, and 139 work in distribution centers. We believe that we have good relations with our employees.
101
Properties
We have 72 U.S. warehouse-format stores located in seventeen states, as shown in the chart below:
State
|
Number of Stores |
|||
|---|---|---|---|---|
Arizona |
4 | |||
California |
7 | |||
Colorado |
2 | |||
Florida |
15 | |||
Georgia |
7 | |||
Illinois |
6 | |||
Louisiana |
1 | |||
Maryland |
1 | |||
Nevada |
2 | |||
New Jersey |
2 | |||
North Carolina |
1 | |||
Ohio |
2 | |||
Pennsylvania |
2 | |||
Tennessee |
3 | |||
Texas |
14 | |||
Utah |
1 | |||
Virginia |
2 | |||
| | | | | |
Total: |
72 | |||
| | | | | |
| | | | | |
| | | | | |
We opened 12 new stores during fiscal 2016 and have opened three new stores since then. In addition to our warehouse-format stores, we operate one separate small 5,500 square foot design center located in New Orleans, Louisiana. Our headquarters, which we refer to as our store support center, is approximately 106,600 square feet and is located in Smyrna, Georgia. Additionally, we operate an approximately 37,000-square foot product review center in Smyrna, Georgia.
We lease our store support center, all of our stores and our distribution centers. Our leases generally have a term of ten to fifteen years, and generally have at least two renewal options for five years. Most of our leases provide for a minimum rent and typically include escalating rent increases. Our leases also generally require us to pay insurance, utilities, real estate taxes and repair and maintenance expenses.
Government Regulation
We are subject to extensive and varied federal, state and local laws and regulations, including those relating to employment, the environment, advertising, labeling, public health and safety, product safety, zoning and fire codes. We operate our business in accordance with standards and procedures designed to comply with applicable laws and regulations. Compliance with these laws and regulations has not historically had a material effect on our financial condition or operating results; however, the effect of compliance in the future cannot be predicted.
Our operations and properties are also subject to federal, state and local laws and regulations governing the environmental protection of natural resources and health and safety, including the use, storage, handling, generation, transportation, treatment, emission, release, discharge and disposal of hazardous materials, substances and wastes and relating to the investigation and clean-up of contaminated properties. Except to the extent of the capital expenditures related to our initiatives described below, compliance with these laws and regulations has not historically had a material effect
102
on our financial condition or operating results, but we cannot predict the effect of compliance in the future.
In particular, certain of our products are subject to laws and regulations relating to the importation, exportation, acquisition or sale of certain plants and plant products, including those illegally harvested (which is prohibited by the Lacey Act), and the emissions of hazardous materials (which in California is governed by regulations promulgated by CARB and federally by regulations promulgated by the EPA). We have established a Global Sourcing and Compliance Department to, among other things, address these requirements, and we work with third-party experts to assist us in designing and implementing compliance programs to address the requirements of the Lacey Act, CARB and the EPA. Further, we could incur material compliance costs or be subject to compliance liabilities or claims in the future, especially in the event new laws or regulations are adopted or there are changes in existing laws and regulations or in their interpretation.
Our suppliers are also subject to the laws and regulations of their home countries, including in particular laws regulating forestry and the environment. We also support social and environmental responsibility among our supplier community and endeavor to enter into vendor agreements with our suppliers that contain representations and warranties concerning environmental, labor and health and safety matters.
Insurance and Risk Management
We use a combination of insurance and self-insurance to provide for potential liability for workers' compensation, general liability, product liability, director and officers' liability, team member healthcare benefits, and other casualty and property risks. Changes in legal trends and interpretations, variability in inflation rates, changes in workers' compensation and general liability premiums and deductibles, changes in the nature and method of claims settlement, benefit level changes due to changes in applicable laws, insolvency of insurance carriers, and changes in discount rates could all affect ultimate settlements of claims. We evaluate our insurance requirements on an ongoing basis to ensure we maintain adequate levels of coverage.
Legal Proceedings
We are engaged in various legal actions, claims and proceedings arising in the ordinary course of business, including claims related to breach of contracts, products liabilities, intellectual property matters and employment related matters resulting from our business activities. As with most actions such as these, an estimation of any possible and/or ultimate liability cannot always be determined. Regardless of the outcome, litigation can have an adverse impact on us because of defense and settlement costs, diversion of management resources, and other factors.
Trademarks and other Intellectual Property
As of March 20, 2017, we have 50 registered marks and several pending trademark applications in the United States. We regard our intellectual property, including our over 50 proprietary brands, as having significant value, and our brand is an important factor in the marketing of our products. Accordingly, we have taken, and continue to take, appropriate steps to protect our intellectual property.
103
Executive Officers and Directors
The following table sets forth certain information regarding our executive officers and directors as of March 20, 2017:
Name
|
Age | Position | ||
|---|---|---|---|---|
Executive Officers |
||||
Thomas V. Taylor |
51 | Chief Executive Officer and a Director | ||
Trevor S. Lang |
46 | Executive Vice President and Chief Financial Officer | ||
Lisa G. Laube |
54 | Executive Vice President and Chief Merchandising Officer | ||
Brian K. Robbins |
59 | Executive Vice President—Supply Chain | ||
David V. Christopherson |
42 | Senior Vice President, Secretary and General Counsel | ||
Directors who are not officers |
||||
Norman H. Axelrod |
64 | Chairman of the Board | ||
George Vincent West |
62 | Vice Chairman of the Board | ||
Brad J. Brutocao |
43 | Director | ||
David B. Kaplan |
49 | Director | ||
Rachel H. Lee |
32 | Director | ||
John M. Roth |
58 | Director | ||
Peter M. Starrett |
69 | Director |
Executive Officers
Each of our executive officers serves at the direction of our board of directors and holds office until his or her successor is duly elected and qualified or until his or her earlier resignation or removal. There are no family relationships among any of our directors or executive officers.
Thomas V. Taylor, Jr., 51, has served as our Chief Executive Officer and a member of our board of directors since December 2012. Prior to joining us, Mr. Taylor began his career at age 16 in 1983 at a Miami Home Depot store. He worked his way up through various manager, district manager, vice president, president, and senior vice president roles to eventually serve as the Executive Vice President of Operations with responsibility for all 2,200 Home Depot stores and then the Executive Vice President of Merchandising and Marketing, again for all stores. After leaving Home Depot in 2006, for the next six years, Mr. Taylor was a Managing Director at Sun Capital Partners. During his tenure, he was a board member for over twenty portfolio companies in the United States and Europe. Mr. Taylor's significant experience as a board member and his expertise in the home improvement retail industry led to the conclusion that he should serve as a member of our board of directors.
Trevor S. Lang, 46, is our Executive Vice President and Chief Financial Officer. Mr. Lang joined the Company as Senior Vice President and Chief Financial Officer in 2011, and was promoted to Executive Vice President of Professional Services and Chief Financial Officer in October 2014 in connection with his assuming responsibility for leading our in-store Pro and Commercial businesses. From 2007 to 2011, he served as the Chief Financial Officer of Zumiez Inc. and also served as its Chief Administrative Officer beginning in April 2010. Previously, he had served as Vice President of Finance for Carter's, Inc. since 2003. At Carter's, Mr. Lang was responsible for the management of the corporate accounting and finance functions. From 1999 until joining Carter's in 2003, Mr. Lang served in a progressive series of Vice President roles in the finance area at Blockbuster Inc., culminating in his role as Vice President Operations Finance where he was responsible for accounting and reporting for over 5,000 company-owned and franchised stores. From 1994 until 1999, Mr. Lang worked in the audit division of Arthur Andersen reaching the level of audit manager. Mr. Lang is a 1993 graduate of Texas A&M University with a B.B.A. in Accounting. He is also a Certified Public Accountant.
104
Lisa G. Laube, 54, has served as our Executive Vice President and Chief Merchandising Officer since 2012. She is responsible for Merchandising, Marketing, Inventory and E-Commerce. From 2005 to 2011, Ms. Laube was President of Party City where she was responsible for Merchandising, Marketing and E-Commerce and prior to that she was the company's Chief Merchandising Officer. From 2002 to 2004, she was the Vice President of Merchandising for White Barn Candle Company, a division of Bath and Body Works. Prior to that, Ms. Laube worked from 1996 to 2002 at Linens 'n Things beginning as a Buyer and progressing to General Merchandising Manager. From 1988 to 1996, she was a Buyer at Macy's in the Textiles division. Ms. Laube began her career at Rich's department store in the Executive Training Program. She graduated from the Terry School of Business, University of Georgia in 1985 with a B.B.A. in Marketing.
Brian K. Robbins, 59, has served as our Executive Vice President of Supply Chain since 2013. Prior to joining us, Mr. Robbins was a senior supply chain or merchandising executive with three portfolio companies of Cerberus Capital Management since 2009. He had also held senior supply chain roles with GE and DuPont, and was a Merchandise Vice President with Home Depot. Early in his career, Mr. Robbins received his CPA certificate and held various accounting positions with Grant Thornton, Scripps Howard and PricewaterhouseCoopers. Mr. Robbins is a graduate of Miami University with a B.S. degree in Education, majoring in Industrial Management.
David V. Christopherson, 42, is our Senior Vice President, General Counsel and Secretary. He joined the Company as General Counsel and Secretary in 2013 and was promoted to Senior Vice President in February 2015. Mr. Christopherson was the Vice President, General Counsel and Secretary of Teavana Holdings, Inc. from 2011 to 2013 and the Deputy General Counsel of Swett & Crawford from 2007 to 2011. He was previously an attorney with the law firms King & Spalding and Sullivan & Cromwell. Mr. Christopherson received an A.B. in Political Science from Davidson College and a J.D. from Harvard Law School.
Board of Directors
Information pertaining to Mr. Taylor may be found in the section entitled "Management—Executive Officers."
Norman H. Axelrod, 64, has served as our Chairman since December 2011 and as a member of our board of directors since November 2010. Beginning in 1988, Mr. Axelrod served as Chief Executive Officer and a member of the board of directors of Linens 'n Things, Inc., a retailer of home textiles, housewares and decorative home accessories, was appointed as Chairman of its board of directors in 1997, and served in such capacities until its acquisition in February 2006. Mr. Axelrod also serves on the boards of directors of the parent entities of Smart & Final Stores, Inc., a warehouse-style food and supply retailer, Guitar Center, Inc., a musical instruments retailer, 99 Cents Only Stores LLC, a deep-discount retailer, Jaclyn, Inc., a handbags and apparel company, and The Neiman Marcus Group LLC, a luxury retailer. Mr. Axelrod has also previously served as the Chairman of the boards of directors of GNC Holdings, Inc., a specialty retailer of health and wellness products, National Bedding Company LLC, a mattress and bedding product manufacturer, and Simmons Company, a mattress and bedding product manufacturer, and as a member of the boards of directors of Reebok International Ltd., a leading worldwide designer and marketer of sports, fitness and casual footwear, apparel and equipment, and Maidenform Brands, Inc., an intimate apparel retailer. Mr. Axelrod has provided consulting services to certain Ares entities. Mr. Axelrod received a B.S. in Management and Marketing from Lehigh University and an M.B.A. from New York University. Mr. Axelrod's vast experience led to the conclusion that he should serve as a member of our board of directors.
George Vincent West, 62, has served on our board of directors since he founded us in 2000. He served as our Chief Executive Officer from 2000 to 2002, as co-Chief Executive Officer from 2008 to 2010 and as Chief Executive Officer from 2010 through 2012. Currently, Mr. West serves as the Vice
105
Chairman of our board of directors, a position that he has held since December 2012. Mr. West began his business career starting a successful retail glassware business in Atlanta. He was eventually recruited to work for his family building materials business, West Building Materials, which operated in five southeastern states, and eventually became its President. Mr. West also developed and sold a multistate billboard company and has developed several real estate projects across the state of Georgia, the most recent being Utana Bluffs, a boutique mountain home community in the north Georgia Mountains. Mr. West graduated from the Terry College of Business at the University of Georgia in 1977. Mr. West's experience and intimate knowledge of the Company led to the conclusion that he should serve as a member of our board of directors.
Brad J. Brutocao, 43, has served as a member of our board of directors since November 2010. Mr. Brutocao joined Freeman Spogli in 1997 and has been a Partner since 2008. Prior to joining Freeman Spogli, Mr. Brutocao worked at Morgan Stanley & Co., a financial services firm, in the Mergers and Acquisitions and Corporate Finance departments. Mr. Brutocao currently serves on the boards of directors of the parent entities of Arhaus LLC, a home furnishings retailer, Boot Barn, Inc., a retailer of western and work footwear and apparel, Plantation Products LLC, a supplier of lawn and garden consumables, Regent Holding, a supplier of home décor and accent products, and City Barbeque, a fast-casual restaurant concept. Mr. Brutocao received a B.A. in Business Economics from the University of California, Los Angeles. Mr. Brutocao's experience managing investments in, and serving on the boards of, companies operating in the retail and consumer industries led to the conclusion that he should serve as a member of our board of directors.
David B. Kaplan, 49, has served as a member of our board of directors since October 2010, including as Chairman from October 2010 to December 2011. Mr. Kaplan is a Co-Founder of Ares, and a Director and Partner of Ares Management GP LLC, Ares Management's general partner. He is a Partner of Ares Management, Co-Head of its Private Equity Group and a member of its Management Committee. He additionally serves on several of the Investment Committees for certain funds managed by the Private Equity Group. Mr. Kaplan joined Ares in 2003 from Shelter Capital Partners, LLC, where he was a Senior Principal from June 2000 to April 2003. From 1991 through 2000, Mr. Kaplan was affiliated with, and a Senior Partner of, Apollo Management, L.P. and its affiliates, during which time he completed multiple private equity investments from origination through exit. Prior to Apollo Management, L.P., Mr. Kaplan was a member of the Investment Banking Department at Donaldson, Lufkin & Jenrette Securities Corp., an investment banking and securities firm. Mr. Kaplan currently serves as Chairman of the board of directors of the parent entities of Neiman Marcus Group, Inc., a luxury retailer, and Smart & Final Stores, Inc., a warehouse-style food and supply retailer, and as a member of the boards of directors of ATD Corporation, a replacement tire distributor, 99 Cents Only Stores LLC, a deep-discount retailer, and the parent entity of Guitar Center, Inc., a musical instruments retailer. Mr. Kaplan's previous public company board of directors experience includes Maidenform Brands, Inc., an intimate apparel retailer, where he served as the company's Chairman, GNC Holdings, Inc., a specialty retailer of health and wellness products, Dominick's Supermarkets, Inc., a grocery store retailer, Stream Global Services, Inc., a business process outsourcing provider, Orchard Supply Hardware Stores Corporation, a home improvement retailer, and Allied Waste Industries Inc., a waste services company. Mr. Kaplan also serves on the board of directors of Cedars-Sinai Medical Center, is a Trustee of the Center for Early Education and serves on the President's Advisory Group of the University of Michigan. Mr. Kaplan graduated with High Distinction, Beta Gamma Sigma, from the University of Michigan, School of Business Administration with a B.B.A. concentrating in Finance. Mr. Kaplan's over 25 years of experience managing investments in, and serving on the boards of directors of, companies operating in various industries led to the conclusion that he should serve as a member of our board of directors.
Rachel H. Lee, 32, has served as a member of our board of directors since October 2015. Ms. Lee is a Principal in the Private Equity Group of Ares. Prior to joining Ares in 2008, Ms. Lee was
106
an investment banking generalist at J.P. Morgan, where she participated in the execution of a variety of transactions including leveraged buyouts, mergers and acquisitions, and debt and equity financings across various industries. Ms. Lee also serves on the board of directors of Farrow & Ball Ltd., a manufacturer of paints and wallpapers. She holds a B.S.B.A. from the University of Southern California Marshall School of Business in Corporate Finance and a B.S. from the University of Southern California Leventhal School of Accounting in Accounting. Ms. Lee's experience working with and serving as a director of various companies operating in various industries controlled by private equity sponsors led to the conclusion that she should serve as a member of our board of directors.
John M. Roth, 58, has served as a member of our board of directors since November 2010. Mr. Roth joined Freeman Spogli in 1988 and has been a Partner since 1993, he previously served as President and Chief Operating Officer and now serves as Chief Executive Officer. From 1984 to 1988, Mr. Roth was employed by Kidder, Peabody & Co. Incorporated in the Mergers and Acquisitions Group. Mr. Roth has served on the board of directors of hhgregg, Inc., an electronics and appliances retailer, since February 2005 and El Pollo Loco Holdings, Inc., a differentiated quick service restaurant concept, since December 2007. Mr. Roth received an M.B.A. and a bachelor's degree from the Wharton School of the University of Pennsylvania. With his extensive experience as a board member of numerous retail and consumer businesses and his experience and insights into strategic expansion opportunities, capital markets and capitalization strategies, Mr. Roth is well qualified to serve on our board of directors.
Peter M. Starrett, 69, has served as a member of our board of directors since November 2010. In 1998, Mr. Starrett founded Peter Starrett Associates, a retail advisory firm, and currently serves as its President. In connection with his activities at Peter Starrett Associates, Mr. Starrett also provides consulting services to certain Freeman Spogli affiliated entities. From 1990 to 1998, Mr. Starrett served as the President of Warner Bros. Studio Stores Worldwide, a specialty retailer. Previously, he was Chairman and Chief Executive Officer of The Children's Place, a specialty retailer. Prior to that, Mr. Starrett held senior executive positions at both Federated Department Stores and May Department Stores, each a department store retailer. Mr. Starrett is Chairman of the board of directors of Boot Barn, Inc., a specialty apparel and footwear retailer. From May to November of 2012, Mr. Starrett served as Boot Barn, Inc.'s interim Chief Executive Officer. In addition, he is a member of the board of directors of hhgregg, Inc., an electronics and appliances retailer, as well as several private companies. Previously, he was also the Chairman of the board of directors of Pacific Sunwear, Inc. Mr. Starrett received a B.S.B.A. from the University of Denver and an M.B.A. from Harvard Business School. Mr. Starrett's extensive experience as an officer and a director of both public and private companies in the retail industry led to the conclusion that he should serve as a member of our board of directors.
Board Composition
Our business and affairs are managed by our board of directors, which upon the closing of this offering will consist of 8 directors. The size of our board of directors may range from three to 12 members, the exact number of which will be set from time to time by our board of directors.
Pursuant to the terms of the Investor Rights Agreement, each Sponsor is entitled to nominate (a) five directors for election to our board of directors for so long as it holds 40% or more of our outstanding common stock, (b) three directors for election to our board of directors for so long as it holds 30% or more of our outstanding common stock, (c) two directors for election to our board of directors for so long as it holds 15% or more of our outstanding common stock and (d) one director for election to our board of directors for so long as it holds 5% or more of our outstanding common stock. In particular, Ares has nominated Messrs. Axelrod, Kaplan and West and Ms. Lee for election to our board of directors, and Freeman Spogli has nominated Messrs. Brutocao and Roth for election to our board of directors. Pursuant to the terms of the Investor Rights Agreement, each Sponsor will
107
agree to vote in favor of the other Sponsor's nominees and for the election of our then-current chief executive officer to our board of directors.
Upon the closing of this offering, our board of directors will be divided into three classes. The members of each class will serve for a staggered, three-year term. Upon the expiration of the term of a class of directors, directors in that class will be elected for three-year terms, subject to our Sponsors' rights to remove their respective nominees, at the annual meeting of stockholders in the year in which their term expires. There will be no cumulative voting at the election of directors. Consequently, at each annual meeting, the successors to the directors whose terms are then expiring will be decided by a majority of the votes cast at the meeting. The classes will be composed as follows:
Any additional directorships resulting from an increase in the number of directors will be distributed among the three classes so that, as nearly as possible, each class will consist of one-third of our directors. This classification of our board of directors may have the effect of delaying or preventing changes in control.
Pursuant to the terms of the Investor Rights Agreement, directors nominated by our Sponsors may be removed with or without cause by the affirmative vote of the Sponsor entitled to nominate such director. In all other cases and at any other time, directors may only be removed for cause by the affirmative vote of at least a majority of the voting power of our common stock.
Director Independence
Our board of directors has reviewed the independence of our directors and has considered whether any director has a material relationship with us that could compromise that director's ability to exercise independent judgment in carrying out that director's responsibilities. Our board of directors has affirmatively determined that each of Messrs. Axelrod, Brutocao, Kaplan, Roth, Starrett and Ms. Lee qualifies as an "independent director," as defined in the corporate governance rules of the New York Stock Exchange.
Controlled Company Exception
Upon the closing of this offering, we will be deemed a "controlled company" under the rules of the New York Stock Exchange, and we will qualify for, but do not intend to rely on, the "controlled company" exemption to the board of directors and committee composition requirements under the rules of the New York Stock Exchange. If we were to rely on this exemption, we would be exempt from the requirements that (1) our board of directors be comprised of a majority of independent directors, (2) we have a nominating and corporate governance committee composed entirely of independent directors, (3) our compensation committee be comprised solely of independent directors and (4) we conduct an annual performance evaluation of the nominating and corporate governance committee and the compensation committee. The "controlled company" exception does not modify the independence requirements for the audit committee, and we intend to comply with the requirements of the Sarbanes-Oxley Act and the rules of the New York Stock Exchange, which require that our audit committee be composed of at least three members and entirely of independent directors within one year from the date of this prospectus.
108
Since we do not intend to rely on the "controlled company" exemption under the rules of the New York Stock Exchange, the board of directors will take all actions necessary to comply with such rules, including appointing a majority of independent directors to the board and establishing certain committees composed entirely of independent directors within the time frames set forth under the rules of the New York Stock Exchange.
Board Leadership Structure
Our board of directors has no policy with respect to the separation of the offices of Chief Executive Officer and Chairman of the Board. It is the board of directors' view that rather than having a rigid policy, the board of directors, with the advice and assistance of the nominating and corporate governance committee, and upon consideration of all relevant factors and circumstances, will determine, as and when appropriate, whether the two offices should be separate.
Currently, our leadership structure separates the offices of Chief Executive Officer and Chairman of the Board with Mr. Taylor serving as our Chief Executive Officer and Mr. Axelrod as Chairman of the Board. We believe this is appropriate as it provides Mr. Taylor with the ability to focus on our day-to-day operations while Mr. Axelrod focuses on oversight of our board of directors.
Risk Oversight
Our board of directors plays an active role in overseeing management of our risks. Our board of directors regularly reviews information regarding our credit, compliance, liquidity and operations, as well as the risks associated with each. Our compensation committee is responsible for overseeing the management of risks relating to our executive compensation plans and arrangements and our audit committee is responsible for overseeing the management of financial, legal and regulatory risks and our enterprise risk management process generally. Upon the closing of this offering, our nominating and corporate governance committee will be responsible for managing risks associated with the independence of the board of directors. While each committee will be responsible for evaluating certain risks and overseeing the management of such risks, our full board of directors plans to keep itself regularly informed regarding such risks through committee reports and otherwise.
Board Committees
Our board of directors has the authority to appoint committees to perform certain management and administration functions. Our board of directors has the following standing committees: an audit committee, a compensation committee and, upon the closing of this offering, will have a nominating and corporate governance committee. The composition and responsibilities of each standing committee are described below. Members will serve on these committees until their resignation or until otherwise determined by the board of directors.
Audit Committee
Upon the closing of this offering, the audit committee of our board of directors (the "Audit Committee") will consist of Ms. Lee, Mr. Starrett and who will act as its chair. Our board of directors determined that qualifies as an "audit committee financial expert" as defined in Item 407(d)(5)(ii) of Regulation S-K, has the attributes set forth in such section and is financially literate, as required by the rules of the New York Stock Exchange. In addition, our board of directors has determined that Mr. Starrett is independent as independence is defined under the rules of the New York Stock Exchange and Rule 10A-3(b)(1) under the Securities Exchange Act of 1934, as amended (the "Exchange Act"). Within one year of the date of this prospectus, we expect to have a fully independent audit committee in accordance with the rules of the New York Stock Exchange and Rule 10A-3(b)(1) under the Exchange Act.
109
The principal duties and responsibilities of our Audit Committee are as follows:
The Audit Committee will have the power to investigate any matter brought to its attention within the scope of its duties. It will also have the authority to retain counsel and advisors to fulfill its responsibilities and duties.
Compensation Committee
Upon the closing of this offering, the compensation committee of our board of directors (the "Compensation Committee") will consist of Mr. Brutocao, Ms. Lee and Mr. Axelrod, who will act as its chair.
The principal duties and responsibilities of our Compensation Committee are as follows:
Nominating and Corporate Governance Committee
Upon the closing of this offering, the nominating and corporate governance committee of our board of directors will consist of and , who will act as its chair.
The principal duties and responsibilities of the nominating and corporate governance committee will be as follows:
Real Estate Committee
Upon the closing of this offering, the real estate committee of our board of directors (the "Real Estate Committee") will consist of Mr. Brutocao, Mr. Starrett, Ms. Lee and Mr. Axelrod, who will act as its chair.
The principal duties and responsibilities of our Real Estate Committee are as follows:
110
Code of Conduct and Ethics
Our board of directors will adopt a code of conduct and ethics that applies to all of our employees, including those officers responsible for financial reporting. The code of conduct and ethics will be available on our website at www.FloorandDecor.com. We intend to disclose any amendments to the code, or any waivers of its requirements, on our website to the extent required by applicable SEC rules or the rules of the New York Stock Exchange. The inclusion of our website address in this prospectus does not include or incorporate by reference the information on or accessible through our website into this prospectus.
Compensation Committee Interlocks and Insider Participation
None of our executive officers currently serves, or in the past year has served, as a member of the board or compensation committee of any entity that has one or more executive officers serving on our board or compensation committee.
111
EXECUTIVE AND DIRECTOR COMPENSATION
Introduction
In this Compensation Discussion and Analysis, we address our philosophy, programs and processes related to the compensation paid or awarded for fiscal 2016 to our named executive officers listed in the Summary Compensation Table for Fiscal 2016 that follows this discussion.
Our named executive officers ("NEOs") for fiscal 2016, which consist of our principal executive officer, our principal financial officer and our three other most highly compensated executive officers for fiscal 2016, are:
Fiscal 2016 Compensation
Compensation Philosophy and Objectives
Our Compensation Committee worked with Korn Ferry Hay Group ("Hay Group"), our independent compensation consultant, to develop and formalize our fiscal 2016 compensation philosophy and to implement compensation arrangements that reflect this philosophy. Our compensation philosophy reflects the following general principles:
Determination of Compensation
Prior to this offering, we were privately held, and the Compensation Committee reviewed and recommended the compensation of our NEOs. Following this offering, the Compensation Committee will continue to review and recommend the compensation of our NEOs and will regularly report its compensation decisions and recommendations to our board of directors.
In addition, Hay Group had been retained by us to provide advice on compensation for a private company, with such advice being utilized by the Compensation Committee to assist in developing our approach to executive officer and director compensation. In addition to advising our Compensation Committee, Hay Group performs other compensation consulting services for us.
112
Following the IPO, the Compensation Committee expects to retain Hay Group as its compensation consultant to provide advice on compensation for a public company.
In making executive compensation determinations for fiscal 2016, we relied on the significant experience of our directors in establishing compensation across many companies in multiple industries, as well as the input of our Chief Executive Officer, who has many years of experience in our industry. As a private company, our Compensation Committee analyzed market data for executive compensation focusing on retail companies with $250 million to $1.9 billion in annual revenue. The Compensation Committee reviewed compensation data from the public filings for the following companies:
| Big 5 Sporting Goods Conn's The Container Store Ethan Allen Interiors Flexsteel Industries Haverty Furniture Hibbett Sports |
Kirkland's Lumber Liquidators Mattress Firm Restoration Hardware Select Comfort Sportsman's Warehouse Tile Shop |
While the Compensation Committee considered this data from time to time to generally inform decisions relating to NEO compensation, it did not seek to benchmark our NEO compensation to any particular level. Following this offering, the Compensation Committee expects to periodically evaluate competitive market data to include the most suitable peer group as well as other market data deemed relevant. The Compensation Committee will review our NEO compensation against an appropriate peer group on a more formal basis and will also consider other relevant market data to ensure that our named executive officer compensation is competitive and sufficient to recruit and retain our NEOs.
The Compensation Committee expects to periodically review and update this peer group and to utilize Hay Group for benchmarking and peer group analysis in determining and developing compensation packages for our NEOs.
Elements of Our Executive Compensation Program
For fiscal 2016, our executive compensation program consisted of the following elements:
We do not have formal policies relating to the allocation of total compensation among the various elements of our compensation program. We generally allocate compensation between short-term and long-term components and between cash and equity in order to maximize executive performance and retention. Long-term compensation and equity awards comprise an increasingly larger proportion of total compensation of our senior executives as position level increases based on our belief that these at-risk elements of compensation more closely align management's interests with our financial performance and with our employees' interests.
Base Salary. Base salary is a visible and stable foundation of our compensation program. The base salaries of our NEOs are intended to reflect the position, duties and responsibilities of each executive and the market for base salaries of similarly situated executives at other companies of similar size and in similar industries. On a prospective basis, we will continue to evaluate the mix of base
113
salary, short-term incentive compensation and long-term incentive compensation to appropriately align the interests of our NEOs with those of our stockholders. As of the end of fiscal 2016, Mr. Taylor received a base salary at an annual rate of $700,000, Ms. Laube received a base salary at an annual rate of $490,000, Mr. Lang received a base salary at an annual rate of $410,000, Mr. Robbins received a base salary at an annual rate of $351,527, and Mr. Christopherson received a base salary at an annual rate of $309,000. These amounts reflect merit-based salary increases approved by the Compensation Committee in February 2016 of 3% for Ms. Laube, 2.5% for Mr. Lang, 5% for Mr. Robbins and 3% for Mr. Christopherson. Mr. Taylor's base salary did not change in fiscal 2016.
In February 2017, the Compenstion Committee approved base salary increases for Messrs Taylor, Lang, Robbins and Christopherson. During fiscal year 2017, the NEOs will receive the following base salaries: Mr. Taylor, $850,000 (an approximately 21.5% increase over his fiscal year 2016 base salary), Mr. Lang, $422,300 (a 3% increase over his fiscal year 2016 base salary), Mr. Robbins, $380,315 (an approximately 2.5% increase over his fiscal year 2016 base salary) and Mr. Christopherson, $321,260 (a 4% increase over his fiscal year 2016 base salary). Ms. Laube's base salary remained unchanged from fiscal year 2016.
Discretionary Bonus. On February 24, 2016, the Compensation Committee approved a discretionary bonus of $200,000 to Mr. Taylor to recognize his contribution to our exceptional performance in fiscal 2015.
Annual Cash Incentive Bonuses. Our NEOs are eligible to receive annual cash incentive bonuses. We consider annual cash incentive bonuses to be "at-risk" compensation. As "at-risk" compensation, we increase the size of the target bonus, as a percentage of base compensation, proportionate to each executive officer's position and responsibilities. The annual incentive bonuses are intended to reward our senior executives for achieving a target operating income objective established by the Compensation Committee at the beginning of the year. For fiscal 2016, Mr. Taylor was eligible to receive a bonus with a target amount equal to 100% of his base salary. For fiscal 2016, Ms. Laube and Messrs. Lang, Robbins and Christopherson were each eligible to receive a bonus with a target amount equal to 50% of his or her base salary.
In fiscal 2016, our target operating income as calculated with respect to the annual incentive bonuses was $64.6 million. Our actual and Adjusted operating income as calculated with respect to such annual cash incentive bonuses, or our Adjusted operating income, was $81.0 million, which was 125% of the target and resulted in a payout percentage of 201.4%. We define adjusted operating income as our operating income adjusted to eliminate the impact of certain items that we do not consider indicative of our core operating performance, which includes (a) provisions for legal settlement and other legal fees and expenses, (b) costs associated with the relocation of certain stores and distribution centers and (c) certain business and strategic consulting fees. In 2016, the majority of such adjustments was a credit for the cost to settle a putative class action lawsuit. See Note 6 to our consolidated financial statements for the year ended December 29, 2016. Accordingly, the NEOs received the following annual incentive bonuses:
Name
|
Target Annual Incentive Bonus |
Actual Annual Incentive Bonus |
Actual Payout Percentage |
|||||||
|---|---|---|---|---|---|---|---|---|---|---|
Thomas V. Taylor |
$ | 700,000 | $ | 1,410,122 | 201.4 | % | ||||
Trevor S. Lang |
$ | 204,038 | $ | 411,027 | 201.4 | % | ||||
Lisa G. Laube |
$ | 243,558 | $ | 490,637 | 201.4 | % | ||||
Brian Robbins |
$ | 174,152 | $ | 350,822 | 201.4 | % | ||||
David V. Christopherson |
$ | 153,635 | $ | 309,491 | 201.4 | % | ||||
In February 2017, the Compensation Committee adopted the 2017 Annual Performance Bonus Program (the "2017 Bonus Program"), pursuant to which executive officers, including the NEOs, will
114
be eligible to earn annual cash incentive bonuses based upon our achievement of operating income for the 2017 fiscal year. For payouts at target, our operating income must be $100.3 million, with greater payouts possible in the event we exceed our target operating income objective. Under the 2017 Bonus Program, our operating income must be at least $81.1 million in order for any payouts to be made. Mr. Taylor is eligible to receive a bonus with a target amount equal to 100% of his base salary. Ms. Laube and Messrs. Lang, Robbins and Christopherson are each eligible to receive a bonus with a target amount equal to 60%, 60%, 55% and 50% of their respective base salaries.
Stock Option Awards. We generally grant stock options to our NEOs in connection with their hiring as a way of aligning our interests with those of our employees. Stock options generally become exercisable in equal annual installments of 20% each, on each of the first five anniversaries of their effective date as long as the NEO is continuously employed by us on each vesting date. For Mr. Taylor, certain stock options become exercisable in annual installments of 25% each on each of the first four anniversaries of their grant date so long as Mr. Taylor remains continuously employed by us on each vesting date. On September 30, 2016, in connection with a non-recurring extraordinary dividend, we adjusted the exercise price of certain outstanding stock options and made cash payments to certain stock option holders in accordance with the terms of the 2011 Plan to account for such dividend, including stock options held by the NEOs, in order to prevent substantial dilution or enlargement of the rights of such option holders. Certain option holders, including the NEOs, will, in the event of a termination of employment prior to March 31, 2018, be required to repay dividend payments received in respect of stock options that were unvested as of September 30, 2016 and that remain unvested as of the date of termination. There was no incremental change to the fair value of the options in connection with the adjustment of the exercise price. On September 30, 2016, in connection with extraordinary individual and Company performance, we granted Messrs. Taylor, Lang, Robbins and Christopherson and Ms. Laube 834, 264, 168, 122 and 292 stock options, respectively.
401(k) Plan. All full-time employees are eligible to participate in our 401(k) plan after 6 months of service and are eligible to receive matching contributions from us after one year of service. We match employee contributions in cash at a rate of 30% of the first 5% of base compensation that an employee contributes, with graded vesting over a six year period. Our NEOs are also eligible for our matches, subject to regulatory limits on contributions to 401(k) plans.
Employment Agreements. The following is a summary of the employment agreements that we have entered into with our NEOs. The summary below does not contain complete descriptions of all provisions of the employment agreements of our NEOs and is qualified in its entirety by reference to such employment agreements, copies of which will be filed as exhibits to the registration statement of which this prospectus forms a part. See "Where You Can Find More Information."
Thomas V. Taylor—Chief Executive Officer
We entered into an amended and restated employment agreement with Mr. Taylor on July 29, 2015 pursuant to which Mr. Taylor agreed to continue to serve as our Chief Executive Officer. Mr. Taylor's employment agreement has a term of three years, after which it will automatically renew each year for successive one-year terms unless either party provides written notice of non-renewal or his employment is otherwise terminated, in each case pursuant to the terms of the employment agreement.
If we terminate Mr. Taylor's employment without Cause or do not renew it or if Mr. Taylor resigns for Good Reason, he is entitled to receive (i) any accrued and unpaid base salary and benefits and payments pursuant to the terms of any benefit plan (collectively, the "Accrued Benefits"), and (ii) subject to Mr. Taylor executing a valid release of claims, severance pay equal to (w) two times Mr. Taylor's annual base salary, payable over 24 months; (x) any unpaid annual incentive bonus with respect to the most recently completed fiscal year if the bonus is unpaid on the date of termination;
115
(y) a pro-rated portion of the average annual incentive bonus that Mr. Taylor earned over the two completed fiscal years prior to his date of termination; and (z) an amount equal to our portion of Mr. Taylor's health care premiums for 24 months following his date of termination. In addition, any vested stock options held by Mr. Taylor at the time of his termination of employment without Cause or for Good Reason will remain exercisable for a period of 90 days following the date of such termination.
We generally may terminate Mr. Taylor's employment for "Cause" immediately upon written notice of any of the following reasons: (i) his commission of, or being indicted for a felony, or his commission of a misdemeanor where imprisonment may be imposed (other than a traffic-related offense); (ii) any act of material misconduct or gross negligence in the performance of his duties or any act of moral turpitude; (iii) any act of theft, fraud or material dishonesty; (iv) his willful failure to perform any reasonable duties assigned by the board of directors, or his refusal to follow the directives of the board of directors that is not cured within 30 days; (v) any material breach of an agreement with us that is not cured within ten days; or (vi) his unlawful appropriation of a material corporate opportunity.
Mr. Taylor generally may terminate his employment for "Good Reason" in connection with any of the following without his consent: (i) a material diminution of his authority, duties or responsibilities; (ii) a material diminution of his base salary; (iii) a relocation of his office to a location that is more than 50 miles from the Atlanta, Georgia metropolitan area; or (iv) any material breach of Mr. Taylor's employment agreement by us that is not cured within 60 days.
In the event of Mr. Taylor's death or disability, Mr. Taylor or his personal representatives or heirs will receive (i) his Accrued Benefits, (ii) his base salary for 12 months, (iii) any unpaid annual incentive bonus with respect to the most recently completed fiscal year if the bonus is unpaid on the date of termination, and (iv) a pro-rated portion of the annual incentive bonus that Mr. Taylor would have earned if he had remained employed, payable at the time bonuses are paid to employees generally. Additionally Mr. Taylor's vested options will be exercisable for 12 months after his termination due to death or disability.
In the event that Mr. Taylor's employment is terminated by us without Cause or by Mr. Taylor for Good Reason within one year following a Change in Control (as defined in his amended and restated employment agreement), Mr. Taylor will be entitled to receive (i) the Accrued Benefits, and (ii) subject to Mr. Taylor executing a valid release of claims, severance pay equal to (v) two times Mr. Taylor's annual base salary; (w) any unpaid annual incentive bonus with respect to the most recently completed fiscal year if the bonus is unpaid on the date of termination; (x) a pro-rated portion of the average annual incentive bonus that Mr. Taylor earned over the two completed fiscal years prior to his date of termination; (y) an amount equal to our portion of Mr. Taylor's health care premiums for 24 months following his date of termination and (z) an amount equal to two times Mr. Taylor's target annual incentive bonus.
Trevor S. Lang—Executive Vice President and Chief Financial Officer
We entered into an amended and restated employment agreement with Mr. Lang on July 29, 2015 pursuant to which Mr. Lang agreed to continue to serve as our Executive Vice President and Chief Financial Officer. Mr. Lang's employment agreement had an initial term of one year, but automatically renewed on July 29, 2016 and will continue to automatically renew each year for successive one-year terms unless either party provides written notice of non-renewal or his employment is otherwise terminated, in each case pursuant to the terms of the employment agreement.
If we terminate Mr. Lang's employment without Cause or do not renew it or if Mr. Lang resigns for Good Reason, he is entitled to receive (i) any Accrued Benefits, and (ii) subject to Mr. Lang executing a valid release of claims, severance pay equal to Mr. Lang's annual base salary, payable over 12 months. In addition, any vested stock options held by Mr. Lang at the time of his
116
termination of employment without Cause or for Good Reason remain exercisable for a period of 90 days following the date of such termination.
We may terminate Mr. Lang's employment for "Cause" immediately upon written notice of any of the following reasons: (i) his (x) commission of, or being indicted for a felony, or (y) commission of a misdemeanor where imprisonment may be imposed (other than a traffic-related offense); (ii) any act of material misconduct or gross negligence in the performance of his duties or any act of moral turpitude; (iii) any act of theft, fraud or material dishonesty; (iv) his willful failure to perform any reasonable duties assigned by the Chief Executive Officer, or his refusal to follow the directives of the Chief Executive Officer that is not cured within 30 days; (v) any material breach of an agreement with us that is not cured within ten days; or (vi) his unlawful appropriation of a material corporate opportunity.
Mr. Lang generally may terminate his employment for "Good Reason" in connection with any of the following without his consent: (i) a material diminution of his authority, duties or responsibilities; (ii) a material diminution of his base salary; (iii) a relocation of his office to a location that is more than 50 miles from the Atlanta, Georgia metropolitan area; or (iv) any material breach of Mr. Lang's employment agreement by us, in each case that is not cured within 60 days.
Lisa G. Laube—Executive Vice President and Chief Merchandising Officer
We entered into an amended and restated employment agreement with Ms. Laube on July 29, 2015 pursuant to which Ms. Laube agreed to continue to serve as our Executive Vice President and Chief Merchandising Officer. Ms. Laube's employment agreement had an initial term of one year, but automatically renewed on July 29, 2016 and will continue to automatically renew each year for successive one-year terms unless either party provides written notice of non-renewal or her employment is otherwise terminated, in each case pursuant to the terms of the employment agreement.
If we terminate Ms. Laube's employment without Cause or do not renew it or if Ms. Laube resigns for Good Reason, she is entitled to receive (i) any Accrued Benefits, and (ii) subject to Ms. Laube executing a valid release of claims, severance pay equal to Ms. Laube's annual base salary, payable over 12 months. In addition, any vested stock options held by Ms. Laube at the time of her termination of employment without Cause or for Good Reason remain exercisable for a period of 90 days following the date of such termination.
We generally may terminate Ms. Laube's employment for "Cause" immediately upon written notice of any of the following reasons: (i) her (x) commission of, or being indicted for a felony, or (y) commission of a misdemeanor where imprisonment may be imposed (other than a traffic-related offense); (ii) any act of material misconduct or gross negligence in the performance of her duties or any act of moral turpitude; (iii) any act of theft, fraud or material dishonesty; (iv) her willful failure to perform any reasonable duties assigned by the Chief Executive Officer, or her refusal to follow the directives of the Chief Executive Officer that is not cured within 30 days; (v) any material breach of an agreement with us that is not cured within ten days; or (vi) her unlawful appropriation of a material corporate opportunity.
Ms. Laube generally may terminate her employment for "Good Reason" in connection with any of the following without her consent: (i) a material diminution of her authority, duties or responsibilities; (ii) a material diminution of her base salary; (iii) a relocation of her office to a location that is more than 50 miles from the Atlanta, Georgia metropolitan area; or (iv) any material breach of Ms. Laube's employment agreement by us, in each case that is not cured within 60 days.
117
Brian Robbins—Executive Vice President—Supply Chain
We entered into an employment agreement with Mr. Robbins on July 29, 2015 pursuant to which Mr. Robbins agreed to serve as our Executive Vice President—Supply Chain. Mr. Robbins's employment agreement had an initial term of one year, but automatically renewed on July 29, 2016 and will continue to automatically renew each year for successive one-year terms unless either party provides written notice of non-renewal or his employment is otherwise terminated, in each case pursuant to the terms of the employment agreement.
If we terminate Mr. Robbins's employment without Cause or do not renew it or if Mr. Robbins resigns for Good Reason, he is entitled to receive (i) any Accrued Benefits, and (ii) subject to Mr. Robbins executing a valid release of claims, severance pay equal to Mr. Robbins's annual base salary, payable over 12 months. In addition, any vested stock options held by Mr. Robbins at the time of his termination of employment without Cause or for Good Reason remain exercisable for a period of 90 days following the date of such termination.
We may terminate Mr. Robbins's employment for "Cause" immediately upon written notice of any of the following reasons: (i) his (x) commission of, or being indicted for a felony, or (y) commission of a misdemeanor where imprisonment may be imposed (other than a traffic-related offense); (ii) any act of material misconduct or gross negligence in the performance of his duties or any act of moral turpitude; (iii) any act of theft, fraud or material dishonesty; (iv) his willful failure to perform any reasonable duties assigned by the Chief Executive Officer, or his refusal to follow the directives of the Chief Executive Officer that is not cured within 30 days; (v) any material breach of an agreement with us that is not cured within ten days; or (vi) his unlawful appropriation of a material corporate opportunity.
Mr. Robbins generally may terminate his employment for "Good Reason" in connection with any of the following without his consent: (i) a material diminution of his authority, duties or responsibilities; (ii) a material diminution of her base salary; (iii) a relocation of his office to a location that is more than 50 miles from the Atlanta, Georgia metropolitan area; or (iv) any material breach of Mr. Robbins's employment agreement by us, in each case that is not cured within 60 days.
David V. Christopherson—Senior Vice President and General Counsel
We entered into an amended and restated employment agreement with Mr. Christopherson on July 29, 2015 pursuant to which Mr. Christopherson agreed to continue to serve as our Senior Vice President and General Counsel. Mr. Christopherson's employment agreement had an initial term of one year, but automatically renewed on July 29, 2016 and will continue to automatically renew each year for successive one-year terms unless either party provides written notice of non-renewal or his employment is otherwise terminated, in each case pursuant to the terms of the employment agreement.
If we terminate Mr. Christopherson's employment without Cause or do not renew it or if Mr. Christopherson resigns for Good Reason, he is entitled to receive (i) any Accrued Benefits, and (ii) subject to Mr. Christopherson executing a valid release of claims, severance pay equal to Mr. Christopherson's annual base salary, payable over 12 months. In addition, any vested stock options held by Mr. Christopherson at the time of his termination of employment without Cause or for Good Reason remain exercisable for a period of 90 days following the date of such termination.
We may terminate Mr. Christopherson's employment for "Cause" immediately upon written notice of any of the following reasons: (i) his (x) commission of, or being indicted for a felony, or (y) commission of a misdemeanor where imprisonment may be imposed (other than a traffic-related offense); (ii) any act of material misconduct or gross negligence in the performance of his duties or any act of moral turpitude; (iii) any act of theft, fraud or material dishonesty; (iv) his willful failure to perform any reasonable duties assigned by the Chief Financial Officer or Chief Executive Officer, or
118
his refusal to follow the directives of the Chief Executive Officer that is not cured within 30 days; (v) any material breach of an agreement with us that is not cured within ten days; or (vi) his unlawful appropriation of a material corporate opportunity.
Mr. Christopherson generally may terminate his employment for "Good Reason" in connection with any of the following without his consent: (i) a material diminution of his authority, duties or responsibilities; (ii) a material diminution of his base salary; (iii) a relocation of his office to a location that is more than 50 miles from the Atlanta, Georgia metropolitan area; or (iv) any material breach of Mr. Christopherson's employment agreement by us, in each case that is not cured within 60 days.
Restrictive Covenants
Each of the NEOs are subject to certain non-compete and non-solicitation restrictions while employed and for one year after termination of employment (or, in the case of Mr. Taylor, for three years after termination of employment). In addition, each NEO is subject to confidentiality and non-disparagement restrictions.
Tax Considerations
As a general matter, our board of directors and the Compensation Committee review and consider the various tax and accounting implications of compensation programs we utilize.
Section 162(m) ("Section 162(m)") of the Internal Revenue Code of 1986, as amended (the "Code") generally disallows public companies a tax deduction for compensation in excess of $1,000,000 paid to their chief executive officers and the three other most highly compensated executive officers (excluding the chief financial officer) unless certain performance and other requirements are met. Our intent generally is to design and administer executive compensation programs in a manner that will preserve the deductibility of compensation paid to our named executive officers, and we believe that a substantial portion of our current executive compensation program (including the stock options and other awards that may be granted to our named executive officers as described above) satisfies the requirements for exemption from the $1,000,000 deduction limitation. We intend to comply with applicable laws in order to rely on the transition rules under Section 162(m) for newly public companies. To the extent the transition rules under Section 162(m) apply to us, the $1,000,000 deduction limitation would not apply. However, we reserve the right to design programs that recognize a full range of performance criteria important to our success, even where the compensation paid under such programs may not be deductible.
Hedging and Pledging Policy
Our insider trading policy expressly prohibits transactions involving hedging or pledging of shares of our common stock by Covered Persons (defined as our and our subsidiaries' officers, directors and employees, as well as their immediate families and members of their households).
Compensation Risk Assessment
Our Compensation Committee, Management and Hay Group have conducted risk assessments of our compensation plans and practices, and our Compensation Committee and management have concluded that our compensation programs do not create risks that are reasonably likely to have a material adverse effect on the Company.
119
Role of the Compensation Committee in Executive Compensation
As described above, during fiscal 2016, our Compensation Committee made all decisions regarding the compensation of our NEOs. It is the Compensation Committee's responsibility to:
The Compensation Committee considered and approved the executive salary and bonus potential increases. In addition, as described above, the Compensation Committee has directly engaged Hay Group to assist in its review of compensation for our executive officers.
Role of Executive Officers in Determining Compensation for Our Executive Officers
Our Compensation Committee made all decisions regarding the compensation of our executive officers, after considering recommendations by Mr. Taylor (other than with respect to his own compensation). Our human resources department supports the Compensation Committee's work, and in some cases acts under delegated authority to administer compensation programs.
Compensation Committee Interlocks and Insider Participation
In fiscal 2016, none of our executive officers served as a director or member of the compensation committee of another entity whose executive officers served on our board of directors or the Compensation Committee.
120
COMPENSATION OF OUR NAMED EXECUTIVE OFFICERS
Summary Compensation Table for Fiscal 2016
The following table contains information about the compensation paid to or earned by each of our NEOs during fiscal 2016.
Name and Principal Position
|
Fiscal Year |
Salary($) | Bonus ($) | Option awards ($)(1) |
Non-equity incentive plan compensation ($) |
Change in pension value and nonqualified deferred compensation earnings ($) |
All other compensation ($)(2)(3) |
Total($) | |||||||||||||||||
|---|---|---|---|---|---|---|---|---|---|---|---|---|---|---|---|---|---|---|---|---|---|---|---|---|---|
Thomas V. Taylor—Chief Executive Officer |
2016 | 700,000 | — | 1,096,026 | 1,410,122 | — | 3,906,220 | 7,112,368 | |||||||||||||||||
Trevor S. Lang—Executive Vice President and Chief Financial Officer |
2016 | 408,077 | — | 346,944 | 411,027 | — | 1,536,308 | 2,702,356 | |||||||||||||||||
Lisa G. Laube—Executive Vice President and Chief Merchandising Officer |
2016 | 487,115 | — | 383,741 | 490,637 | — | 1,798,881 | 3,160,374 | |||||||||||||||||
Brian K. Robbins—Executive Vice President Supply Chain |
2016 | 348,303 | — | 220,782 | 350,822 | — | 285,203 | 1,205,110 | |||||||||||||||||
David V. Christopherson—Senior Vice President, Secretary and General Counsel |
2016 | 307,269 | — | 160,330 | 309,491 | — | 180,938 | 958,028 | |||||||||||||||||
121
Grants of Plan-Based Equity Awards Table
The following table contains information about each grant of an award made to our NEOs under any incentive plan in fiscal 2016:
| |
|
|
|
|
All Other Option Awards: Number of Securities Underlying Options (#) |
|
|
|||||||||||||
|---|---|---|---|---|---|---|---|---|---|---|---|---|---|---|---|---|---|---|---|---|
| |
|
Estimated Possible Payouts Under Non-Equity Incentive Plan Awards(1) |
|
Grant Date Fair Value of Option Awards ($)(3) |
||||||||||||||||
| |
|
Exercise or Base Price of Option Awards ($/share)(2) |
||||||||||||||||||
| |
Grant Date or Performance Period |
|||||||||||||||||||
Name
|
Threshold ($) | Target ($) | Maximum ($) | |||||||||||||||||
Thomas V. Taylor |
9/30/16 | N/A | 700,000 | N/A | 834 | 3,214.00 | 1,096,026 | |||||||||||||
Trevor S. Lang |
9/30/16 | N/A | 204,999 | N/A | 264 | 3,214.00 | 346,944 | |||||||||||||
Lisa G. Laube |
9/30/16 | N/A | 244,999 | N/A | 292 | 3,214.00 | 383,741 | |||||||||||||
Brian K. Robbins |
9/30/16 | N/A | 175,763 | N/A | 168 | 3,214.00 | 220,782 | |||||||||||||
David V. Christopherson |
9/30/16 | N/A | 154,500 | N/A | 122 | 3,214.00 | 160,330 | |||||||||||||
Outstanding Equity Awards at Fiscal Year-End 2016
Option numbers and option exercise prices in this section do not give effect to the for one stock split of our common stock to be effected prior to the consummation of this offering.
122
The following table contains information about stock options that have not been exercised and were outstanding as of the last day of fiscal 2016 for each of our NEOs.
| |
Option Awards | ||||||||||
|---|---|---|---|---|---|---|---|---|---|---|---|
Name
|
Number of Securities Underlying Unexercised Options (#) Exercisable |
Number of Securities Underlying Unexercised Options (#) Unexercisable |
Option Exercise Price ($) |
Option Expiration Date |
|||||||
Thomas V. Taylor(1) |
2,502 | — | 1,012.00 | December 13, 2022 | |||||||
|
2,501 | — | 1,558.00 | December 13, 2022 | |||||||
|
— | 834 | 3,214.00 | September 30, 2026 | |||||||
Trevor S. Lang(2) |
892 | — | 916.00 | July 11, 2021 | |||||||
|
1,072 | — | 1,391.00 | July 11, 2021 | |||||||
|
— | 264 | 3,214.00 | September 30, 2026 | |||||||
Lisa G. Laube(3) |
920 | 230 | 916.00 | February 23, 2022 | |||||||
|
920 | 230 | 1,391.00 | February 23, 2022 | |||||||
|
— | 292 | 3,214.00 | September 30, 2026 | |||||||
Brian K. Robbins(4) |
— | 45 | 1,219.39 | September 13, 2023 | |||||||
|
135 | 45 | 2,000.00 | September 13, 2023 | |||||||
|
— | 15 | 2,219.39 | September 13, 2023 | |||||||
|
45 | 15 | 3,000.00 | September 13, 2023 | |||||||
|
— | 80 | 1,692.06 | May 20, 2024 | |||||||
|
80 | 40 | 2,472.67 | May 20, 2024 | |||||||
|
— | 168 | 3,214.00 | September 30, 2026 | |||||||
David V. Christopherson(5) |
— | 30 | 1,219.39 | September 13, 2023 | |||||||
|
65 | 30 | 2,000.00 | September 13, 2023 | |||||||
|
— | 10 | 2,219.39 | September 13, 2023 | |||||||
|
30 | 10 | 3,000.00 | September 13, 2023 | |||||||
|
— | 30 | 1,692.06 | April 22, 2025 | |||||||
|
10 | 10 | 2,472.67 | April 22, 2025 | |||||||
|
— | 32 | 1,692.06 | May 20, 2024 | |||||||
|
32 | 16 | 2,472.67 | May 20, 2024 | |||||||
|
— | 122 | 3,214.00 | September 30, 2026 | |||||||
123
Option Exercises During Fiscal Year 2016
The following table provides information regarding option exercises by the NEOs during fiscal 2016.
| |
Option Awards | ||||||
|---|---|---|---|---|---|---|---|
Name
|
Number of Shares Acquired on Exercise (#) |
Value Realized on Exercise ($)(1) |
|||||
Thomas V. Taylor |
— | — | |||||
Trevor S. Lang |
180 | 415,260 | |||||
Lisa G. Laube |
— | — | |||||
Brian K. Robbins |
— | — | |||||
David V. Christopherson |
25 | 30,333 | |||||
Potential Payments upon Termination or Change in Control
In this section, we describe payments that may be made to our NEOs upon several events of termination, assuming the termination event occurred on the last day of fiscal 2016 (except as otherwise noted). See "—Fiscal 2016 Compensation—Elements of Our Executive Compensation Program—
124
Employment Agreements" for a description of the employment agreements and amounts payable upon certain terminations and, where applicable, upon a Change in Control.
Name
|
Cash Payments ($) |
Continuation of Welfare Plans ($) |
|||||
|---|---|---|---|---|---|---|---|
Thomas V. Taylor |
2,079,622 | (1) | 10,636 | (2) | |||
Termination Without Cause/Company Non-Renewal/Resignation for |
2,110,122 | (3) | |||||
Good Reason |
3,479,622 | (4) | 10,636 | (2) | |||
Death/Disability |
|||||||
Termination Within One Year Following a Change in Control |
|||||||
Trevor S. Lang |
410,000 | (5) | |||||
Termination Without Cause/Company Non-Renewal/Resignation for Good Reason |
|||||||
Lisa G. Laube |
490,000 | (5) | |||||
Termination Without Cause/Company Non-Renewal/Resignation for Good Reason |
|||||||
Brian K. Robbins |
351,527 | (5) | |||||
Termination Without Cause/Company Non-Renewal/Resignation for Good Reason |
|||||||
David V. Christopherson |
309,000 | (5) | |||||
Termination Without Cause/Company Non-Renewal/Resignation for Good Reason |
|||||||
125
Compensation of Our Directors for Fiscal 2016
Name
|
Fees Earned or Paid in Cash ($) |
Option Awards (#)(1) |
All Other Compensation ($)(2) |
Total ($) |
|||||||||
|---|---|---|---|---|---|---|---|---|---|---|---|---|---|
Norman Axelrod (Chairman) |
100,000 | — | 897,702 | 997,702 | |||||||||
Pamela Knous(3) |
75,000 | — | 390,305 | 465,305 | |||||||||
Peter Starrett |
40,000 | — | 390,305 | 430,305 | |||||||||
Vincent West |
— | — | 4,105,392 | 4,105,392 | |||||||||
John Roth |
— | — | — | — | |||||||||
Brad Brutocao |
— | — | — | — | |||||||||
David Kaplan |
— | — | — | — | |||||||||
Rachel Lee |
— | — | — | — | |||||||||
Director Compensation
For fiscal 2016, directors who were employees of Ares or Freeman Spogli or their respective affiliates or who were executives of the Company did not receive compensation for their services as directors. Directors who were not executives of the Company or employees of Ares or Freeman Spogli or their respective affiliates each earned director fees in fiscal 2016 as follows: Norman Axelrod, $100,000; Pamela Knous, $75,000; and Peter Starrett, $40,000.
In addition, George Vincent West is party to a consulting agreement with us, pursuant to which he receives annual consulting fees of $200,000. Either party may terminate the consulting agreement at any time upon 30 days written notice. Mr. West is subject to certain non-compete and non-solicitation restrictions while a consultant and for two years after the termination of his consultancy. In addition, Mr. West is subject to confidentiality and non-disparagement restrictions.
Certain of our directors received stock options prior to fiscal 2016 in connection with their service on the board of directors, or in the case of Mr. West, in connection with his services as our former Chief Executive Officer. See "Compensation of Our Directors for Fiscal 2016" above and "Principal Stockholders" below for more details.
Our board of directors utilized a review of director compensation from Hay Group to reassess director compensation. As a result of such review, effective January 1, 2017, we pay the following fees to each of our directors who are not executives of the Company or employees of Ares or Freeman Spogli or their respective affiliates (collectively, the "Non-Employee Directors"):
126
Directors who are not Non-Employee Directors do not receive any compensation for their services as directors.
Upon the completion of this offering, our board of directors intends to approve a compensation program that will pay the following fees to each of our Non-Employee Directors:
Directors who are not Non-Employee Directors will not receive any compensation for their services as directors.
We also reimburse our directors for reasonable out-of-pocket expenses incurred in connection with the performance of their duties as directors, including travel expenses in connection with their attendance in-person at board and committee meetings.
Equity Plan Disclosure
2011 Stock Incentive Plan
We maintain a stock incentive plan, the 2011 Plan, pursuant to which, we may grant incentive stock options, non-qualified stock options and restricted stock to our employees, consultants and non-employee directors. We will cease granting awards under the 2011 Plan upon the implementation of the 2017 Plan, described below.
The material terms of the 2011 Plan are summarized below. The following summary is qualified in its entirety by reference to the complete text of the 2011 Plan, a copy of which will be filed as an exhibit to the registration statement of which this prospectus forms a part.
Administration of the Plan
The board of directors has authority to administer the 2011 Plan. The board of directors has delegated such authority to the compensation committee (the board of directors, or compensation committee, as applicable, the "Administrator"). The compensation committee and the board of directors are authorized to grant awards to eligible employees, consultants and non-employee directors. The Administrator may also delegate the authority to grant awards covering a limited number of shares (not to exceed 1,000 per person) to the Chief Executive Officer, a committee of our officers or employees or one or more members of the board of directors. Any awards granted by such delegate must not be to any individuals subject to Section 16 of the Exchange Act or to any "covered employees" within the meaning of Section 162(m)(3) of the Code.
127
We intend to freeze the 2011 Plan in connection with this offering. Following the date the 2011 Plan is frozen, no further awards will be granted under the 2011 Plan but awards granted prior to the freeze date will continue in accordance with their terms and the terms of the 2011 Plan.
Number of Authorized Shares and Award Limits
The aggregate number of our shares of common stock that may be issued or used for reference purposes under the 2011 Plan may not exceed the sum of 38,905 shares (subject to adjustment as described below).
Our shares of common stock that are subject to awards under the 2011 Plan are counted against the overall limit as one share for every share granted or covered by an award.
The Administrator will, in accordance with the terms of the 2011 Plan, make appropriate adjustments to the above aggregate limits, to the number or kind of shares or other property (including cash) underlying awards and to the purchase price of shares underlying awards, in each case, to reflect any change in our capital structure or business by reason of any stock split, reverse stock split, stock dividend, combination or reclassification of shares, recapitalization, or other change in our capital structure, or an extraordinary cash dividend.
Eligibility and Participation
All of our and our affiliates' current and prospective eligible employees and consultants, as well as our non-employee directors, are eligible to be granted non-qualified stock options and restricted stock under the 2011 Plan. Only our and our subsidiaries' eligible employees are eligible to be granted incentive stock options ("ISOs") under the 2011 Plan. Eligibility for awards under the 2011 Plan is determined by the Administrator in its sole discretion.
Types of Awards
Stock Options. The 2011 Plan authorizes the Administrator to grant ISOs to eligible employees and non-qualified stock options to purchase shares to eligible employees, consultants, prospective employees, prospective consultants and non-employee directors. The Administrator will determine the number of shares of common stock subject to each option, the term of each option, the exercise price (which may not be less than the fair market value of the shares of common stock at the time of grant, or 110 percent of fair market value in the case of ISOs granted to ten-percent stockholders), the vesting schedule and the other terms and conditions of each option. Options will be exercisable at such times and subject to such terms as are determined by the Administrator at the time of grant. The maximum term of options under the 2011 Plan is ten years (or five years in the case of ISOs granted to ten-percent stockholders). Upon the exercise of an option, the participant must make payment of the full exercise price, either in cash or by check, bank draft or money order; solely to the extent permitted by law, through the delivery of irrevocable instructions to a broker, reasonably acceptable to us, to promptly deliver to us an amount equal to the aggregate exercise price; or on such other terms and conditions as may be acceptable to the Administrator (including, without limitation, the relinquishment of options or by payment in full or in part in the form of shares of common stock).
Restricted Stock. The 2011 Plan authorizes the Administrator to grant restricted stock to eligible employees, consultants, prospective employees, prospective consultants and non-employee directors. Recipients of restricted stock enter into an agreement with us subjecting the restricted stock to transfer and other restrictions and providing the criteria or dates on which such awards vest and such restrictions lapse. The restrictions on restricted stock may lapse and the awards may vest over time, based on performance criteria or other factors, as determined by the Administrator at the time of grant. Except as otherwise determined by the Administrator, a holder of restricted stock has all of the attendant rights of a stockholder including the right to receive dividends, if any, the right to vote such
128
shares and, subject to and conditioned upon the vesting and restrictions lapsing for the underlying shares, the right to tender such shares. However, the payment of dividends is deferred until and conditioned upon vesting and restrictions lapsing on the underlying restricted stock unless the Administrator, in its sole discretion, specifies otherwise at the time of grant.
Effect of Certain Transactions; Change in Control
In the event of a change in control, as defined in the 2011 Plan, the Administrator, in its sole discretion may, but is not obligated, to (i) accelerate, vest or cause the restrictions to lapse on outstanding awards, (ii) cancel awards in exchange for the fair value of the awards (for options, the fair value may mean the per share value paid in connection with the change in control less the per share exercise price of such options, if any, or for no value, if none), or (iii) provide that new awards will be substituted for outstanding awards.
Non-Transferability of Awards
Except as the Administrator may permit, at the time of grant or thereafter, awards granted under the 2011 Plan are generally not transferable by a participant other than by will or the laws of descent and distribution. Shares of common stock acquired by a permissible transferee will continue to be subject to the terms of the 2011 Plan and the applicable award agreement.
Term
Awards under the 2011 Plan may not be made after October 10, 2022, but awards granted prior to such date may extend beyond that date.
Amendment and Termination
Subject to the rules referred to in the balance of this paragraph, the board of directors may at any time amend, in whole or in part, any or all of the provisions of the 2011 Plan, or suspend or terminate it entirely, retroactively or otherwise. Except as required to comply with applicable law, no such amendment may adversely impair the rights of a participant with respect to awards previously granted without the consent of such participant. In addition, without the approval of stockholders, no amendment may be made that would: increase the aggregate number of shares of common stock that may be issued under the 2011 Plan; change the classification of individuals eligible to receive awards under the 2011 Plan; decrease the minimum exercise price of any stock option; extend the maximum term of any option; award any stock option as a replacement for a stock option that has a higher exercise price; or require stockholder approval in order for the 2011 Plan to continue to comply with Section 422 of the Code.
2017 Stock Incentive Plan
In anticipation of this offering, our board of directors is expected to adopt the 2017 Plan contingent upon the consummation of this offering. Our stockholders are expected to approve the 2017 Plan contingent upon the consummation of this offering. We believe that a new omnibus incentive plan is appropriate in connection with a public offering of our common stock not only to continue to enable us to grant awards to management to reward and incentivize their performance and retention, but also to have a long-term equity plan that is appropriate for us as a publicly held company.
The material terms of the 2017 Plan are summarized below. The following summary is qualified in its entirety by reference to the complete text of the 2017 Plan, a copy of which will be filed as an exhibit to the registration statement of which this prospectus forms a part.
129
Administration of the Plan
The board of directors intends to appoint the compensation committee as the committee under the 2017 Plan with the authority to administer the 2017 Plan (we continue to refer to the board of directors or compensation committee, as applicable, as the "Administrator"). The Administrator is authorized to grant awards to eligible employees, consultants and non-employee directors.
Number of Authorized Shares and Award Limits
The aggregate number of our shares of common stock that may be issued or used for reference purposes under the 2017 Plan may not exceed shares (subject to adjustment as described below).
Our shares of common stock that are subject to awards will be counted against the overall limit as one share for every share granted or covered by an award. If any award is cancelled, expires or terminates unexercised for any reason, the shares covered by such award will again be available for the grant of awards under the 2017 Plan, except that any shares that are not issued as the result of a net exercise or settlement or that are used to pay any exercise price or tax withholding obligation will not be available for the grant of awards. Shares of common stock that we repurchase on the open market with the proceeds of an option exercise price also will not be available for the grant of awards. Awards that may be settled solely in cash will not be deemed to use any shares.
The maximum number of our shares of common stock that may be subject to any award of stock options, any restricted stock or other stock-based award denominated in shares that may be granted under the 2017 Plan during any fiscal year to each employee or consultant is shares per type of award; provided that the maximum number of our shares of common stock for all types of awards during any fiscal year is shares per each employee or consultant and shares per each director. The maximum number of our shares of common stock that may be granted pursuant to awards under the 2017 Plan during any fiscal year to any non-employee director is shares. In addition, the maximum grant date value of any other stock-based awards denominated in cash and the maximum payment under any performance-based cash award granted under the 2017 Plan payable with respect to any fiscal year to an employee or consultant is $ .
The foregoing individual participant limits are cumulative; that is, to the extent that shares of common stock that may be granted to an individual in a fiscal year are not granted, the number of shares of common stock that may be granted to such individual is increased in the subsequent fiscal years during the term of the 2017 Plan until used. In addition, the foregoing limits (other than the limit on the maximum number of our shares of common stock for all types of awards during any fiscal year) will not apply (i) to options, restricted stock or other stock-based awards that constitute "restricted property" under Section 83 of the Code to the extent granted during the Reliance Period (as described below) or (ii) to performance-based cash awards or other types of other stock-based awards to the extent paid or otherwise settled during the Reliance Period.
For companies that become public in connection with an initial public offering, the deduction limit under Section 162(m) does not apply during a "reliance period" under the Treasury Regulations under Section 162(m) until the earliest of: (i) the expiration of the 2017 Plan, (ii) the date the 2017 Plan is materially amended for purposes of Treasury Regulation Section 1.162-27(h)(1)(iii); (iii) the date all shares of common stock available for issuance under the 2017 Plan have been allocated; or (iv) the date of the first annual meeting of our stockholders at which directors are to be elected that occurs after the close of the third calendar year following the calendar year in which the initial public offering occurs (such period, the "Reliance Period").
The Administrator will, in accordance with the terms of the 2017 Plan, make appropriate adjustments to the above aggregate and individual limits (other than cash limitations), to the number
130
and/or kind of shares or other property (including cash) underlying awards and to the purchase price of shares underlying awards, in each case, to reflect any change in our capital structure or business by reason of any stock split, reverse stock split, stock dividend, combination or reclassification of shares, any recapitalization, merger, consolidation, spin off, split off, reorganization or any partial or complete liquidation, any sale or transfer of all or part of our assets or business, or any other corporate transaction or event that would be considered an "equity restructuring" within the meaning of FASB ASC Topic 718. In addition, the Administrator may take similar action with respect to other extraordinary events.
Eligibility and Participation
All of our and our affiliates' current and prospective employees and consultants, as well as our Compensated Directors, are eligible to be granted non-qualified stock options, restricted stock, performance-based cash awards and other stock-based awards under the 2017 Plan. Only our and our subsidiaries' employees are eligible to be granted ISOs under the 2017 Plan. Eligibility for awards under the 2017 Plan is determined by the Administrator in its discretion.
Types of Awards
Stock Options. The 2017 Plan authorizes the Administrator to grant ISOs to eligible employees and non-qualified stock options to purchase shares to employees, consultants, prospective employees, prospective consultants and Compensated Directors. The Administrator will determine the number of shares of common stock subject to each option, the term of each option, the exercise price (which may not be less than the fair market value of the shares of common stock at the time of grant, or 110 percent of fair market value in the case of ISOs granted to ten-percent stockholders), the vesting schedule and the other terms and conditions of each option. Options will be exercisable at such times and subject to such terms as are determined by the Administrator at the time of grant. The maximum term of options under the 2017 Plan is ten years (or five years in the case of ISOs granted to ten-percent stockholders). Upon the exercise of an option, the participant must make payment of the full exercise price, either in cash or by check, bank draft or money order; solely to the extent permitted by law and authorized by the Administrator, through the delivery of irrevocable instructions to a broker, reasonably acceptable to us, to promptly deliver to us an amount equal to the aggregate exercise price; or on such other terms and conditions as may be acceptable to the Administrator (including, without limitation, the relinquishment of options or by payment in full or in part in the form of shares of common stock).
Restricted Stock. The 2017 Plan authorizes the Administrator to grant restricted stock. Recipients of restricted stock enter into an agreement with us subjecting the restricted stock to transfer and other restrictions and providing the criteria or dates on which such awards vest and such restrictions lapse. The restrictions on restricted stock may lapse and the awards may vest over time, based on performance criteria or other factors (including, without limitation, performance goals that are intended to comply with the performance-based compensation exception under Section 162(m), as discussed below), as determined by the Administrator at the time of grant. Except as otherwise determined by the Administrator, a holder of restricted stock has all of the attendant rights of a stockholder including the right to receive dividends, if any, subject to and conditioned upon vesting and restrictions lapsing on the underlying restricted stock, the right to vote shares and, subject to and conditioned upon the vesting and restrictions lapsing for the underlying shares, the right to tender such shares. However, the Administrator may in its discretion provide at the time of grant that the right to receive dividends on restricted stock will not be subject to the vesting or lapsing of the restrictions on the restricted stock.
Other Stock-Based Awards. The 2017 Plan authorizes the Administrator to grant awards of shares of common stock and other awards that are valued in whole or in part by reference to, or are
131
payable in or otherwise based on, shares of common stock, including, but not limited to, shares of common stock awarded purely as a bonus and not subject to any restrictions or conditions; shares of common stock in payment of the amounts due under an incentive or performance plan sponsored or maintained by us or an affiliate; stock appreciation rights; stock equivalent units; restricted stock units; performance awards entitling participants to receive a number of shares of common stock (or cash in an equivalent value) or a fixed dollar amount, payable in cash, stock or a combination of both, with respect to a designated performance period; or awards valued by reference to book value of our shares of common stock. In general, other stock-based awards that are denominated in shares of common stock will include the right to receive dividends, if any, subject to and conditioned upon vesting and restrictions lapsing on the underlying award, but the Administrator may in its discretion provide at the time of grant that the right to receive dividends on a stock-denominated award will not be subject to the vesting or lapsing of the restrictions on the performance award.
Performance-Based Cash Awards
The 2017 Plan authorizes the Administrator to grant cash awards that are payable or otherwise based on the attainment of pre-established performance goals during a performance period. As noted above, following the Reliance Period, performance-based cash awards granted under the 2017 Plan that are intended to satisfy the performance-based compensation exception under Section 162(m) will vest based on attainment of specified performance goals established by the Administrator. These performance goals will be based on the attainment of a certain target level of, or a specified increase in (or decrease where noted), criteria selected by the Administrator.
Such performance goals may be based upon the attainment of specified levels of company, affiliate, subsidiary, division, other operational unit, business segment or administrative department performance under one or more of the measures described above relative to the performance of other companies. The Administrator may designate additional business criteria on which the performance goals may be based or adjust, modify or amend those criteria, to the extent permitted by Section 162(m). Unless the Administrator determines otherwise, to the extent permitted by Section 162(m), the Administrator will disregard and exclude the impact of special, unusual or non-recurring items, events, occurrences or circumstances; discontinued operations or the disposal of a business; the operations of any business that we acquire during the fiscal year or other applicable performance period; or a change in accounting standards required by generally accepted accounting principles or changes in applicable law or regulations.
Effect of Certain Transactions; Change in Control
In the event of a change in control, as defined in the 2017 Plan, except as otherwise provided by the Administrator, unvested awards will not vest. Instead, the Administrator may, in its sole discretion provide that outstanding awards will be: assumed and continued; purchased based on the price per share paid in the change in control transaction (less, in the case of options and SARs, the exercise price), as adjusted by the Administrator for any contingent purchase price, escrow obligations, indemnification obligations or other adjustments to the purchase price; and/or in the case of stock options or other stock-based appreciation awards where the change in control price is less than the applicable exercise price, cancelled. However, the Administrator may in its sole discretion provide for the acceleration of vesting and lapse of restrictions of an award at any time including in connection with a change in control.
Non-Transferability of Awards
Except as the Administrator may permit, at the time of grant or thereafter, awards granted under the 2017 Plan are generally not transferable by a participant other than by will or the laws of
132
descent and distribution. Shares of common stock acquired by a permissible transferee will continue to be subject to the terms of the 2017 Plan and the applicable award agreement.
Term
Awards under the 2017 Plan may not be made after , 2027, but awards granted prior to such date may extend beyond that date. We may seek stockholder reapproval of the performance goals in the 2017 Plan. If such stockholder approval is obtained, on or after the first stockholders' meeting in the fifth year following the year of the last stockholder approval of the performance goals in the 2017 Plan, awards under the 2017 Plan may be based on such performance goals in order to qualify for the "performance-based compensation" exception under Section 162(m).
Amendment and Termination
Subject to the rules referred to in the balance of this paragraph, our board of directors or the Administrator (to the extent permitted by law) may at any time amend, in whole or in part, any or all of the provisions of the 2017 Plan, or suspend or terminate it entirely, retroactively or otherwise. Except as required to comply with applicable law, no such amendment, suspension or termination may reduce the rights of a participant with respect to awards previously granted without the consent of such participant. In addition, without the approval of stockholders, no amendment may be made that would: increase the aggregate number of shares of common stock that may be issued under the 2017 Plan; increase the maximum individual participant share limitations for a fiscal year or year of a performance period; change the classification of individuals eligible to receive awards under the 2017 Plan; extend the maximum term of any option; reduce the exercise price of any option or SAR or cancel any outstanding "in-the-money" option or SAR in exchange for cash; substitute any option or SAR in exchange for an option or SAR (or similar other award) with a lower exercise price; alter the performance goals; or require stockholder approval in order for the 2017 Plan to continue to comply with Section 162(m) or Section 422 of the Code.
Following consummation of this offering, we intend to file a registration statement on Form S-8 under the Securities Act to register the full number of shares of common stock that will be available for issuance under the 2017 Plan, as described in the section titled "—2017 Plan—Number of Authorized Shares and Award Limits" above.
Federal Income Tax Implications of the Incentive Plans
The federal income tax consequences arising with respect to awards granted under the Incentive Plans will depend on the type of award. From the recipients' standpoint, as a general rule, ordinary income will be recognized at the time of payment of cash, or delivery of actual shares. Future appreciation on shares held beyond the ordinary income recognition event will be taxable at capital gains rates when the shares are sold. We, as a general rule, will be entitled to a tax deduction that corresponds in time and amount to the ordinary income recognized by the recipient, and we will not be entitled to any tax deduction in respect of capital gain income recognized by the recipient. Exceptions to these general rules may arise under the following circumstances: (i) if shares, when delivered, are subject to a substantial risk of forfeiture by reason of failure to satisfy any employment or performance-related condition, ordinary income taxation and our tax deduction will be delayed until the risk of forfeiture lapses (unless the recipient makes a special election to ignore the risk of forfeiture); (ii) if an employee is granted an ISO, no ordinary income will be recognized, and we will not be entitled to any tax deduction, if shares acquired upon exercise of the ISO are held longer than the later of one year from the date of exercise and two years from the date of grant; (iii) for awards granted after the Reliance Period, we may not be entitled to a tax deduction for compensation attributable to awards granted to one of our named executive officers (other than our Chief Financial Officer), if and to the extent such compensation does not qualify as "performance-based" compensation under
133
Section 162(m), and such compensation, along with any other non-performance-based compensation paid in the same calendar year, exceeds $1 million; and (iv) an award may be taxable at 20% above ordinary income tax rates at the time it becomes vested, even if that is prior to the delivery of the cash or stock in settlement of the award, if the award constitutes "deferred compensation" under Section 409A of the Code, and the requirements of Section 409A of the Code are not satisfied. The foregoing provides only a general description of the application of federal income tax laws to certain awards under the Incentive Plans, and is not intended as tax guidance to participants in the Incentive Plans, as the tax consequences may vary with the types of awards made, the identity of the recipients and the method of payment or settlement. This summary does not address the effects of other federal taxes (including possible "golden parachute" excise taxes) or taxes imposed under state, local, or foreign tax laws.
134
CERTAIN RELATIONSHIPS AND RELATED PARTY TRANSACTIONS
Pre-IPO Shareholders Agreement
We are party to a Shareholders Agreement, dated as of November 24, 2010 (as amended, the "Pre-IPO Shareholders Agreement"), among us and each of our stockholders, including Ares, Freeman Spogli and certain of our directors, executive officers and other employees. However, in connection with the closing of this offering, the Pre-IPO Shareholders Agreement will effectively be replaced by a registration rights agreement (the "Registration Rights Agreement") and a separate investor rights agreement (the "Investor Rights Agreement"), each as described in more detail below.
Registration Rights Agreement
Pursuant to the terms of the Registration Rights Agreement, Ares, Freeman Spogli and certain other signatories thereto will be entitled to various rights with respect to the registration of their shares under the Securities Act. Registration of these any of these shares under the Securities Act would result in such shares becoming fully tradable without restriction under the Securities Act immediately upon the effectiveness of the registration, except for shares purchased by affiliates.
Demand Registration Rights
At any time following the closing of this offering and the expiration of the applicable lock-up period, subject to certain conditions and restrictions contained in the Registration Rights Agreement, our Sponsors will be able to require us to use reasonable best efforts to register their common stock under the Securities Act.
Piggyback Registration Rights
In the event of a demand registration or if we propose to register any of our own securities under the Securities Act in a public offering, we will be required to provide notice to the holders of our common stock with registration rights under the Registration Rights Agreement and provide them with the right to include their shares in the registration statement, subject to certain conditions and exceptions contained in the Registration Rights Agreement.
Expenses
We will be required to bear the registration expenses, other than underwriting discounts and commissions and transfer taxes, associated with any registration of shares of our common stock held by the holders of our common stock with registration rights under the Registration Rights Agreement.
Investor Rights Agreement
Pursuant to the terms of the Investor Rights Agreement, each Sponsor is entitled to nominate (a) five directors for election to our board of directors for so long as it holds 40% or more of our outstanding common stock, (b) three directors for election to our board of directors for so long as it holds 30% or more of our outstanding common stock, (c) two directors for election to our board of directors for so long as it holds 15% or more of our outstanding common stock and (d) one director for election to our board of directors for so long as it holds 5% or more of our outstanding common stock. In particular, Ares has nominated Messrs. Axelrod, Kaplan and West and Ms. Lee for election to our board of directors, and Freeman Spogli has nominated Messrs. Brutocao and Roth for election to our board of directors. Pursuant to the terms of the Investor Rights Agreement, each Sponsor will agree to vote in favor of the other Sponsor's nominees and for the election of our then-current chief executive officer to our board of directors. The Investor Rights Agreement also provides that the size of our board of directors may not exceed 12 members unless otherwise agreed by our Sponsors. In
135
addition, subject to certain conditions, the Investor Rights Agreement provides each Sponsor with certain rights with respect to board committee membership, except to the extent that such membership would violate applicable securities laws or stock exchange or stock market rules.
Directors nominated by our Sponsors may be removed with or without cause by the affirmative vote of the Sponsor entitled to nominate such director. In all other cases and at any other time, directors may only be removed for cause by the affirmative vote of at least a majority of the voting power of our common stock.
Indemnification of Officers and Directors
Our certificate of incorporation and bylaws provide that we will indemnify each of our directors and officers to the fullest extent permitted by Delaware law. In addition, we have entered into indemnification agreements with each of our directors and executive officers. See "Description of Our Capital Stock—Limitation on Liability and Indemnification" below for more details.
Reserved Share Program
The underwriters have reserved up to of the shares of Class A common stock being offered by this prospectus for sale, at the initial public offering price, to our directors, officers, employees and other parties related to us as part of a reserved share program. The reserved share program will not limit the ability of our directors, officers, employees and other parties related to us to purchase more than $120,000 in value of our Class A common stock. We do not currently know the extent to which these related persons will participate in our reserved share program, if at all, or the extent to which they will purchase more than $120,000 in value of our Class A common stock.
Ordinary Course Transactions with Related Persons
From time to time, our and our Sponsors' directors, officers, employees and affiliates may enter into commercial transactions with us in the ordinary course of business, primarily for the purchase of inventory at our stores. We do not believe that any such transaction is significant enough to be material to us or the applicable related person.
Statement of Policy Regarding Transactions with Related Persons
Since November 2010, we have been subject to requirements for the approval of certain related party transactions set forth in the Pre-IPO Shareholders Agreement. Pursuant to the Pre-IPO Shareholders Agreement, the consent of Ares and Freeman Spogli or the affirmative vote of a majority of the directors nominated by Ares and a majority of the directors nominated by Freeman Spogli was required to approve a transaction with any of our affiliates. As disclosed above, the Pre-IPO Shareholders Agreement will effectively be replaced by the Registration Rights Agreement and the Investor Rights Agreement in connection with the closing of this offering, neither of which will have provisions governing related party transactions.
Upon the closing of this offering, the policies regarding transactions with related persons will be included in the charter of our audit committee and in our Corporate Governance Guidelines, each of which will require that any transaction with a "related person" (as defined in paragraph (a) of Item 404 Regulation S-K) that is brought to the audit committee's attention be reviewed and approved by the audit committee.
136
The following table sets forth information regarding the beneficial ownership of our common stock as of , 2017, by:
Beneficial ownership is determined according to the rules of the SEC and generally means that a person has beneficial ownership of a security if he, she or it possesses sole or shared voting or investment power of that security, including options that are currently exercisable or exercisable within 60 days of , 2017. Shares issuable pursuant to options are deemed outstanding for computing the percentage of the person holding such options, but are not outstanding for computing the percentage of any other person. Except as indicated by the footnotes below, we believe, based on the information furnished to us, that the persons named in the table below have sole voting and investment power with respect to all shares of Class A common stock and Class C common stock shown that they beneficially own, subject to community property laws where applicable. The information does not necessarily indicate beneficial ownership for any other purpose.
Our calculation of the percentage of beneficial ownership is based on shares of Class A common stock and shares of Class C common stock outstanding as of , 2017, after giving effect to the -for-one stock split of our common stock to be effected prior to the consummation of this offering and assuming that all shares of our Class B common stock are automatically converted on a one-to-one basis into shares of our Class A common stock.
137
Unless otherwise indicated, the address of each beneficial owner listed in the table below is c/o Floor & Decor Holdings, Inc., 2233 Lake Park Drive, Smyrna, GA 30080.
Name of Beneficial Owner
|
Number of Class A Shares Beneficially Owned(1) |
Percentage Class A Beneficially Owned(1) |
Number of Class C Shares Beneficially Owned(1) |
Percentage Class C Beneficially Owned(1) |
Total Shares Beneficially Owned(1) |
Total Percentage Beneficially Owned(1) |
||||||||||||
|---|---|---|---|---|---|---|---|---|---|---|---|---|---|---|---|---|---|---|
Named Executive Officers and Directors: |
||||||||||||||||||
Thomas V. Taylor(2) |
||||||||||||||||||
Trevor S. Lang(3) |
||||||||||||||||||
Lisa G. Laube(4) |
||||||||||||||||||
Brian K. Robbins(5) |
||||||||||||||||||
David V. Christopherson(6) |
||||||||||||||||||
Norman H. Axelrod(7) |
||||||||||||||||||
George Vincent West(8) |
||||||||||||||||||
Brad J. Brutocao |
||||||||||||||||||
David B. Kaplan |
||||||||||||||||||
Rachel H. Lee |
||||||||||||||||||
John M. Roth |
||||||||||||||||||
Peter M. Starrett(9) |
||||||||||||||||||
All directors and executive officers as a group (12 persons) |
||||||||||||||||||
5% Stockholders: |
||||||||||||||||||
Ares Corporate Opportunities Fund III, L.P.(10)(11) |
||||||||||||||||||
FS Equity Partners VI, L.P. and FS Affiliates VI, L.P., as a group(10)(12) |
||||||||||||||||||
138
139
expressly disclaims beneficial ownership of the shares of Class A common stock. The address of each Ares Entity is 2000 Avenue of the Stars, 12th Floor, Los Angeles, California 90067.
140
General
As of the closing of this offering, our authorized capital stock will consist of shares of common stock, par value $0.001 per share, which is composed of shares of our Class A common stock and shares of our Class C common stock and shares of undesignated preferred stock, par value $0.001 per share. Our shares of Class A common stock and Class C common stock are convertible into each other under certain circumstances described in more detail below and otherwise generally have the same rights except that shares of Class C Common Stock are non-voting while shares of Class A Common Stock are entitled to one vote per share. The following description summarizes the most important terms of our capital stock. Because it is only a summary, it does not contain all the information that may be important to you. For a complete description, you should refer to our certificate of incorporation and bylaws, which will be in place prior to the closing of this offering and included as exhibits to the registration statement of which this prospectus forms a part. The descriptions of our common stock and preferred stock below reflect changes to our capital structure that will be in effect prior to the closing of this offering.
Common Stock
As of , 2017, after giving effect to the -for-one stock split of our common stock to be effected prior to the consummation of this offering, there were shares of our common stock outstanding, held by stockholders of record. Immediately after the closing of this offering, there will be shares of our common stock outstanding, or shares if the underwriters' option to purchase additional shares is exercised in full. All of such shares will be Class A shares of common stock except for shares of Class C common stock owned by Freeman Spogli and its affiliates.
Dividend Rights
Subject to preferences that may apply to shares of preferred stock outstanding at the time, the holders of outstanding shares of our common stock are entitled to receive dividends out of funds legally available at the times and in the amounts that our board of directors may determine.
Voting Rights
Each holder of our Class A common stock is entitled to one vote for each share of Class A common stock held on all matters submitted to a vote of stockholders. Holders of our Class C common stock are not entitled to vote, except as required under Delaware law. Our stockholders do not have cumulative voting rights.
Conversion Rights
Shares of our Class C common stock are automatically converted into shares of our Class A common stock on a one for one basis if the holder of such Class C common stock is not Freeman Spogli or any of its affiliates. In addition, Freeman Spogli or any of its affiliates may convert their shares of Class C common stock into shares of our Class A Common Stock, in whole or in part, at any time and from time to time at their option, on a one for one basis so long as at such time either Ares and its affiliates or Freeman Spogli and its affiliates do not own more than 24.9% of our Class A common stock after giving effect to any such conversion. In addition, shares of our Class A common stock held by Freeman Spogli or any of its affiliates are convertible into shares of our Class C common stock, in whole or in part, at any time and from time to time at the election of Freeman Spogli or any of its affiliates, on a one for one basis.
141
Preemptive or Similar Rights
Our common stock is not entitled to preemptive rights and is not subject to redemption. The rights of the holders of our common stock are subject to, and may be adversely affected by, the rights of the holders of shares of any series of our preferred stock that our board of directors may designate and issue in the future.
Liquidation Rights
Upon our liquidation, dissolution or winding-up, the assets legally available for distribution to our stockholders would be distributable ratably among the holders of our common stock and any participating preferred stock outstanding at that time after payment of liquidation preferences, if any, on any outstanding shares of preferred stock and payment of other claims of creditors.
Options
As of , 2017, after giving effect to the -for-one stock split of our common stock to be effected prior to the consummation of this offering and assuming that all shares of our Class B common stock are automatically converted on a one-to-one basis into shares of our Class A common stock upon the closing of this offering pursuant to our certificate of incorporation, we had outstanding stock options to purchase an aggregate of shares of our common stock under the 2011 Plan. Upon the closing of this offering, no additional shares of our common stock will be reserved for issuance under the 2011 Plan, and shares of our common stock will be reserved for issuance under the 2017 Plan. See "Executive and Director Compensation—Equity Plan Disclosure" and "Shares Eligible for Future Sale."
Preferred Stock
As of , 2017, there were no shares of preferred stock outstanding. Upon the closing of this offering, we will have no shares of preferred stock outstanding.
Our board of directors is authorized, subject to limitations prescribed by Delaware law, to issue up to shares of our preferred stock in one or more series, to establish from time to time the number of shares to be included in each series, to fix the designation, powers, preferences and rights of the shares of each series and any of its qualifications, limitations or restrictions, in each case without further action by our stockholders. Our board of directors can also increase or decrease the number of shares of any series of preferred stock, but not below the number of shares of that series then outstanding. Our board of directors may authorize the issuance of preferred stock with voting or conversion rights that could adversely affect the voting power or other rights of the holders of the Class A common stock.
The issuance of preferred stock, while providing flexibility in connection with possible acquisitions and other corporate purposes, could, among other things, have the effect of delaying, deferring or preventing a change in our control and could adversely affect the market price of our common stock and the voting and other rights of the holders of our common stock.
Registration Rights
Pursuant to the terms of the Registration Rights Agreement, the holders of shares of our common stock (after giving effect to the -for-one stock split of our common stock to be effected prior to the consummation of this offering), or their transferees, are entitled to various rights with respect to the registration of their shares under the Securities Act.
For a more detailed description of the Registration Rights Agreement, see "Certain Relationships and Related Party Transactions—Registration Rights Agreement."
142
Investor Rights Agreement
Pursuant to the terms of the Investor Rights Agreement, Ares and Freeman Spogli will have certain rights and obligations with respect to voting for the nomination of certain directors and director nominees and with respect to board committee membership.
For a more detailed description of the Investor Rights Agreement, see "Certain Relationships and Related Party Transactions—Investor Rights Agreement."
Exclusive Venue
Our certificate of incorporation requires, to the fullest extent permitted by law, that (i) any derivative action or proceeding brought on our behalf, (ii) any action asserting a claim of breach of a fiduciary duty owed by any of our directors, officers or other employees to us or our stockholders, (iii) any action asserting a claim against us arising pursuant to any provision of the DGCL or our certificate of incorporation or the bylaws or (iv) any action asserting a claim against us governed by the internal affairs doctrine will have to be brought only in the Court of Chancery in the State of Delaware. Although we believe this provision benefits us by providing increased consistency in the application of Delaware law in the types of lawsuits to which it applies, the provision may have the effect of discouraging lawsuits against our directors and officers. Although we have included an exclusive venue provision in our certificate of incorporation, it is possible that a court could rule that such provision is inapplicable or unenforceable. In addition, this provision would not affect the ability of our stockholders to seek remedies under the federal securities laws.
Anti-Takeover Effects of Our Certificate of Incorporation and Bylaws
We are governed by the Delaware General Corporation Law (the "DGCL"). Our certificate of incorporation and bylaws contain certain provisions that could have the effect of delaying, deterring or preventing another party from acquiring control of us. These provisions, which are summarized below, may discourage coercive takeover practices and inadequate takeover bids. These provisions are also designed, in part, to encourage persons seeking to acquire control of us to negotiate first with our board of directors. We believe that the benefits of increased protection of our potential ability to negotiate more favorable terms with an unfriendly or unsolicited acquirer outweigh the disadvantages of potentially discouraging a proposal to acquire us.
Undesignated Preferred Stock
As discussed above, our board of directors has the ability to issue preferred stock with voting or other rights or preferences that could impede the success of any attempt to acquire control of us. These and other provisions may have the effect of deterring hostile takeovers or delaying changes in control or management of us.
Limits on Ability of Stockholders to Act by Written Consent or Call a Special Meeting
Our certificate of incorporation provides that our stockholders may not act by written consent unless our Sponsors collectively own a majority of our outstanding Class A common stock, which may lengthen the amount of time required to take stockholder actions. As a result, except for our Sponsors, a holder controlling a majority of our capital stock would not be able to amend our bylaws or remove directors without holding a meeting of our stockholders called in accordance with our bylaws. In addition, our certificate of incorporation provides that special meetings of the stockholders may be called only by the chairperson of our board or our board of directors. However, for so long as our Sponsors collectively own a majority of our outstanding Class A common stock, special meetings of our stockholders may be called by the affirmative vote of the holders of a majority of our outstanding Class A common stock. Stockholders may not call a special meeting, which may delay the ability of our
143
stockholders to force consideration of a proposal or for holders controlling a majority of our capital stock to take any action, including the removal of directors.
Requirements for Advance Notification of Stockholder Nominations and Proposals
Our bylaws establish advance notice procedures with respect to stockholder proposals and the nomination of candidates for election as directors, other than nominations made by or at the direction of our board of directors or a committee of our board of directors. These provisions may have the effect of precluding the conduct of certain business at a meeting if the proper procedures are not followed. These provisions may also discourage or deter a potential acquirer from conducting a solicitation of proxies to elect the acquirer's own slate of directors or otherwise attempting to obtain control of us.
Board Classification
Our board of directors is divided into three classes, one class of which is elected each year by our stockholders. The directors in each class will serve for a three-year term. For more information on the classified board, see "Management—Board Composition." The classification of our board of directors and the limitations on the ability of our stockholders to remove directors could make it more difficult for a third -party to acquire, or discourage a third-party from seeking to acquire, control of us.
Removal of Directors; Vacancies
Pursuant to the terms of the Investor Rights Agreement, directors nominated by our Sponsors may be removed with or without cause by the affirmative vote of the Sponsor entitled to nominate such director. In all other cases and at any other time, directors may only be removed for cause by the affirmative vote of at least a majority of the voting power of our common stock. Our board of directors, or our Sponsors in the case of one of their respective board nominees, has the sole power to fill any vacancy on the board of directors, whether such vacancy occurs as a result of an increase in the number of directors or otherwise.
No Cumulative Voting
Our certificate of incorporation and bylaws do not permit cumulative voting in the election of directors. Cumulative voting allows a stockholder to vote a portion or all of the stockholder's shares for one or more candidates for seats on the board of directors. Without cumulative voting, a minority stockholder may not be able to gain as many seats on our board of directors as the stockholder would be able to gain if cumulative voting were permitted. The absence of cumulative voting makes it more difficult for a minority stockholder to gain a seat on our board of directors to influence our board of directors' decision regarding a takeover or otherwise.
Amendment of Charter and Bylaw Provisions
In the event our Sponsors cease to collectively own a majority of our outstanding Class A common stock, the amendment of certain of the above provisions of our certificate of incorporation will require approval by holders of at least two-thirds of our outstanding Class A common stock. In addition, under the DGCL, an amendment to our certificate of incorporation that would alter or change the powers, preferences or special rights of our Class C common stock so as to affect them adversely also must be approved by a majority of the votes entitled to be cast by the holders of the shares affected by the amendment, voting as a separate class. Our certificate of incorporation provides that our board of directors may from time to time adopt, amend, alter or repeal our bylaws by a vote of a majority of our board of directors without stockholder approval and that our stockholders may
144
adopt, amend, alter or repeal our bylaws by the affirmative vote of the holders of at least two-thirds of our outstanding Class A common stock.
Delaware Anti-Takeover Statute
Our certificate of incorporation provides that we are not governed by Section 203 of the DGCL, which, in the absence of such provision, would have imposed additional requirements regarding mergers and other business combinations.
The provisions of our certificate of incorporation and bylaws could have the effect of discouraging others from attempting hostile takeovers and, as a consequence, might also inhibit temporary fluctuations in the market price of our common stock that often result from actual or rumored hostile takeover attempts. These provisions might also have the effect of preventing changes in our management. It is possible that these provisions could make it more difficult to accomplish transactions that stockholders might otherwise deem to be in their best interests.
Corporate Opportunity
Our certificate of incorporation provides that no officer or director of ours who is also an officer, director, employee, managing director or other affiliate of our Sponsors will be liable to us or our stockholders for breach of any fiduciary duty by reason of the fact that any such individual directs a corporate opportunity to our Sponsors instead of us, or does not communicate information regarding a corporate opportunity to us that the officer, director, employee, managing director or other affiliate has directed to our Sponsors.
Limitations of Liability, Indemnification and Advancement
Our certificate of incorporation and bylaws provide that we will indemnify and advance expenses to our directors and officers, and may indemnify and advance expenses to our employees and other agents, to the fullest extent permitted by Delaware law, which prohibits our certificate of incorporation from limiting the liability of our directors for the following:
If Delaware law is amended to authorize corporate action further eliminating or limiting the personal liability of a director, then the liability of our directors will be eliminated or limited to the fullest extent permitted by Delaware law, as so amended. Our certificate of incorporation will not eliminate a director's duty of care and, in appropriate circumstances, equitable remedies, such as injunctive or other forms of non-monetary relief, remain available under Delaware law. This provision also does not affect a director's responsibilities under any other laws, such as the federal securities laws or other state or federal laws. Under our certificate of incorporation and bylaws, we will also be empowered to purchase insurance on behalf of any person whom we are required or permitted to indemnify.
In addition to the indemnification and advancement of expenses required in our certificate of incorporation and bylaws, we intend to enter into indemnification agreements with each of our current directors and executive officers. These agreements will provide for the indemnification of, and the advancement of expenses to, such persons for all reasonable expenses and liabilities, including attorneys' fees, judgments, fines and settlement amounts, incurred in connection with any action or
145
proceeding brought against them by reason of the fact that they are or were serving in such capacity. We believe that these charter and bylaw provisions and indemnification agreements are necessary to attract and retain qualified persons as directors and officers. We also maintain directors' and officers' liability insurance.
The limitation of liability, indemnification and advancement provisions in our certificate of incorporation and bylaws may discourage stockholders from bringing a lawsuit against directors for breach of their fiduciary duties. They may also reduce the likelihood of derivative litigation against directors and officers, even though an action, if successful, might benefit us and our stockholders. A stockholder's investment may be harmed to the extent we pay the costs of settlement and damage awards against directors and officers pursuant to these indemnification provisions. Insofar as indemnification for liabilities arising under the Securities Act may be permitted to our directors, officers and controlling persons pursuant to the foregoing provisions, or otherwise, we have been advised that, in the opinion of the SEC, such indemnification is against public policy as expressed in the Securities Act, and is, therefore, unenforceable. There is no pending litigation or proceeding naming any of our directors or officers as to which indemnification is being sought, nor are we aware of any pending or threatened litigation that may result in claims for indemnification or advancement by any director or officer.
Listing
We intend to apply to list our Class A common stock on the New York Stock Exchange under the symbol "FND".
Transfer Agent and Registrar
Upon the closing of this offering, the transfer agent and registrar for our common stock will be American Stock Transfer & Trust Company, LLC.
146
SHARES ELIGIBLE FOR FUTURE SALE
Prior to this offering, there has been no public market for our capital stock. Future sales of our common stock in the public market, or the availability of such shares for sale in the public market, could adversely affect market prices prevailing from time to time. As described below, only a limited number of shares will be available for sale shortly after this offering due to contractual and legal restrictions on resale. Nevertheless, sales of our common stock in the public market after such restrictions lapse, or the perception that those sales may occur, could adversely affect the prevailing market price at such time and our ability to raise equity capital in the future.
Upon the closing of this offering, shares of common stock will be outstanding, in each case assuming no exercise of the underwriters' option to purchase additional shares and assuming no exercise of outstanding options prior to the closing of this offering. In addition, as of the closing of this offering, there will be outstanding options to acquire shares of common stock under the Incentive Plans. Of the outstanding shares, all of the shares of common stock sold in this offering will be freely tradable, except that any shares held by our affiliates, as that term is defined in Rule 144, may only be sold in compliance with the limitations described below.
The remaining shares of our common stock outstanding after this offering are restricted securities, as such term is defined in Rule 144, or are subject to lock-up agreements with the underwriters of this offering, as described below. Following the expiration of the lock-up period pursuant to any such lock-up agreements, restricted securities may be sold in the public market only if registered or if they qualify for an exemption from registration under Rule 144 or Rule 701 promulgated under the Securities Act ("Rule 701"), described in greater detail below.
Rule 144
In general, a person who has beneficially owned restricted shares of our common stock for at least six months would be entitled to sell their securities provided that (i) such person is not deemed to have been one of our affiliates at the time of, or at any time during the 90 days preceding, a sale and (ii) we are subject to the Exchange Act periodic reporting requirements for at least 90 days before the sale. Persons who have beneficially owned restricted shares of our common stock for at least six months but who are our affiliates at the time of, or any time during the 90 days preceding, a sale, would be subject to additional restrictions, by which such person would be entitled to sell within any three-month period only a number of securities that does not exceed the greater of either of the following:
provided, in each case, that we are subject to the Exchange Act periodic reporting requirements for at least 90 days before the sale. Such sales both by affiliates and by non-affiliates must also comply with the manner of sale, current public information, and notice provisions of Rule 144.
Notwithstanding the availability of Rule 144, the holders of substantially all of our restricted shares will have entered into lock-up agreements, as described below and under "Underwriting," and their restricted shares will become eligible for sale only following expiration of the restrictions set forth in those agreements.
147
Rule 701
Rule 701 under the Securities Act, as in effect on the date of this prospectus, permits resales of shares in reliance upon Rule 144 but without compliance with certain restrictions of Rule 144, including the holding period requirement. Most of our employees, executive officers, directors, or consultants who purchased shares under a written compensatory plan or contract may be entitled to rely on the resale provisions of Rule 701, but all holders of Rule 701 shares are required to wait until 90 days after the date of this prospectus before selling their shares. However, substantially all Rule 701 shares are subject to lock-up agreements as described below and under "Underwriting," and will become eligible for sale only following expiration of those agreements.
Lock-Up Agreements
We, our executive officers, directors and the holders of substantially all of our existing shares of Class A common stock have agreed not to, subject to certain limited exceptions, sell or transfer any common stock or securities convertible into, exchangeable for, exercisable for, or repayable with common stock, for 180 days after the date of this prospectus without first obtaining the written consent of Merrill Lynch, Pierce, Fenner & Smith Incorporated and Barclays Capital Inc. See "Underwriting—No Sales of Similar Securities."
Registration Rights
Pursuant to the terms of the Registration Rights Agreement, the holders of shares of our common stock, after giving effect to the -for-one stock split of our common stock to be effected prior to the consummation of this offering, or their transferees, are entitled to various rights with respect to the registration of their shares under the Securities Act.
For a more detailed description of the Registration Rights Agreement, see "Certain Relationships and Related Party Transactions—Registration Rights Agreement."
Incentive Plans
As soon as practicable after the closing of this offering, we intend to file a Form S-8 registration statement under the Securities Act to register shares of our common stock issued or reserved for issuance under the Incentive Plans. The Form S-8 registration statement will become effective immediately upon filing, and shares covered by that registration statement will thereupon be eligible for sale in the public markets, subject to vesting restrictions, the lock-up agreements described above and under "Underwriting," and Rule 144 limitations applicable to affiliates. For a more complete discussion of our equity compensation plans, see "Executive and Director Compensation—Equity Plan Disclosure."
148
MATERIAL U.S. FEDERAL INCOME TAX CONSIDERATIONS FOR NON-U.S. HOLDERS OF COMMON STOCK
The following discussion is a summary of the material U.S. federal income tax consequences to non-U.S. holders (as defined below) with respect to the purchase, ownership and disposition of our common stock to be sold in this offering. This does not purport to be a complete analysis of all potential tax effects to non-U.S. holders of our common stock. The effects of other U.S. federal tax laws, such as estate and gift tax laws, and any applicable state, local or foreign tax laws are not included in this discussion, and non-U.S. holders should consult their own tax advisors as to these matters. This discussion is based on the Code, Treasury Regulations promulgated thereunder, judicial decisions, and published rulings and administrative pronouncements of the U.S. Internal Revenue Service ("IRS") in effect as of the date of this prospectus. These authorities may change or be subject to differing interpretations. Any such change may be applied retroactively in a manner that could adversely affect a non-U.S. holder of our common stock. We have not sought and will not seek any rulings from the IRS regarding the matters discussed below. There can be no assurance that the IRS or a court will not take a contrary position regarding the tax consequences of the purchase, ownership and disposition of our common stock.
This discussion is limited to non-U.S. holders that hold our common stock as a "capital asset" within the meaning of Section 1221 of the Code (generally, property held for investment). This discussion does not address all U.S. federal income tax consequences relevant to a non-U.S. holder's particular circumstances, including the impact of the unearned income Medicare contribution tax. In addition, this discussion does not address consequences relevant to non-U.S. holders subject to particular rules, including, without limitation:
If an entity or arrangement treated as a partnership for U.S. federal income tax purposes holds our common stock, the tax treatment of a partner in the partnership will depend on the status of the partner, the activities of the partnership and certain determinations made at the partner level.
149
Accordingly, partnerships holding our common stock and the partners in such partnerships should consult their own tax advisors regarding the U.S. federal income tax consequences to them.
THIS DISCUSSION IS FOR INFORMATION PURPOSES ONLY AND IS NOT INTENDED AS TAX ADVICE. INVESTORS SHOULD CONSULT THEIR OWN TAX ADVISORS WITH RESPECT TO THE APPLICATION OF THE U.S. FEDERAL INCOME TAX LAWS TO THEIR PARTICULAR SITUATIONS AS WELL AS ANY TAX CONSEQUENCES OF THE PURCHASE, OWNERSHIP AND DISPOSITION OF OUR COMMON STOCK ARISING UNDER THE U.S. FEDERAL ESTATE OR GIFT TAX LAWS OR UNDER THE LAWS OF ANY STATE, LOCAL OR NON-U.S. TAXING JURISDICTION OR UNDER ANY APPLICABLE INCOME TAX TREATY.
Definition of a Non-U.S. Holder
For purposes of this discussion, a "non-U.S. holder" is any beneficial owner of our common stock that is neither a "U.S. person" nor a partnership for U.S. federal income tax purposes. A U.S. person is any of the following:
Distributions
As described in the section captioned "Dividend Policy," we do not anticipate declaring or paying dividends to holders of our common stock in the foreseeable future.
If we do, however, pay distributions on our common stock, such distributions of cash or property on our common stock (other than certain pro rata distributions of our stock) generally will constitute dividends for U.S. federal income tax purposes to the extent paid from our current or accumulated earnings and profits, as determined under U.S. federal income tax principles. If a distribution exceeds our current and accumulated earnings and profits, the excess will constitute a return of capital and first be applied against and reduce a non-U.S. holder's adjusted tax basis in its common stock, but not below zero. Any remaining excess will be treated as capital gain and will be treated as described under the heading "—Sale or Other Taxable Disposition" below.
Subject to the discussion below on backup withholding and payments made to certain foreign accounts, dividends paid to a non-U.S. holder of our common stock that are not effectively connected with the non-U.S. holder's conduct of a trade or business within the United States will generally be subject to withholding of U.S. federal income tax at a rate of 30% of the gross amount of the dividends (or such lower rate as may be specified by an applicable income tax treaty). Non-U.S. holders may be entitled to a reduction in (under (a)) or an exemption from (under (a) or (b)) withholding on dividends as a result of either (a) qualifying for the benefits of an applicable income tax treaty or (b) the non-U.S. holder holding our common stock in connection with the conduct of a trade or business within the United States and dividends being paid in connection with that trade or business. To claim such a reduction in or exemption from withholding, the non-U.S. holder must provide the applicable
150
withholding agent with a properly executed (i) IRS Form W-8BEN or W-8BEN-E (or applicable successor form) claiming an exemption from or reduction of the withholding tax under the benefit of an applicable income tax treaty, (ii) IRS Form W-8ECI (or applicable successor form) stating that the dividends are effectively connected with the conduct by the non-U.S. holder of a trade or business within the United States, as may be applicable. These certifications must be provided to the applicable withholding agent prior to the payment of dividends and must be updated periodically. Non-U.S. holders that do not timely provide the applicable withholding agent with the required certification, but that qualify for a reduced rate or exemption under an applicable income tax treaty, may obtain a refund of any excess amounts withheld by timely filing an appropriate claim for refund with the IRS.
Subject to the discussion below on backup withholding and payments made to certain foreign accounts, if dividends paid to a non-U.S. holder are effectively connected with the non-U.S. holder's conduct of a trade or business within the United States (and, if required by an applicable income tax treaty, the non-U.S. holder maintains a permanent establishment in the United States to which such dividends are attributable), then, although exempt from withholding of U.S. federal income tax (provided the non-U.S. holder provides appropriate certification, as described above), the non-U.S. holder will be subject to U.S. federal income tax on such dividends on a net income basis at the regular graduated U.S. federal income tax rates. In addition, a non-U.S. holder that is or is treated as a corporation for U.S. federal income tax purposes may be subject to an additional branch profits tax at a rate of 30% (or such lower rate specified by an applicable income tax treaty) on its effectively connected earnings and profits for the taxable year that are attributable to such dividends, as adjusted for certain items. Non-U.S. holders should consult their own tax advisors regarding their entitlement to benefits under any applicable income tax treaty.
Sale or Other Taxable Disposition
Subject to the discussion below on backup withholding and payments made to certain foreign accounts, a non-U.S. holder will not be subject to U.S. federal income tax on any gain realized upon the sale or other taxable disposition of our common stock unless:
Gain described in the first bullet point above will generally be subject to U.S. federal income tax on a net income basis at the regular graduated U.S. federal income tax rates. A non-U.S. holder that is a foreign corporation also may be subject to an additional branch profits tax at a rate of 30% (or such lower rate specified by an applicable income tax treaty) on a portion of its effectively connected earnings and profits for the taxable year that are attributable to such gain, as adjusted for certain items.
A non-U.S. holder described in the second bullet point above will be subject to U.S. federal income tax at a rate of 30% (or such lower rate as may be specified by an applicable income tax treaty) on any gain derived from the sale or other taxable disposition, which may be offset by certain U.S. source capital losses of the non-U.S. holder (even though the individual is not considered a resident of
151
the United States), provided the non-U.S. holder timely files U.S. federal income tax returns with respect to such losses.
With respect to the third bullet point above, we believe we are not currently and do not anticipate becoming a USRPHC. Because the determination of whether we are a USRPHC depends on the fair market value of our USRPIs relative to the fair market value of our other business assets and our non-U.S. real property interests, however, there can be no assurance we are not a USRPHC or will not become one in the future. Even if we are or were to become a USRPHC, gain arising from the sale or other taxable disposition by a non-U.S. holder of our common stock will not be subject to U.S. federal income tax if our common stock is "regularly traded," as defined by applicable Treasury Regulations, on an established securities market, and such non-U.S. holder owned, actually or constructively, 5% or less of our common stock throughout the shorter of the five-year period ending on the date of the sale or other disposition or the non-U.S. holder's holding period for such stock.
Non-U.S. holders should consult their tax advisors regarding potentially applicable income tax treaties that may provide for different rules.
Backup Withholding and Information Reporting
Subject to the discussion below regarding payments made to certain foreign accounts, a non-U.S. holder generally will not be subject to backup withholding with respect to payments of dividends on our common stock we make to the non-U.S. holder, provided the applicable withholding agent does not have actual knowledge or reason to know such holder is a U.S. person and the holder certifies its non-U.S. status by providing a valid IRS Form W-8BEN, W-8BEN-E or W-8ECI, or other applicable certification (or applicable successor form), or otherwise establishes an exemption. However, information returns will be filed with the IRS in connection with any dividends on our common stock paid to the non-U.S. holder, regardless of whether any tax was actually withheld. Copies of these information returns may also be made available under the provisions of a specific treaty or agreement to the tax authorities of the country in which the non-U.S. holder resides or is established.
Information reporting and backup withholding may apply to the proceeds of a sale or other taxable disposition of our common stock within the United States, and information reporting may (although backup withholding generally will not) apply to the proceeds of a sale or other taxable disposition of our common stock outside the United States conducted through certain U.S.-related financial intermediaries, in each case, unless the beneficial owner certifies under penalty of perjury that it is a non-U.S. person on IRS Form W-8BEN, W8-BEN-E, W-8ECI or other applicable form or successor form (and the payer does not have actual knowledge or reason to know that the beneficial owner is a U.S. person) or otherwise establishes an exemption.
Backup withholding is not an additional tax. Any amounts withheld under the backup withholding rules may be allowed as a refund or a credit against a non-U.S. holder's U.S. federal income tax liability, provided the required information is timely furnished to the IRS.
Additional Withholding Tax on Payments Made to Foreign Accounts
Withholding taxes may be imposed under the provisions of the law generally known as the Foreign Account Tax Compliance Act, or FATCA, on certain types of payments made to non-U.S. financial institutions and certain other non-U.S. entities. Specifically, a 30% withholding tax may be imposed on dividends on, or gross proceeds from the sale or other disposition of, our common stock paid to a "foreign financial institution" or a "non-financial foreign entity" (each as defined in the Code), unless (i) the foreign financial institution undertakes certain diligence and reporting obligations, (ii) the non-financial foreign entity either certifies it does not have any "substantial U.S. owners" (as defined in the Code) or furnishes identifying information regarding each substantial U.S. owner, or (iii) the foreign financial institution or non-financial foreign entity otherwise qualifies for an exemption
152
from these rules. If the payee is a foreign financial institution and is subject to the diligence and reporting requirements in (i) above, it must enter into an agreement with the U.S. Department of the Treasury requiring, among other things, that it undertake to identify accounts held by certain "specified U.S. persons" or "U.S.-owned foreign entities" (each as defined in the Code), annually report certain information about such accounts and withhold 30% on payments to non-compliant foreign financial institutions and certain other account holders. An intergovernmental agreement between the United States and an applicable foreign country, or future Treasury Regulations or other guidance, may modify these requirements. Accordingly, the entity through which our common stock is held will affect the determination of whether such withholding is required.
Under the applicable Treasury Regulations and recent guidance from the IRS, withholding under FATCA generally applies to payments of dividends on our common stock, and will apply to payments of gross proceeds from the sale or other disposition of our common stock on or after January 1, 2019, and to certain "pass-thru" payments made on or after the later of January 1, 2019 and the date final Treasury Regulations are issued defining such pass-thru payments. The FATCA withholding tax will apply to all withholdable payments without regard to whether the beneficial owner of the payment would otherwise be entitled to an exemption from imposition of withholding tax pursuant to an applicable tax treaty with the United States or U.S. domestic law. We will not pay additional amounts to holders of our common stock in respect of any amounts withheld.
Prospective investors should consult their own tax advisors regarding the potential application of withholding under FATCA to their investment in our common stock.
153
Merrill Lynch, Pierce, Fenner & Smith Incorporated and Barclays Capital Inc. are acting as representatives of each of the underwriters named below. Subject to the terms and conditions set forth in an underwriting agreement among us and the underwriters, we have agreed to sell to the underwriters, and each of the underwriters has agreed, severally and not jointly, to purchase from us, the number of shares of common stock set forth opposite its name below.
| Underwriter |
Number of Shares |
|||
|---|---|---|---|---|
Merrill Lynch, Pierce, Fenner & Smith |
||||
Barclays Capital Inc. |
||||
Credit Suisse Securities (USA) LLC |
||||
UBS Securities LLC |
||||
Goldman, Sachs & Co. |
||||
Jefferies LLC |
||||
Piper Jaffray & Co. |
||||
Wells Fargo Securities, LLC |
||||
Houlihan Lokey Capital, Inc. |
||||
Total |
||||
Subject to the terms and conditions set forth in the underwriting agreement, the underwriters have agreed, severally and not jointly, to purchase all of the shares sold under the underwriting agreement if any of these shares are purchased. If an underwriter defaults, the underwriting agreement provides that the purchase commitments of the non-defaulting underwriters may be increased or the underwriting agreement may be terminated.
We have agreed to indemnify the several underwriters against certain liabilities, including liabilities under the Securities Act, or to contribute to payments the underwriters may be required to make in respect of those liabilities.
The underwriters are offering the shares, subject to prior sale, when, as and if issued to and accepted by them, subject to approval of legal matters by their counsel, including the validity of the shares, and other conditions contained in the underwriting agreement, such as the receipt by the underwriters of officer's certificates and legal opinions. The underwriters reserve the right to withdraw, cancel or modify offers to the public and to reject orders in whole or in part.
Commissions and Discounts
The representatives have advised us that the underwriters propose initially to offer the shares to the public at the public offering price set forth on the cover page of this prospectus and to dealers at that price less a concession not in excess of $ per share. After the initial offering, the public offering price, concession or any other term of the offering may be changed.
The following table shows the public offering price, underwriting discount and proceeds before expenses to us. The information assumes either no exercise or full exercise by the underwriters of their option to purchase additional shares.
| |
Per Share | Without Option | With Option | |||||||
|---|---|---|---|---|---|---|---|---|---|---|
Public offering price |
$ | $ | $ | |||||||
Underwriting discount |
$ | $ | $ | |||||||
Proceeds, before expenses, to us |
$ | $ |
$ |
|||||||
154
The expenses of the offering, not including the underwriting discount, are estimated at $ and are payable by us. We have agreed to reimburse the underwriters for all expenses in connection with the FINRA review of this offering in an amount up to $ . Such reimbursement is deemed to be underwriting compensation by FINRA.
The underwriters have agreed to reimburse the Company for certain expenses.
Option to Purchase Additional Shares
We have granted an option to the underwriters, exercisable for 30 days after the date of this prospectus, to purchase up to additional shares at the public offering price, less the underwriting discount. If the underwriters exercise this option, each will be obligated, subject to conditions contained in the underwriting agreement, to purchase a number of additional shares proportionate to that underwriter's initial amount reflected in the above table.
Reserved Shares
The underwriters have reserved up to shares of Class A common stock being offered by this prospectus for sale, at the initial public offering price, to our directors, officers, employees and other parties related to us. The sales will be made by Merrill Lynch, Pierce, Fenner & Smith Incorporated through a reserved share program. We do not know if these persons will elect to purchase all or any portion of these reserved shares, but any purchases they do make will reduce the number of shares available for sale to the general public. Any reserved shares not purchased will be offered by the underwriters to the general public on the same terms as the other shares of our Class A common stock.
No Sales of Similar Securities
We, our executive officers, directors and the holders of substantially all of our existing shares of Class A common stock have agreed not to sell or transfer any common stock or securities convertible into, exchangeable for, exercisable for, or repayable with common stock, for 180 days after the date of this prospectus without first obtaining the written consent of Merrill Lynch, Pierce, Fenner & Smith Incorporated and Barclays Capital Inc. Specifically, we and these other persons have agreed, with certain limited exceptions, including bona fide gifts, transfers by will or intestacy to a family member, charitable donations, transfers to a family trust, distributions to limited partners and transfers to affiliates, which in each case would be subject to the recipient signing a similar lock-up agreement, not to directly or indirectly:
This lock-up provision applies to common stock and to securities convertible into or exchangeable or exercisable for or repayable with common stock. It also applies to common stock owned now or acquired later by the person executing the agreement or for which the person executing
155
the agreement later acquires the power of disposition. We do not currently expect any release of shares subject to lock-up agreements.
Listing
We expect the shares to be approved for listing on the New York Stock Exchange under the symbol "FND".
Before this offering, there has been no public market for our common stock. The initial public offering price will be determined through negotiations between us and the representatives. In addition to prevailing market conditions, the factors to be considered in determining the initial public offering price are
An active trading market for the shares may not develop. It is also possible that after the offering the shares will not trade in the public market at or above the initial public offering price.
The underwriters do not expect to sell more than 5% of the shares in the aggregate to accounts over which they exercise discretionary authority.
Price Stabilization, Short Positions and Penalty Bids
Until the distribution of the shares is completed, SEC rules may limit underwriters and selling group members from bidding for and purchasing our common stock. However, the representatives may engage in transactions that stabilize the price of the common stock, such as bids or purchases to peg, fix or maintain that price.
In connection with the offering, the underwriters may purchase and sell our common stock in the open market. These transactions may include short sales, purchases on the open market to cover positions created by short sales and stabilizing transactions. Short sales involve the sale by the underwriters of a greater number of shares than they are required to purchase in the offering. "Covered" short sales are sales made in an amount not greater than the underwriters' option to purchase additional shares described above. The underwriters may close out any covered short position by either exercising their option to purchase additional shares or purchasing shares in the open market. In determining the source of shares to close out the covered short position, the underwriters will consider, among other things, the price of shares available for purchase in the open market as compared to the price at which they may purchase shares through the option granted to them. "Naked" short sales are sales in excess of such option. The underwriters must close out any naked short position by purchasing shares in the open market. A naked short position is more likely to be created if the underwriters are concerned that there may be downward pressure on the price of our common stock in the open market after pricing that could adversely affect investors who purchase in the offering. Stabilizing transactions consist of various bids for or purchases of shares of common stock made by the underwriters in the open market prior to the completion of the offering.
156
The underwriters may also impose a penalty bid. This occurs when a particular underwriter repays to the underwriters a portion of the underwriting discount received by it because the representatives have repurchased shares sold by or for the account of such underwriter in stabilizing or short covering transactions.
Similar to other purchase transactions, the underwriters' purchases to cover the syndicate short sales may have the effect of raising or maintaining the market price of our common stock or preventing or retarding a decline in the market price of our common stock. As a result, the price of our common stock may be higher than the price that might otherwise exist in the open market. The underwriters may conduct these transactions on the New York Stock Exchange, in the over-the-counter market or otherwise.
Neither we nor any of the underwriters make any representation or prediction as to the direction or magnitude of any effect that the transactions described above may have on the price of our common stock. In addition, neither we nor any of the underwriters make any representation that the representatives will engage in these transactions or that these transactions, once commenced, will not be discontinued without notice.
Electronic Distribution
In connection with the offering, certain of the underwriters or securities dealers may distribute prospectuses by electronic means, such as e-mail.
Other Relationships
The underwriters and their respective affiliates are full service financial institutions engaged in various activities, which may include sales and trading, commercial and investment banking, advisory, investment management, investment research, principal investment, hedging, market making, brokerage and other financial and non-financial activities and services. Certain of the underwriters and their respective affiliates have provided, and may in the future provide, a variety of these services to the issuer and to persons and entities with relationships with the issuer, for which they received or will receive customary fees, commissions and expenses. Specifically, Merrill Lynch, Pierce, Fenner & Smith Incorporated and an affiliate of Wells Fargo Securities, LLC served as joint lead arrangers and joint bookrunners and are lenders under the ABL Facility. An affiliate of Merrill Lynch, Pierce, Fenner & Smith Incorporated served as the syndication agent and an affiliate of Wells Fargo Securities, LLC served as administrative agent and collateral agent under the ABL Facility. In addition, affiliates of Merrill Lynch, Pierce, Fenner & Smith Incorporated, Barclays Capital Inc. and UBS Securities LLC served as joint lead arrangers and joint bookrunners under the Term Loan Facility. An affiliate of Jefferies LLC holds a portion of the Term Loan Facility.
In addition, in the ordinary course of their various business activities, the underwriters and their respective affiliates, officers, directors and employees may purchase, sell or hold a broad array of investments and actively traded securities, derivatives, loans, commodities, currencies, credit default swaps and other financial instruments for their own account and for the accounts of their customers, and such investment and trading activities may involve or relate to assets, securities and/or instruments of the issuer (directly, as collateral securing other obligations or otherwise) and/or persons and entities with relationships with the issuer. The underwriters and their respective affiliates may also communicate independent investment recommendations, market color or trading ideas and/or publish or express independent research views in respect of such assets, securities or instruments and may at any time hold, or recommend to clients that they should acquire, long and/or short positions in such assets, securities and instruments.
157
Notice to Prospective Investors in the European Economic Area
In relation to each Member State of the European Economic Area (each, a "Relevant Member State"), no offer of shares may be made to the public in that Relevant Member State other than:
provided that no such offer of shares shall require the Company or the representatives to publish a prospectus pursuant to Article 3 of the Prospectus Directive or supplement a prospectus pursuant to Article 16 of the Prospectus Directive.
Each person in a Relevant Member State who initially acquires any shares or to whom any offer is made will be deemed to have represented, acknowledged and agreed that it is a "qualified investor" within the meaning of the law in that Relevant Member State implementing Article 2(1)(e) of the Prospectus Directive. In the case of any shares being offered to a financial intermediary as that term is used in Article 3(2) of the Prospectus Directive, each such financial intermediary will be deemed to have represented, acknowledged and agreed that the shares acquired by it in the offer have not been acquired on a non-discretionary basis on behalf of, nor have they been acquired with a view to their offer or resale to, persons in circumstances which may give rise to an offer of any shares to the public other than their offer or resale in a Relevant Member State to qualified investors as so defined or in circumstances in which the prior consent of the representatives has been obtained to each such proposed offer or resale.
The Company, the representatives and their affiliates will rely upon the truth and accuracy of the foregoing representations, acknowledgements and agreements.
This prospectus has been prepared on the basis that any offer of shares in any Relevant Member State will be made pursuant to an exemption under the Prospectus Directive from the requirement to publish a prospectus for offers of shares. Accordingly any person making or intending to make an offer in that Relevant Member State of shares which are the subject of the offering contemplated in this prospectus may only do so in circumstances in which no obligation arises for the Company or any of the underwriters to publish a prospectus pursuant to Article 3 of the Prospectus Directive in relation to such offer. Neither the Company nor the underwriters have authorized, nor do they authorize, the making of any offer of shares in circumstances in which an obligation arises for the Company or the underwriters to publish a prospectus for such offer.
For the purpose of the above provisions, the expression "an offer to the public" in relation to any shares in any Relevant Member State means the communication in any form and by any means of sufficient information on the terms of the offer and the shares to be offered so as to enable an investor to decide to purchase or subscribe the shares, as the same may be varied in the Relevant Member State by any measure implementing the Prospectus Directive in the Relevant Member State and the expression "Prospectus Directive" means Directive 2003/71/EC (including the 2010 PD Amending Directive, to the extent implemented in the Relevant Member States) and includes any relevant implementing measure in the Relevant Member State and the expression "2010 PD Amending Directive" means Directive 2010/73/EU.
158
Notice to Prospective Investors in the United Kingdom
In addition, in the United Kingdom, this document is being distributed only to, and is directed only at, and any offer subsequently made may only be directed at persons who are "qualified investors" (as defined in the Prospectus Directive) (i) who have professional experience in matters relating to investments falling within Article 19 (5) of the Financial Services and Markets Act 2000 (Financial Promotion) Order 2005, as amended (the "Order") and/or (ii) who are high net worth companies (or persons to whom it may otherwise be lawfully communicated) falling within Article 49(2)(a) to (d) of the Order (all such persons together being referred to as "relevant persons"). This document must not be acted on or relied on in the United Kingdom by persons who are not relevant persons. In the United Kingdom, any investment or investment activity to which this document relates is only available to, and will be engaged in with, relevant persons.
Notice to Prospective Investors in Switzerland
The shares may not be publicly offered in Switzerland and will not be listed on the SIX Swiss Exchange ("SIX") or on any other stock exchange or regulated trading facility in Switzerland. This document has been prepared without regard to the disclosure standards for issuance prospectuses under art. 652a or art. 1156 of the Swiss Code of Obligations or the disclosure standards for listing prospectuses under art. 27 ff. of the SIX Listing Rules or the listing rules of any other stock exchange or regulated trading facility in Switzerland. Neither this document nor any other offering or marketing material relating to the shares or the offering may be publicly distributed or otherwise made publicly available in Switzerland.
Neither this document nor any other offering or marketing material relating to the offering, the Company, the shares have been or will be filed with or approved by any Swiss regulatory authority. In particular, this document will not be filed with, and the offer of shares will not be supervised by, the Swiss Financial Market Supervisory Authority FINMA ("FINMA"), and the offer of shares has not been and will not be authorized under the Swiss Federal Act on Collective Investment Schemes ("CISA"). The investor protection afforded to acquirers of interests in collective investment schemes under the CISA does not extend to acquirers of shares.
Notice to Prospective Investors in the Dubai International Financial Centre
This prospectus relates to an Exempt Offer in accordance with the Offered Securities Rules of the Dubai Financial Services Authority ("DFSA"). This prospectus is intended for distribution only to persons of a type specified in the Offered Securities Rules of the DFSA. It must not be delivered to, or relied on by, any other person. The DFSA has no responsibility for reviewing or verifying any documents in connection with Exempt Offers. The DFSA has not approved this prospectus nor taken steps to verify the information set forth herein and has no responsibility for the prospectus. The shares to which this prospectus relates may be illiquid and/or subject to restrictions on their resale. Prospective purchasers of the shares offered should conduct their own due diligence on the shares. If you do not understand the contents of this prospectus you should consult an authorized financial advisor.
Notice to Prospective Investors in Australia
No placement document, prospectus, product disclosure statement or other disclosure document has been lodged with the Australian Securities and Investments Commission ("ASIC"), in relation to the offering. This prospectus does not constitute a prospectus, product disclosure statement or other disclosure document under the Corporations Act 2001 (the "Corporations Act"), and does not purport to include the information required for a prospectus, product disclosure statement or other disclosure document under the Corporations Act.
159
Any offer in Australia of the shares may only be made to persons (the "Exempt Investors") who are "sophisticated investors" (within the meaning of section 708(8) of the Corporations Act), "professional investors" (within the meaning of section 708(11) of the Corporations Act) or otherwise pursuant to one or more exemptions contained in section 708 of the Corporations Act so that it is lawful to offer the shares without disclosure to investors under Chapter 6D of the Corporations Act.
The shares applied for by Exempt Investors in Australia must not be offered for sale in Australia in the period of 12 months after the date of allotment under the offering, except in circumstances where disclosure to investors under Chapter 6D of the Corporations Act would not be required pursuant to an exemption under section 708 of the Corporations Act or otherwise or where the offer is pursuant to a disclosure document which complies with Chapter 6D of the Corporations Act. Any person acquiring shares must observe such Australian on-sale restrictions.
This prospectus contains general information only and does not take account of the investment objectives, financial situation or particular needs of any particular person. It does not contain any securities recommendations or financial product advice. Before making an investment decision, investors need to consider whether the information in this prospectus is appropriate to their needs, objectives and circumstances, and, if necessary, seek expert advice on those matters.
Notice to Prospective Investors in Hong Kong
The securities have not been offered or sold and will not be offered or sold in Hong Kong, by means of any document, other than (a) to "professional investors" as defined in the Securities and Futures Ordinance (Cap. 571) of Hong Kong and any rules made under that Ordinance; or (b) in other circumstances which do not result in the document being a "prospectus" as defined in the Companies Ordinance (Cap. 32) of Hong Kong or which do not constitute an offer to the public within the meaning of that Ordinance. No advertisement, invitation or document relating to the securities has been or may be issued or has been or may be in the possession of any person for the purposes of issue, whether in Hong Kong or elsewhere, which is directed at, or the contents of which are likely to be accessed or read by, the public of Hong Kong (except if permitted to do so under the securities laws of Hong Kong) other than with respect to securities which are or are intended to be disposed of only to persons outside Hong Kong or only to "professional investors" as defined in the Securities and Futures Ordinance and any rules made under that Ordinance.
Notice to Prospective Investors in Japan
The securities have not been and will not be registered under the Financial Instruments and Exchange Law of Japan (Law No. 25 of 1948, as amended) and, accordingly, will not be offered or sold, directly or indirectly, in Japan, or for the benefit of any Japanese Person or to others for re-offering or resale, directly or indirectly, in Japan or to any Japanese Person, except in compliance with all applicable laws, regulations and ministerial guidelines promulgated by relevant Japanese governmental or regulatory authorities in effect at the relevant time. For the purposes of this paragraph, "Japanese Person" shall mean any person resident in Japan, including any corporation or other entity organized under the laws of Japan.
Notice to Prospective Investors in Singapore
This prospectus has not been registered as a prospectus with the Monetary Authority of Singapore. Accordingly, this prospectus and any other document or material in connection with the offer or sale, or invitation for subscription or purchase, of securities may not be circulated or distributed, nor may the securities be offered or sold, or be made the subject of an invitation for subscription or purchase, whether directly or indirectly, to persons in Singapore other than (i) to an institutional investor under Section 274 of the Securities and Futures Act, Chapter 289 of Singapore
160
(the "SFA"), (ii) to a relevant person pursuant to Section 275(1), or any person pursuant to Section 275(1A), and in accordance with the conditions specified in Section 275, of the SFA, or (iii) otherwise pursuant to, and in accordance with the conditions of, any other applicable provision of the SFA.
Where the securities are subscribed or purchased under Section 275 of the SFA by a relevant person which is:
securities (as defined in Section 239(1) of the SFA) of that corporation or the beneficiaries' rights and interest (howsoever described) in that trust shall not be transferred within six months after that corporation or that trust has acquired the securities pursuant to an offer made under Section 275 of the SFA except:
Notice to Prospective Investors in Canada
The shares may be sold only to purchasers purchasing, or deemed to be purchasing, as principal that are accredited investors, as defined in National Instrument 45-106 Prospectus Exemptions or subsection 73.3(1) of the Securities Act (Ontario), and are permitted clients, as defined in National Instrument 31-103 Registration Requirements, Exemptions and Ongoing Registrant Obligations. Any resale of the shares must be made in accordance with an exemption from, or in a transaction not subject to, the prospectus requirements of applicable securities laws.
Securities legislation in certain provinces or territories of Canada may provide a purchaser with remedies for rescission or damages if this prospectus (including any amendment thereto) contains a misrepresentation, provided that the remedies for rescission or damages are exercised by the purchaser within the time limit prescribed by the securities legislation of the purchaser's province or territory. The purchaser should refer to any applicable provisions of the securities legislation of the purchaser's province or territory for particulars of these rights or consult with a legal advisor.
Pursuant to section 3A.3 (or, in the case of securities issued or guaranteed by the government of a non-Canadian jurisdiction, section 3A.4) of National Instrument 33-105 Underwriting Conflicts (NI 33-105), the underwriters are not required to comply with the disclosure requirements of NI 33-105 regarding underwriter conflicts of interest in connection with this offering.
161
The validity of the shares of Class A common stock offered hereby will be passed upon for us by Proskauer Rose LLP. The underwriters are being represented by Latham & Watkins LLP in connection with the offering.
The consolidated financial statements and financial schedule of Floor & Decor Holdings, Inc. and its subsidiaries as of December 31, 2015 and December 29, 2016 and for each of the fiscal years ended on December 25, 2014, December 31, 2015 and December 29, 2016 included in this registration statement and prospectus have been audited by Ernst & Young LLP, an independent registered public accounting firm, and are included in reliance on their report given on their authority as experts in accounting and auditing.
WHERE YOU CAN FIND ADDITIONAL INFORMATION
We have filed with the SEC a registration statement on Form S-1 under the Securities Act with respect to this offering of our Class A common stock. This prospectus, which constitutes a part of the registration statement, does not contain all of the information set forth in the registration statement, some items of which are contained in exhibits to the registration statement filed therewith, certain portions of which are omitted as permitted by the rules and regulations of the SEC. For further information with respect to us and our common stock, we refer you to the registration statement, including the exhibits and the financial statements and notes filed as a part of the registration statement. Statements contained in this prospectus concerning the contents of any contract or any other document are not necessarily complete. If a contract or document has been filed as an exhibit to the registration statement, please see the copy of the contract or document that has been filed. Each statement in this prospectus relating to a contract or document filed as an exhibit is qualified in all respects by the filed exhibit. The exhibits to the registration statement should be referenced for the complete contents of these contracts and documents. A copy of the registration statement and the exhibits filed therewith may be inspected without charge at the public reference room of the SEC, located at 100 F Street, N.E., Room 1580, Washington, D.C. 20549. You may obtain information on the operation of the public reference rooms by calling the SEC at 1-800-SEC-0330. The SEC also maintains an Internet website that contains reports, proxy statements, and other information about issuers, like us, that file electronically with the SEC. The address of that website is www.sec.gov.
As a result of this offering, we will become subject to the information and reporting requirements of the Exchange Act and, in accordance with this law, will file periodic reports, proxy statements and other information with the SEC. These periodic reports, proxy statements and other information will be available for inspection and copying at the SEC's public reference facilities and website referred to above. We also maintain a website at www.FloorandDecor.com. After the closing of this offering, you may access our annual reports on Form 10-K, quarterly reports on Form 10-Q, current reports on Form 8-K, and amendments to those reports filed or furnished pursuant to Section 13(a) or 15(d) of the Exchange Act with the SEC free of charge at our website as soon as reasonably practicable after such material is electronically filed with, or furnished to, the SEC. The information contained in, or that can be accessed through, our website is not part of this prospectus.
162
Index to Consolidated Financial Statements
Report of Registered Public Accounting Firm |
F-2 | |||
Consolidated Financial Statements |
||||
For the Years Ended December 29, 2016, December 31, 2015 and December 25, 2014 |
||||
Consolidated Balance Sheets |
F-3 | |||
Consolidated Statements of Income |
F-4 | |||
Consolidated Statements of Comprehensive Income |
F-5 | |||
Consolidated Statements of Stockholders' Equity |
F-6 | |||
Consolidated Statements of Cash Flows |
F-7 | |||
Notes to Consolidated Financial Statements |
F-8 | |||
Schedule I—Condensed Financial Information of Registrant |
F-34 | |||
Condensed Consolidated Financial Statements |
F-1
Report of Independent Registered Public Accounting Firm
The
Board of Directors and Stockholders of
FDO Holdings, Inc. and Subsidiaries
We have audited the accompanying consolidated balance sheets of FDO Holdings, Inc. and Subsidiaries (the Company) as of December 29, 2016 and December 31, 2015, and the related consolidated statements of income, comprehensive income, stockholders' equity and cash flows for each of the three years in the period ended December 29, 2016. Our audits also included the financial statement schedule listed in the Index at F-1. These financial statements and schedule are the responsibility of the Company's management. Our responsibility is to express an opinion on these financial statements and schedule based on our audits.
We conducted our audits in accordance with the standards of the Public Company Accounting Oversight Board (United States). Those standards require that we plan and perform the audit to obtain reasonable assurance about whether the financial statements are free of material misstatement. We were not engaged to perform an audit of the Company's internal control over financial reporting. Our audits included consideration of internal control over financial reporting as a basis for designing audit procedures that are appropriate in the circumstances, but not for the purpose of expressing an opinion on the effectiveness of the Company's internal control over financial reporting. Accordingly, we express no such opinion. An audit also includes examining, on a test basis, evidence supporting the amounts and disclosures in the financial statements, assessing the accounting principles used and significant estimates made by management, and evaluating the overall financial statement presentation. We believe that our audits provide a reasonable basis for our opinion.
In our opinion, the financial statements referred to above present fairly, in all material respects, the consolidated financial position of FDO Holdings, Inc. and Subsidiaries at December 29, 2016 and December 31, 2015, and the consolidated results of their operations and their cash flows for each of the three years in the period ended December 29, 2016, in conformity with U.S. generally accepted accounting principles. Also, in our opinion, the related financial statement schedule, when considered in relation to the basic financial statements taken as a whole, presents fairly in all material respects the information set forth therein.
/s/ Ernst & Young LLP
Atlanta, GA
March 20, 2017
F-2
FDO Holdings, Inc. and Subsidiaries
Consolidated Balance Sheets
(In Thousands, Except Share and Per Share Data)
| |
As of December 31, 2015 |
As of December 29, 2016 |
|||||
|---|---|---|---|---|---|---|---|
Assets |
|||||||
Current assets: |
|||||||
Cash and cash equivalents |
$ | 318 | $ | 451 | |||
Income taxes receivable |
2,484 | — | |||||
Receivables, net |
23,740 | 34,533 | |||||
Inventories, net |
272,569 | 293,702 | |||||
Prepaid expenses and other current assets |
6,079 | 7,529 | |||||
| | | | | | | | |
Total current assets |
305,190 | 336,215 | |||||
Fixed assets, net |
102,983 | 150,471 | |||||
Intangible assets, net |
109,426 | 109,394 | |||||
Goodwill |
227,447 | 227,447 | |||||
Other assets |
3,842 | 7,639 | |||||
| | | | | | | | |
Total long-term assets |
443,698 | 494,951 | |||||
| | | | | | | | |
Total assets |
$ | 748,888 | $ | 831,166 | |||
| | | | | | | | |
| | | | | | | | |
| | | | | | | | |
Liabilities and stockholders' equity |
|||||||
Current liabilities: |
|||||||
Current portion of term loans |
$ | 1,267 | $ | 3,500 | |||
Trade accounts payable |
147,321 | 158,466 | |||||
Accrued expenses |
35,841 | 61,505 | |||||
Income taxes payable |
— | 5,787 | |||||
Deferred revenue |
12,145 | 14,456 | |||||
| | | | | | | | |
Total current liabilities |
196,574 | 243,714 | |||||
Term loans |
83,423 | 337,243 | |||||
Revolving line of credit |
92,900 | 50,000 | |||||
Deferred rent |
13,074 | 16,750 | |||||
Deferred income tax liabilities, net |
33,724 | 28,265 | |||||
Tenant improvement allowances |
16,346 | 20,319 | |||||
Other liabilities |
482 | 592 | |||||
| | | | | | | | |
Total long-term liabilities |
239,949 | 453,169 | |||||
| | | | | | | | |
Total liabilities |
436,523 | 696,883 | |||||
| | | | | | | | |
Commitments and contingencies |
|||||||
Stockholders' equity |
|||||||
Preferred stock, $0.001 par value; 100,000 shares authorized; 0 shares issued and outstanding at December 29, 2016 and December 31, 2015 |
— | — | |||||
Common stock Class A, $0.001 par value; 500,000 shares authorized; 238,789 shares issued and outstanding at December 29, 2016 and December 31, 2015 |
— | — | |||||
Common stock Class B, $0.001 par value; 100,000 shares authorized; 1,230 shares issued and outstanding at December 29, 2016; 779 shares issued and outstanding at December 31, 2015 |
— | — | |||||
Common stock Class C, $0.001 par value; 500,000 shares authorized; 19,500 shares issued and outstanding at December 29, 2016 and December 31, 2015 |
— | — | |||||
Additional paid-in capital |
264,371 | 117,353 | |||||
Accumulated other comprehensive income (loss), net |
(100 | ) | 176 | ||||
Retained earnings |
48,094 | 16,754 | |||||
| | | | | | | | |
Total stockholders' equity |
312,365 | 134,283 | |||||
| | | | | | | | |
Total liabilities and stockholders' equity |
$ | 748,888 | 831,166 | ||||
| | | | | | | | |
| | | | | | | | |
| | | | | | | | |
See accompanying notes to consolidated financial statements.
F-3
FDO Holdings, Inc. and Subsidiaries
Consolidated Statements of Income
(In Thousands, Except Per Share Data)
| |
Year Ended December 25, 2014 |
Year Ended December 31, 2015(1) |
Year Ended December 29, 2016 |
|||||||
|---|---|---|---|---|---|---|---|---|---|---|
Net sales |
$ | 584,588 | $ | 784,012 | $ | 1,050,759 | ||||
Cost of sales |
355,051 | 471,390 | 621,497 | |||||||
| | | | | | | | | | | |
Gross profit |
229,537 | 312,622 | 429,262 | |||||||
Operating expenses: |
||||||||||
Selling and store operating |
146,485 | 202,637 | 271,876 | |||||||
General and administrative |
38,984 | 49,917 | 64,025 | |||||||
Pre-opening |
7,412 | 7,380 | 13,732 | |||||||
Litigation settlement |
— | — | 10,500 | |||||||
Executive severance |
2,975 | 296 | — | |||||||
| | | | | | | | | | | |
Total operating expenses |
195,856 | 260,230 | 360,133 | |||||||
| | | | | | | | | | | |
Operating income |
33,681 | 52,392 | 69,129 | |||||||
Interest expense |
8,949 | 9,386 | 12,803 | |||||||
Loss on early extinguishment of debt |
— | — | 1,813 | |||||||
| | | | | | | | | | | |
Income before income taxes |
24,732 | 43,006 | 54,513 | |||||||
Provision for income taxes |
9,634 | 16,199 | 11,474 | |||||||
| | | | | | | | | | | |
Net income |
$ | 15,098 | $ | 26,807 | $ | 43,039 | ||||
| | | | | | | | | | | |
| | | | | | | | | | | |
| | | | | | | | | | | |
Basic earnings per share |
$ | 58.38 | $ | 103.48 | $ | 166.01 | ||||
Diluted earnings per share |
$ | 56.73 | $ | 99.99 | $ | 156.63 | ||||
Basic earnings per share pro forma for dividend |
$ | |||||||||
Diluted earnings per share pro forma for dividend |
$ | |||||||||
See accompanying notes to consolidated financial statements.
F-4
FDO Holdings, Inc. and Subsidiaries
Consolidated Statements of Comprehensive Income
(In Thousands)
| |
Year Ended December 25, 2014 |
Year Ended December 31, 2015(1) |
Year Ended December 29, 2016 |
|||||||
|---|---|---|---|---|---|---|---|---|---|---|
Net income |
$ | 15,098 | $ | 26,807 | $ | 43,039 | ||||
Other comprehensive gain—change in fair value of hedge instruments, net of tax |
14 | 43 | 276 | |||||||
| | | | | | | | | | | |
Total comprehensive income |
$ | 15,112 | $ | 26,850 | $ | 43,315 | ||||
| | | | | | | | | | | |
| | | | | | | | | | | |
| | | | | | | | | | | |
See accompanying notes to consolidated financial statements.
F-5
FDO Holdings, Inc. and Subsidiaries
Consolidated Statements of Stockholders' Equity
(In Thousands, Except Share Data)
| |
|
|
Common stock class A |
Common stock class B |
Common stock class C |
|
Accumulated other comprehensive income (loss), net |
|
|
||||||||||||||||||||||||||||
|---|---|---|---|---|---|---|---|---|---|---|---|---|---|---|---|---|---|---|---|---|---|---|---|---|---|---|---|---|---|---|---|---|---|---|---|---|---|
| |
Preferred stock | |
|
|
|||||||||||||||||||||||||||||||||
| |
Additional paid-in capital |
Retained earnings |
Total stockholders' equity |
||||||||||||||||||||||||||||||||||
| |
Shares | Amount | Shares | Amount | Shares | Amount | Shares | Amount | |||||||||||||||||||||||||||||
Balance, December 26, 2013 |
— | $ | — | 238,789 | $ | — | 31 | $ | — | 19,500 | $ | — | $ | 258,100 | $ | (157 | ) | $ | 6,189 | $ | 264,132 | ||||||||||||||||
Stock based compensation expense |
— | — | — | — | — | — | — | — | 2,323 | — | — | 2,323 | |||||||||||||||||||||||||
Exercise of stock options |
— | — | — | — | 625 | — | — | — | 658 | — | — | 658 | |||||||||||||||||||||||||
Excess tax benefit from employee stock options |
— | — | — | — | — | — | — | — | 11 | — | — | 11 | |||||||||||||||||||||||||
Other comprehensive gain, net of tax |
— | — | — | — | — | — | — | — | — | 14 | — | 14 | |||||||||||||||||||||||||
Net income |
— | — | — | — | — | — | — | — | — | — | 15,098 | 15,098 | |||||||||||||||||||||||||
| | | | | | | | | | | | | | | | | | | | | | | | | | | | | | | | | | | | | | |
Balance, December 25, 2014 |
— | — | 238,789 | — | 656 | — | 19,500 | — | 261,092 | (143 | ) | 21,287 | 282,236 | ||||||||||||||||||||||||
Stock based compensation expense |
— | — | — | — | 107 | — | — | — | 3,258 | — | — | 3,258 | |||||||||||||||||||||||||
Exercise of stock options |
— | — | — | — | 16 | — | — | — | 40 | — | — | 40 | |||||||||||||||||||||||||
Tax deficiency from employee stock options |
— | — | — | — | — | — | — | — | (19 | ) | — | — | (19 | ) | |||||||||||||||||||||||
Other comprehensive gain, net of tax |
— | — | — | — | — | — | — | — | — | 43 | — | 43 | |||||||||||||||||||||||||
Net income |
— | — | — | — | — | — | — | — | — | — | 26,807 | 26,807 | |||||||||||||||||||||||||
| | | | | | | | | | | | | | | | | | | | | | | | | | | | | | | | | | | | | | |
Balance, December 31, 2015 |
— | — | 238,789 | — | 779 | — | 19,500 | — | 264,371 | (100 | ) | 48,094 | 312,365 | ||||||||||||||||||||||||
Stock based compensation expense |
— | — | — | — | — | — | — | — | 3,182 | — | 47 | 3,229 | |||||||||||||||||||||||||
Exercise of stock options |
— | — | — | — | 451 | — | — | — | 284 | — | — | 284 | |||||||||||||||||||||||||
Other comprehensive gain, net of tax |
— | — | — | — | — | — | — | — | — | 276 | — | 276 | |||||||||||||||||||||||||
Dividend declared |
— | — | — | — | — | — | — | — | (150,722 | ) | — | (74,278 | ) | (225,000 | ) | ||||||||||||||||||||||
Cumulative effect from adoption of ASU No. 2016-09 |
— | — | — | — | — | — | — | — | 238 | — | (148 | ) | 90 | ||||||||||||||||||||||||
Net income |
— | — | — | — | — | — | — | — | — | — | 43,039 | 43,039 | |||||||||||||||||||||||||
| | | | | | | | | | | | | | | | | | | | | | | | | | | | | | | | | | | | | | |
Balance, December 29, 2016 |
— | $ | — | 238,789 | $ | — | 1,230 | $ | — | 19,500 | $ | — | $ | 117,353 | $ | 176 | $ | 16,754 | $ | 134,283 | |||||||||||||||||
| | | | | | | | | | | | | | | | | | | | | | | | | | | | | | | | | | | | | | |
| | | | | | | | | | | | | | | | | | | | | | | | | | | | | | | | | | | | | | |
| | | | | | | | | | | | | | | | | | | | | | | | | | | | | | | | | | | | | | |
See accompanying notes to consolidated financial statements.
F-6
FDO Holdings, Inc. and Subsidiaries
Consolidated Statements of Cash Flows
(In Thousands)
| |
Year Ended December 25, 2014 |
Year Ended December 31, 2015(1) |
Year Ended December 29, 2016 |
|||||||
|---|---|---|---|---|---|---|---|---|---|---|
Operating activities |
||||||||||
Net income |
$ | 15,098 | $ | 26,807 | $ | 43,039 | ||||
Adjustments to reconcile net income to net cash provided by operating activities: |
||||||||||
Depreciation and amortization |
13,704 | 19,684 | 28,604 | |||||||
Loss on early extinguishment of debt |
— | — | 1,813 | |||||||
Loss on asset disposals |
148 | 144 | 451 | |||||||
Amortization of tenant improvement allowances |
(1,896 | ) | (2,197 | ) | (2,561 | ) | ||||
Deferred income taxes |
(1,426 | ) | 464 | (5,536 | ) | |||||
Stock based compensation expense |
2,323 | 3,258 | 3,229 | |||||||
Changes in operating assets and liabilities: |
||||||||||
Receivables, net |
(7,761 | ) | (7,997 | ) | (10,793 | ) | ||||
Inventories, net |
(45,985 | ) | (70,988 | ) | (21,133 | ) | ||||
Other assets |
(2,069 | ) | (2,520 | ) | (4,817 | ) | ||||
Trade accounts payable |
47,780 | 40,454 | 11,145 | |||||||
Accrued expenses |
7,488 | 4,908 | 27,244 | |||||||
Income taxes |
6,223 | (4,805 | ) | 8,271 | ||||||
Deferred revenue |
2,023 | 4,997 | 2,311 | |||||||
Deferred rent |
2,507 | 3,327 | 3,870 | |||||||
Tenant improvement allowances |
5,660 | 4,816 | 4,244 | |||||||
Other |
(223 | ) | 28 | 75 | ||||||
| | | | | | | | | | | |
Net cash provided by operating activities |
43,594 | 20,380 | 89,456 | |||||||
Investing activities |
||||||||||
Purchases of fixed assets |
(39,069 | ) | (45,037 | ) | (74,648 | ) | ||||
Other |
— | 16 | — | |||||||
| | | | | | | | | | | |
Net cash used in investing activities |
(39,069 | ) | (45,021 | ) | (74,648 | ) | ||||
Financing activities |
||||||||||
Borrowings on revolving line of credit |
119,700 |
204,300 |
171,850 |
|||||||
Payments on revolving line of credit |
(123,400 | ) | (177,900 | ) | (214,750 | ) | ||||
Proceeds from term loans |
— | — | 362,000 | |||||||
Payments on term loans |
(1,467 | ) | (1,667 | ) | (98,334 | ) | ||||
Prepayment penalty on term loan extinguishment |
— | — | (179 | ) | ||||||
Debt issuance costs |
(208 | ) | (93 | ) | (10,546 | ) | ||||
Cash dividends |
— | — | (225,000 | ) | ||||||
Proceeds from exercise of stock options |
658 | 40 | 284 | |||||||
Excess tax benefit from exercise of stock options |
296 | — | — | |||||||
| | | | | | | | | | | |
Net cash (used in) provided by financing activities |
(4,421 | ) | 24,680 | $ | (14,675 | ) | ||||
| | | | | | | | | | | |
Net increase in cash and cash equivalents |
104 | 39 | 133 | |||||||
Cash and cash equivalents, beginning of the year |
175 | 279 | 318 | |||||||
| | | | | | | | | | | |
Cash and cash equivalents, end of the year |
$ | 279 | $ | 318 | $ | 451 | ||||
| | | | | | | | | | | |
| | | | | | | | | | | |
| | | | | | | | | | | |
Supplemental disclosures of cash flow information |
||||||||||
Cash paid for interest |
$ | 7,903 | $ | 8,898 | $ | 6,922 | ||||
| | | | | | | | | | | |
| | | | | | | | | | | |
| | | | | | | | | | | |
Cash paid for income taxes |
$ | 4,778 | $ | 20,182 | $ | 8,929 | ||||
| | | | | | | | | | | |
| | | | | | | | | | | |
| | | | | | | | | | | |
Fixed assets accrued at the end of the year |
$ | 3,343 | $ | 7,002 | $ | 5,387 | ||||
| | | | | | | | | | | |
| | | | | | | | | | | |
| | | | | | | | | | | |
Fixed assets acquired as part of lease—paid for by lessor |
$ | — | $ | — | $ | 2,290 | ||||
| | | | | | | | | | | |
| | | | | | | | | | | |
| | | | | | | | | | | |
See accompanying notes to consolidated financial statements.
F-7
FDO Holdings, Inc. and Subsidiaries
Notes to Consolidated Financial Statements
December 29, 2016
1. Summary of Significant Accounting Policies
Nature of Business
FDO Holdings, Inc., together with its subsidiaries (the "Company," "we," "our," or "us"), is a highly differentiated, rapidly growing specialty retailer of hard surface flooring and related accessories. We offer a broad in-stock assortment of tile, wood, laminate, and natural stone flooring along with decorative and installation accessories at everyday low prices. Our stores appeal to a variety of customers, including professional installers and commercial businesses, Do it Yourself customers and customers who buy the products for professional installation. We operate within one reportable segment.
As of December 29, 2016, the Company, through its wholly owned subsidiary, operates 69 warehouse-format stores, which average 72,000 square feet, and one small-format standalone design center in 17 states including Arizona, California, Colorado, Florida, Georgia, Illinois, Louisiana, Maryland, Nevada, New Jersey, North Carolina, Ohio, Pennsylvania, Tennessee, Texas, Virginia, and Utah, four distribution centers and an e-commerce site, FloorandDecor.com.
Fiscal Year
The Company's fiscal year is the 52- or 53-week period ending on the Thursday on or preceding December 31st. Fiscal years ended December 29, 2016 ("fiscal 2016") and December 25, 2014 ("fiscal 2014") include 52 weeks. Fiscal year ended December 31, 2015 ("fiscal 2015") includes 53 weeks.
Basis of Presentation
The accompanying consolidated financial statements have been prepared in accordance with accounting principles generally accepted in the United States ("GAAP"). The consolidated financial statements include the accounts of the Company and its wholly owned subsidiaries. Certain prior-year amounts have been reclassified in the consolidated financial statements to conform to the current year presentation.
The Company has evaluated subsequent events through March 20, 2017, which represents the date on which the financial statements were available for distribution.
Cash and Cash Equivalents
Cash consists of currency and demand deposits with banks.
Receivables
Receivables consist primarily of amounts due from credit card companies, receivables from vendors and tenant improvement allowances owed by landlords. The Company typically collects its credit card receivables within three to five business days of the underlying sale to the customer. The Company has agreements with a majority of its large merchandise vendors that allow for specified rebates based on purchasing volume. Generally, these agreements are on an annual basis, and the Company collects the rebates subsequent to its fiscal year end. Additionally, the Company has agreements with substantially all vendors that allow for the return of certain merchandise throughout
F-8
FDO Holdings, Inc. and Subsidiaries
Notes to Consolidated Financial Statements (Continued)
December 29, 2016
1. Summary of Significant Accounting Policies (Continued)
the normal course of business. When inventory is identified to return to a vendor, it is removed from inventory and recorded as a receivable on the Consolidated Balance Sheet, and any variance between capitalized inventory cost associated with the return and the expected vendor reimbursement is expensed in Cost of sales in the Consolidated Statement of Income when the inventory is identified to be returned to the vendor. The Company reserves for estimated uncollected receivables based on historical trends, which historically have been immaterial. The allowance for doubtful accounts as of December 29, 2016 and December 31, 2015, was $188 thousand and $133 thousand, respectively.
Credit Program
Credit is offered to the Company's customers through a proprietary credit card underwritten by third-party financial institutions and at no recourse to the Company.
Inventory Valuation and Shrinkage
Inventories consist of merchandise held for sale and are stated at the lower of cost and net realizable value. When evidence exists that the net realizable value of inventory is lower than its cost, the difference is recorded in cost of sales in the consolidated statement of income as a loss in the period in which it occurs. The Company determines inventory costs using the weighted average cost method. The Company capitalizes transportation, duties and other costs to get product to its retail locations. The Company records reserves for estimated losses related to shrinkage and other amounts that are otherwise not expected to be fully recoverable. These reserves are calculated based on historical shrinkage, selling price, margin and current business trends. The estimates have calculations that require management to make assumptions based on the current rate of sales, age, salability and profitability of inventory, historical percentages that can be affected by changes in the Company's merchandising mix, customer preferences, and changes in actual shrinkage trends. These reserves totaled $2,449 thousand and $2,476 thousand as of December 29, 2016 and December 31, 2015, respectively.
Physical inventory counts and cycle counts are performed on a regular basis in each store and distribution center to ensure that amounts reflected in the accompanying Consolidated Balance Sheet are properly stated. During the period between physical inventory counts in our stores, the Company accrues for estimated losses related to shrinkage on a store-by-store basis. Shrinkage is the difference between the recorded amount of inventory and the physical inventory. Shrinkage may occur due to theft, loss, or inaccurate records for the receipt of inventory, among other things.
Fixed Assets
Fixed assets consist primarily of furniture, fixtures and equipment, leasehold improvements (including those that are reimbursed by landlords as a tenant improvement allowances) and computer software and hardware. Fixed assets are stated at cost less accumulated depreciation utilizing the straight-line method over the assets' estimated useful lives.
Leasehold improvements are amortized using the straight-line method over the shorter of (i) the original term of the lease, (ii) renewal term of the lease if the renewal is reasonably expected or
F-9
FDO Holdings, Inc. and Subsidiaries
Notes to Consolidated Financial Statements (Continued)
December 29, 2016
1. Summary of Significant Accounting Policies (Continued)
(iii) the useful life of the improvement. The Company's fixed assets are depreciated using the following estimated useful lives:
| |
Life | |
|---|---|---|
Furniture, fixtures and equipment |
2 - 7 years | |
Leasehold improvements |
10 - 25 years | |
Computer software and hardware |
3 - 7 years |
The cost and related accumulated depreciation of assets sold or otherwise disposed are removed from the accounts, and the related gain or loss is reported in the Consolidated Statements of Income.
Capitalized Software Costs
The Company capitalizes certain costs related to the acquisition and development of software and amortizes these costs using the straight-line method over the estimated useful life of the software. Certain development costs not meeting the criteria for capitalization are expensed as incurred.
Goodwill and Other Indefinite-Lived Intangible Assets
In accordance with the Financial Accounting Standards Board ("FASB") Accounting Standards Codification ("ASC 350"), Intangibles—Goodwill and Other, goodwill and other intangible assets with indefinite lives resulting from business combinations are not amortized but instead are tested for impairment at least annually (more frequently if certain indicators are present) while identifiable intangible assets with finite lives are amortized over their estimated useful lives. The Company obtains independent third-party valuation studies to assist it with determining the fair value of goodwill and indefinite-lived intangible assets. The Company's goodwill and other indefinite-lived intangible assets subject to impairment testing arose primarily as a result of its acquisition of Floor and Decor Outlets of America, Inc. in November 2010.
The Company performs a two-step quantitative impairment test on goodwill. In the first step, the Company compares the fair value of the reporting unit to its carrying value. If the fair value of the reporting unit exceeds the carrying value of the net assets assigned to that unit, goodwill is considered not impaired, and the Company is not required to perform further testing. If the carrying value of the net assets assigned to the reporting unit exceeds the fair value of the reporting unit, then the Company must perform the second step of the impairment test in order to determine the implied fair value of the reporting unit's goodwill. If the carrying value of a reporting unit's goodwill exceeds its implied fair value, then the Company would record an impairment loss equal to the difference.
The Company estimates the fair value of our reporting unit using a weighted combination of the income approach and the market approach. The income approach utilizes a discounted cash flow model incorporating management's expectations for future revenue, operating expenses, earnings before interest, taxes, depreciation and amortization, working capital and capital expenditures. The Company discounts the related cash flow forecasts using its estimated weighted-average cost of capital at the date of valuation. The market approach utilizes comparative market multiples derived by relating the value of guideline companies in the Company's industry and/or with similar growth prospects, based on either
F-10
FDO Holdings, Inc. and Subsidiaries
Notes to Consolidated Financial Statements (Continued)
December 29, 2016
1. Summary of Significant Accounting Policies (Continued)
the market price of publicly traded shares or the prices of companies being acquired in the marketplace, to various measures of their earnings. Such multiples are then applied to the Company's historical and projected earnings to derive a valuation estimate.
Based on the goodwill impairment analysis performed quantitatively on October 25, 2016, the Company determined that the fair value of its reporting unit is in excess of the carrying value. No events or changes in circumstances have occurred since the date of the Company's most recent annual impairment test that would more likely than not reduce the fair value of the reporting unit below its carrying amount.
The Company annually (or more frequently if there are indicators of impairment) evaluates whether indefinite-lived assets continue to have an indefinite life or have impaired carrying values due to changes in the asset(s) or their related risks. The impairment review is performed by comparing the carrying value of the indefinite lived intangible asset to its estimated fair value, determined using a discounted cash flow methodology. If the recorded carrying value of the indefinite-lived asset exceeds its estimated fair value, an impairment charge is recorded to write the asset down to its estimated fair value.
The estimated lives of the Company's intangible assets are as follows:
| |
Useful Life | |
|---|---|---|
Trade names |
Indefinite | |
Vendor relationships |
10 years |
The Company's goodwill and other indefinite-lived intangible assets impairment loss calculations contain uncertainties because they require management to make significant judgments in estimating the fair value of the Company's reporting unit and indefinite-lived intangible assets, including the projection of future cash flows, assumptions about which market participants are the most comparable, the selection of discount rates and the weighting of the income and market approaches. These calculations contain uncertainties because they require management to make assumptions such as estimating economic factors and the profitability of future business operations and, if necessary, the fair value of the reporting unit's assets and liabilities among others. Further, the Company's ability to realize the future cash flows used in its fair value calculations is affected by factors such as changes in economic conditions, changes in the Company's operating performance and changes in the Company's business strategies. Significant changes in any of the assumptions involved in calculating these estimates could affect the estimated fair value of one or more of the Company's reporting unit and indefinite-lived intangible assets and could result in impairment charges in a future period.
Long-Lived Assets
Long-lived assets, such as fixed assets and intangible assets with finite lives, are reviewed for impairment whenever events or changes in circumstances indicate that the carrying amount of an asset may not be recoverable. Conditions that may indicate impairment include, but are not limited to, a significant adverse change in customer demand or business climate that could affect the value of an asset, a product recall or an adverse action by a regulator. If the sum of the estimated undiscounted future cash flows related to the asset is less than the asset's carrying value, the Company recognizes a
F-11
FDO Holdings, Inc. and Subsidiaries
Notes to Consolidated Financial Statements (Continued)
December 29, 2016
1. Summary of Significant Accounting Policies (Continued)
loss equal to the difference between the carrying value and the fair value, usually determined by the estimated discounted cash flow analysis of the asset.
Since there is typically no active market for the Company's definite-lived intangible assets, the Company estimates fair values based on expected future cash flows at the time they are identified. The Company estimates future cash flows based on store-level historical results, current trends and operating and cash flow projections. The Company amortizes these assets with finite lives over their estimated useful lives on a straight-line basis. This amortization methodology best matches the pattern of economic benefit that is expected from the definite-lived intangible assets. The Company evaluates the useful lives of its intangible assets on an annual basis.
Tenant Improvement Allowances and Deferred Rent
The Company accounts for tenant improvement allowances and deferred rent as liabilities or assets on the balance sheet. Tenant improvement allowances are amounts received from a lessor for improvements to leased properties and are amortized against rent expense over the life of the respective leases. Fixed rents are recognized ratably over the initial non-cancellable lease term. Deferred rent represents differences between the actual cash paid for rent and the amount of straight-line rent over the initial non-cancellable term.
Self-Insurance Reserves
The Company is partially self-insured for workers' compensation and general liability claims less than certain dollar amounts and maintains insurance coverage with individual and aggregate limits. The Company also has a basket aggregate limit to protect against losses exceeding $5.0 million (subject to adjustment and certain exclusions) for workers' compensation claims and general liability claims. The Company's liabilities represent estimates of the ultimate cost for claims incurred, including loss adjusting expenses, as of the balance sheet date. The estimated liabilities are not discounted and are established based upon analysis of historical data, actuarial estimates, regulatory requirements, an estimate of claims incurred but not yet reported and other relevant factors. Management utilizes independent third-party actuarial studies to help assess the liability on a regular basis. As of December 29, 2016, per occurrence deductibles for individual workers' compensation and individual general liability claims were $250 thousand and $150 thousand, respectively.
Commitments and Contingencies
Liabilities for loss contingencies arising from claims, assessments, litigation, fines, penalties and other sources are recorded when it is probable that a liability has been incurred and the amount of the loss can be reasonably estimated.
Asset Retirement Obligations
An asset retirement obligation ("ARO") represents a legal obligation associated with the retirement of a tangible long-lived asset that is incurred upon the acquisition, construction, development or normal operation of that long-lived asset. The Company's AROs are primarily associated with leasehold improvements that, at the end of a lease, the Company is contractually
F-12
FDO Holdings, Inc. and Subsidiaries
Notes to Consolidated Financial Statements (Continued)
December 29, 2016
1. Summary of Significant Accounting Policies (Continued)
obligated to remove in order to comply with certain lease agreements. The ARO is recorded in Other long-term liabilities on the Consolidated Balance Sheets and will be subsequently adjusted for changes in fair value. The associated estimated asset retirement costs are capitalized as part of the carrying amount of the long-lived asset and depreciated over its useful life.
Changes in i) inflation rates and ii) the estimated costs, timing and extent of future store closure activities each result in 1) a current adjustment to the recorded liability and related asset and 2) a change in the liability and asset amounts to be recorded prospectively. Any changes related to the assets are then recognized in accordance with our depreciation policy, which would generally result in depreciation expense being recognized prospectively over the shorter of the remaining lease term or estimated useful life.
Fair Value Measurements—Debt
The Company estimates fair values in accordance with ASC 820, Fair Value Measurement. ASC 820 provides a framework for measuring fair value and expands disclosures required about fair value measurements. ASC 820 defines fair value as the price that would be received from the sale of an asset or paid to transfer a liability in the principal or most advantageous market for the asset or liability in an orderly transaction between market participants. Additionally, ASC 820 defines levels within a hierarchy based upon observable and non-observable inputs.
The fair values of certain of the Company's debt instruments have been determined by the Company utilizing Level 3 inputs, such as available market information and appropriate valuation methodologies, including the rates for similar instruments and the discounted cash flows methodology.
Derivative Financial Instruments
The Company uses derivative financial instruments to maintain a portion of its long-term debt obligations at a targeted balance of fixed and variable interest rate debt to manage its risk associated with fluctuations in interest rates. In November 2016, the Company entered into two interest rate caps. In 2013, we entered into two interest rate swap contracts. The 2016 and 2013 instruments have been designated as cash flow hedges for accounting purposes, and the fair value is calculated utilizing Level 2 inputs. Unrealized changes in the fair value of these derivative instruments are recorded in Accumulated other comprehensive loss within the equity section of our Consolidated Balance Sheets.
The effective portion of the gain or loss on the derivatives is reported as a component of Comprehensive income within the Consolidated Statements of Comprehensive Income and reclassified into earnings in the same period in which the hedged transaction affects earnings. The effective portion of the derivative represents the change in fair value of the hedge that offsets the change in fair value of the hedged item. To the extent changes in fair values of the instruments are not highly effective, the ineffective portion of the hedge is immediately recognized in earnings.
F-13
FDO Holdings, Inc. and Subsidiaries
Notes to Consolidated Financial Statements (Continued)
December 29, 2016
1. Summary of Significant Accounting Policies (Continued)
We perform an assessment of the effectiveness of our derivative contracts designated as hedges, including assessing the possibility of counterparty default. If we determine that a derivative is no longer expected to be highly effective, we discontinue hedge accounting prospectively and recognize subsequent changes in the fair value of the hedge in earnings. We believe our derivative contracts, which consist of interest rate cap and swap contracts, will continue to be highly effective in offsetting changes in cash flow attributable to floating interest rate risk. We did not have any ineffectiveness in 2016 or 2015 related to these instruments.
Use of Estimates
The preparation of the financial statements requires management of the Company to make a number of estimates and assumptions relating to the reported amount of assets and liabilities and the disclosure of contingent assets and liabilities at the date of the financial statements and the reported amounts of sales and expenses during the period. Significant items subject to such estimates and assumptions include the carrying amounts of fixed assets and intangibles, asset retirement obligations, allowances for accounts receivable and inventories, reserves for workers' compensation and general liability claims incurred but not reported and deferred income tax assets and liabilities. Actual results could differ from these estimates.
Revenue Recognition
Retail sales at the Company's stores are recorded at the point of sale and are net of sales discounts and estimated returns. In some instances, the Company will allow customers to store their merchandise, generally up to 14 days. In this instance, the Company recognizes revenue and the related cost of sales when both collection or reasonable assurance of collection of payment and final delivery of the product have occurred. For orders placed through our website and shipped to our customers, we recognize revenue and the related cost of sales at the time we estimate the customer receives the merchandise, which is typically within a few days of shipment. The Company arranges and pays for freight to deliver products to customers, and bills the customer for the estimated freight cost, which is included in Net sales. Sales taxes collected are not recognized as revenue as these amounts are ultimately remitted to the appropriate taxing authorities.
Gift Cards and Merchandise Credits
We sell gift cards to our customers in our stores and through our website and issue merchandise credits in our stores. We account for the programs by recognizing a liability at the time the gift card is sold or the merchandise credit is issued. The liability is relieved and revenue is recognized when the cards are redeemed. We have an agreement with an unrelated third-party who is the issuer of the Company's gift cards and also assumes the liability for unredeemed gift cards. The Company is not subject to claims under unclaimed property statutes, as the agreement effectively transfers the ownership of such unredeemed gift cards and the related future escheatment liability, if any, to the third-party. Gift card breakage is recognized based upon historical redemption patterns and represents the balance of gift cards for which the Company believes the likelihood of redemption by the customer is remote. Accordingly, in fiscal 2016, fiscal 2015, and fiscal 2014 gift card breakage
F-14
FDO Holdings, Inc. and Subsidiaries
Notes to Consolidated Financial Statements (Continued)
December 29, 2016
1. Summary of Significant Accounting Policies (Continued)
income of $627 thousand, $511 thousand, and $355 thousand was recognized in Net sales in the Consolidated Statements of Income, respectively, for such unredeemed gift cards.
Sales Returns and Allowances
The Company accrues for estimated sales returns based on historical sales return results. The allowance for sales returns at December 29, 2016 and December 31, 2015, was $4,887 thousand and $3,720 thousand, respectively.
Merchandise exchanges of similar product and price are not considered merchandise returns and, therefore, are excluded when calculating the sales returns reserve.
Cost of Sales
Cost of sales consists of merchandise costs as well as capitalized freight to transport inventory to our distribution centers and stores, and duty and other costs that are incurred to distribute the merchandise to our stores. Cost of sales also includes shrinkage, damaged product disposals, distribution, warehousing, sourcing and compliance cost and arranging and paying for freight to deliver products to customers. The Company receives cash consideration from certain vendors related to vendor allowances and volume rebates, which is recorded as a reduction of costs of sales when the inventory is sold or as a reduction of the carrying value of inventory if the inventory is still on hand.
Vendor Rebates and Allowances
Vendor allowances consist primarily of volume rebates that are earned as a result of attaining certain inventory purchase levels and advertising allowances or incentives for the promotion of vendors' products. These vendor allowances are accrued, based on annual projections, as earned.
Vendor allowances earned are initially recorded as a reduction to the carrying value of inventory and a subsequent reduction in cost of sales when the related product is sold. Certain incentive allowances that are reimbursements of specific, incremental and identifiable costs incurred to promote vendors' products are recorded as an offset against these promotional expenses.
Total Operating Expenses
Total operating expenses consist primarily of store and administrative personnel wages and benefits, infrastructure expenses, supplies, fixed asset depreciation, store and corporate facility expenses, pre-opening costs, training and advertising costs. Credit card fees, insurance, personal property taxes, legal expenses, and other miscellaneous operating costs are also included.
Advertising
The Company expenses advertising costs as the advertising takes place. Advertising costs incurred during the years ended December 29, 2016 and December 31, 2015, and December 25, 2014, were $33,497 thousand, $24,478 thousand and $17,359 thousand, respectively, and are included in Selling and store operating expenses and Pre-opening expenses in the Consolidated Statements of Income.
F-15
FDO Holdings, Inc. and Subsidiaries
Notes to Consolidated Financial Statements (Continued)
December 29, 2016
1. Summary of Significant Accounting Policies (Continued)
Pre-Opening Expenses
The Company accounts for non-capital operating expenditures incurred prior to opening a new store as "pre-opening" expenses in its Consolidated Statements of Income. The Company's pre-opening expenses begin on average three to six months in advance of a store opening or relocating due to, among other things, the amount of time it takes to prepare a store for its grand opening. Pre-opening expenses primarily include: advertising, rent, staff training, staff recruiting, utilities, personnel and equipment rental. A store is considered to be relocated if it is closed temporarily and re-opened within the same primary trade area. Pre-opening expenses for the years ended December 29, 2016, December 31, 2015, and December 25, 2014, totaled $13,732 thousand, $7,380 thousand, and $7,412 thousand, respectively.
Loss on Early Extinguishment of Debt
On September 30, 2016, the Company amended its prior asset-based revolving credit facility (the "Prior ABL Facility") and terminated its prior term loan facility (the "Prior Term Loan Facility"), each with Wells Fargo Bank, N.A, dated as of May 1, 2013, as amended. The Company also terminated its prior senior secured term loan facility with GCI Capital Markets LLC, (the "GCI Facility"). For the year ended December 29, 2016, loss on early extinguishment of debt is comprised of a (1) $179 thousand prepayment penalty paid in connection with the extinguishment of the Prior Term Loan Facility of $19,833 thousand, (2) write-off of approximately $1,319 thousand of unamortized debt issuance cost and original issue discount associated with the extinguishment of the Prior Term Loan Facility and the GCI Facility, (3) write-off of approximately $162 thousand associated with the amendment of the Prior ABL Facility and (4) $153 thousand unamortized deferred debt issuance cost related to the April 15, 2016 amendment to the Prior Term Loan Facility.
Stock-Based Compensation
The Company accounts for employee stock options in accordance with relevant authoritative literature. The Company obtains independent third-party valuation studies to assist it with determining the grant date fair value of our stock price at least twice a year. Stock options are granted with exercise prices equal to or greater than the estimated fair market value on the date of grant as authorized by the board of directors or compensation committee. Options granted have vesting provisions ranging from three to five years. Stock option grants are generally subject to forfeiture if employment terminates prior to vesting. The Company has selected the Black-Scholes option pricing model for estimating the grant date fair value of stock option awards granted. The Company bases the risk-free interest rate on the yield of a zero coupon U.S. Treasury security with a maturity equal to the expected life of the option from the date of the grant. The Company estimates the volatility of the share price of its common stock by considering the historical volatility of the stock of similar public entities. The Company considers a number of factors in determining the appropriateness of the public entities included in the volatility assumption, including the entity's life cycle stage, growth profile, size, financial leverage and products offered. Stock-based compensation cost is measured at the grant date based on the value of the award and is recognized as expense over the requisite service period based on the number of years for which the requisite service is expected to be rendered. The Company elected to early adopt ASU No. 2016-09 "Improvements to Employee Share-Based Payment Accounting" in 2016
F-16
FDO Holdings, Inc. and Subsidiaries
Notes to Consolidated Financial Statements (Continued)
December 29, 2016
1. Summary of Significant Accounting Policies (Continued)
and now recognize forfeitures in earnings as they occur; prior to the adoption, the Company had considered the retirement and forfeiture provisions of the options and utilized its historical experience to estimate the expected life of the options.
Income Taxes
The Company accounts for income taxes under the asset and liability method, which requires the recognition of deferred tax assets and liabilities for the future tax consequences attributable to differences between the financial statement carrying amounts and tax basis of existing assets and liabilities. Deferred tax assets and liabilities are measured using enacted tax rates expected to apply to taxable income in the years in which those temporary differences are expected to be recovered or settled. Changes in tax laws and rates could affect recorded deferred tax assets and liabilities in the future. The effect on deferred tax assets and liabilities of a change in tax laws or rates is recognized in the period that includes the enactment date of such a change.
The ultimate realization of deferred tax assets is dependent upon the generation of future taxable income during the periods in which the associated temporary differences became deductible. On a quarterly basis, the Company evaluates whether it is more likely than not that its deferred tax assets will be realized in the future and conclude whether a valuation allowance must be established.
The Company includes any estimated interest and penalties on tax-related matters in income taxes payable and income tax expense. The Company accounts for uncertain tax positions in accordance with ASC 740, Income Taxes. ASC 740-10 clarifies the accounting for uncertainty in income taxes recognized in an enterprise's financial statements using a two-step process for evaluating tax positions taken, or expected to be taken, on a tax return. The Company may only recognize the tax benefit from an uncertain tax position if it is more likely than not that the tax position will be sustained on examination by the taxing authorities, based on the technical merits of the position. The tax benefits recognized in the financial statements from such a position should be measured based on the largest benefit that has a greater than fifty percent likelihood of being realized upon ultimate settlement. Uncertain tax positions require determinations and estimated liabilities to be made based on provisions of the tax law, which may be subject to change or varying interpretation. The Company does not believe it has any material risks related to uncertain tax positions.
Segment Information
The Company operates as a specialty retailer of hard surface flooring and related accessories through retail stores located in the United States and through its website. The Company's chief operating decision maker is its Chief Executive Officer who reviews the Company's consolidated financial information for purposes of allocating resources and evaluating the Company's financial performance. Accordingly, the Company concluded it has one reportable segment.
F-17
FDO Holdings, Inc. and Subsidiaries
Notes to Consolidated Financial Statements (Continued)
December 29, 2016
1. Summary of Significant Accounting Policies (Continued)
The following table presents the Net sales of each major product category for each of the last three fiscal years (in thousands):
| |
Fiscal Year Ended | ||||||||||||||||||
|---|---|---|---|---|---|---|---|---|---|---|---|---|---|---|---|---|---|---|---|
| |
December 25, 2014 | December 31, 2015 | December 29, 2016 | ||||||||||||||||
Product Category
|
Net Sales | % of Net Sales |
Net Sales | % of Net Sales |
Net Sales | % of Net Sales |
|||||||||||||
Tile |
$ | 174,271 | 30 | % | $ | 244,902 | 31 | % | $ | 325,433 | 31 | % | |||||||
Decorative Accessories |
98,991 | 16 | 138,442 | 18 | 188,371 | 18 | |||||||||||||
Accessories (Installation Materials and Tools) |
91,122 | 16 | 124,162 | 16 | 165,330 | 16 | |||||||||||||
Wood |
90,752 | 16 | 116,999 | 15 | 142,751 | 14 | |||||||||||||
Laminate / Luxury Vinyl Plank |
61,817 | 11 | 77,586 | 10 | 131,447 | 12 | |||||||||||||
Natural Stone |
65,008 | 11 | 78,294 | 10 | 90,866 | 9 | |||||||||||||
Delivery and Other |
2,627 | — | 3,627 | — | 6,561 | — | |||||||||||||
| | | | | | | | | | | | | | | | | | | | |
Total |
$ | 584,588 | 100 | % | $ | 784,012 | 100 | % | $ | 1,050,759 | 100 | % | |||||||
| | | | | | | | | | | | | | | | | | | | |
| | | | | | | | | | | | | | | | | | | | |
| | | | | | | | | | | | | | | | | | | | |
Recent Accounting Pronouncements
In January 2017, the Financial Accounting Standards Board ("FASB") issued Accounting Standards Update ("ASU") No. 2017-04, "Intangibles—Goodwill and Other (Topic 350): Simplifying the Test for Goodwill Impairment." This standard simplifies how an entity is required to test goodwill for impairment by eliminating Step 2 from the goodwill impairment test. ASU No. 2017-04 is effective for fiscal years beginning after December 15, 2019, and interim periods within those fiscal years, with early adoption permitted after January 1, 2017. The amendments in this update should be applied using a prospective approach. The adoption of ASU No. 2017-04 is not expected to have a material impact on the Company's Consolidated Financial Statements.
In October 2016, the FASB issued ASU No. 2016-16, "Income Taxes (Topic 740): Intra-Entity Transfers of Assets Other Than Inventory." This standard update requires an entity to recognize the income tax consequences of intra-entity transfers of assets other than inventory when the transfer occurs. ASU No. 2016-16 is effective for fiscal years beginning after December 15, 2017, and interim periods within those fiscal years, with early adoption permitted. The amendments in this update should be applied using a modified retrospective approach. The adoption of ASU No. 2016-16 is not expected to have a material impact on the Company's Consolidated Financial Statements.
In August 2016, the FASB issued ASU No. 2016-15, "Statement of Cash Flows (Topic 230): Classification of Certain Cash Receipts and Cash Payments." The standard update addresses eight specific cash flow issues with the objective of reducing the existing diversity in practice. ASU No. 2016-15 is effective for fiscal years beginning after December 15, 2017, and interim periods within those fiscal years, with early adoption permitted. The amendments in this update should be applied using a retrospective approach. The adoption of ASU No. 2016-15 is not expected to have a material impact on the Company's cash flows.
F-18
FDO Holdings, Inc. and Subsidiaries
Notes to Consolidated Financial Statements (Continued)
December 29, 2016
1. Summary of Significant Accounting Policies (Continued)
In March 2016, the FASB issued ASU No. 2016-09, "Compensation—Stock Compensation (Topic 718): Improvements to Employees Share-Based Payment Accounting." The update is intended to simplify several areas of accounting for share-based compensation arrangements, including the income tax impact, classification on the statement of cash flows and forfeitures. The amendments in this update are effective for fiscal years beginning after December 15, 2016, and interim periods within those years, with early adoption permitted. Depending on the amendment, methods used to apply the requirements of the update include modified retrospective, retrospective, and prospective. We elected to early adopt this standard during the second quarter of 2016. The net cumulative effect of this change was recognized as a $148 thousand reduction to retained earnings and the recognition of $238 thousand of additional paid-in capital. The adoption of this standard resulted in a modified retrospective adjustment on our consolidated balance sheet as of January 1, 2016, the beginning of the annual period that includes the interim period of adoption.
In February 2016, the FASB issued ASU No. 2016-02, "Leases (Topic 842)." ASU No. 2016-02 requires that lessees recognize lease assets and a lease liabilities for all leases with greater than 12 month terms on the balance sheet. The guidance also requires disclosures about the amount, timing and uncertainty of cash flows arising from leases. This new guidance is effective for fiscal years beginning after December 15, 2018 and interim periods within those years, with early adoption permitted. The standard must be applied using a modified retrospective approach. The Company is currently evaluating the impact that ASU No. 2016-02 will have on our Consolidated Financial Statements. The Company is currently evaluating the impact that ASU No. 2016-02 will have on our Consolidated Financial Statements. When implemented, the Company believes the new standard will have a material impact on its consolidated balance sheet. The Company is currently evaluating the effect that implementation of this standard will have on the Company's consolidated statements of income, cash flows, financial position and related disclosures.
In July 2015, the FASB issued ASU No. 2015-11, "Inventory (Topic 330): Simplifying the Measurement of Inventory." ASU No. 2015-11 provides new guidance for entities using first-in, first-out or average cost to simplify the subsequent measurement of inventory, which proposes that inventory should be measured at the lower of cost and net realizable value. Net realizable value is defined as the estimated selling prices in the ordinary course of business, less reasonably predictable costs of completion, disposal, and transportation. This guidance eliminates the option to subsequently measure inventory at replacement cost or net realizable value less an approximately normal profit margin. This new guidance is effective for fiscal years beginning after December 15, 2016 and interim periods within those years, with early adoption permitted. The amendments in this update should be applied prospectively. The adoption of ASU No. 2015-11 is not expected to have a material impact on the Company's Consolidated Financial Statements.
In May 2014, the FASB issued ASU No. 2014-09, "Revenue from Contracts with Customers (Topic 606)." ASU No. 2014-09 provides new guidance related to the core principle that an entity recognizes revenue to depict the transfer of promised goods or services to customers in an amount that reflects the consideration to which the entity expects to be entitled to receive in exchange for those goods or services provided. In July 2015, the FASB issued ASU No. 2015-14, "Revenue from Contracts with Customers (Topic 606): Deferral of the Effective Date," to defer the effective date by one year to December 15, 2017 for interim and annual reporting periods beginning after that date, and permitted
F-19
FDO Holdings, Inc. and Subsidiaries
Notes to Consolidated Financial Statements (Continued)
December 29, 2016
1. Summary of Significant Accounting Policies (Continued)
early adoption of the standard, but not before the original effective date of December 15, 2016. In March 2016, the FASB issued ASU No. 2016-08 "Revenue from Contracts with Customers (Topic 606): Principal versus Agent Considerations (Reporting Revenue Gross versus Net)," which clarifies the guidance in ASU No. 2014-09 and has the same effective date as the original standard. In April 2016, the FASB issued ASU No. 2016-10, "Revenue from Contracts with Customers (Topic 606): Identifying Performance Obligations and Licensing." In May 2016, the FASB issued ASU No. 2016-12, "Revenue from Contracts with Customers (Topic 606): Narrow-Scope Improvements and Practical Expedients. The 2016 updates to the revenue recognition guidance relate to principal versus agent assessments, identifying performance obligations, the accounting for licenses, and certain narrow scope improvements and practical expedients. This new standard could impact the timing and amounts of revenue recognized. As the Company evaluates the impact of this standard, the more significant change relates to the timing of revenue recognized for certain transactions for which the Company allows customers to store their merchandise at the retail store for final delivery at a later date. The Company is continuing to evaluate the impact this standard, and related amendments and interpretive guidance, will have on its consolidated financial statements. The Company plans to adopt the new standard on a modified retrospective basis beginning December 29, 2017.
2. Fixed Assets
Fixed assets as of December 29, 2016 and December 31, 2015, consisted of the following (in thousands):
| |
2015 | 2016 | |||||
|---|---|---|---|---|---|---|---|
Furniture, fixtures and equipment |
$ | 60,992 | $ | 90,787 | |||
Leasehold improvements |
60,564 | 89,226 | |||||
Computer software and hardware |
27,831 | 40,699 | |||||
| | | | | | | | |
Fixed assets, at cost |
149,387 | 220,712 | |||||
| | | | | | | | |
Less: accumulated depreciation and amortization |
46,404 | 70,241 | |||||
| | | | | | | | |
Fixed assets, net |
$ | 102,983 | $ | 150,471 | |||
| | | | | | | | |
| | | | | | | | |
| | | | | | | | |
Depreciation and amortization on fixed assets for the years ended December 29, 2016, December 31, 2015, and December 25, 2014, was $27,459 thousand, $18,531 thousand, and $12,512 thousand, respectively.
F-20
FDO Holdings, Inc. and Subsidiaries
Notes to Consolidated Financial Statements (Continued)
December 29, 2016
3. Intangible Assets
The following summarizes the balances of intangible assets as of December 29, 2016 and December 31, 2015 (in thousands):
| |
2015 | 2016 | |||||||||||||
|---|---|---|---|---|---|---|---|---|---|---|---|---|---|---|---|
| |
Estimated Useful Lives |
Gross Carrying Amount |
Accumulated Amortization |
Gross Carrying Amount |
Accumulated Amortization |
||||||||||
Amortizable intangible assets: |
|||||||||||||||
Vendor relationships |
10 years | 319 | (162 | ) | 319 | (194 | ) | ||||||||
Indefinite-lived intangible assets: |
|||||||||||||||
Trade names |
109,269 | — | 109,269 | — | |||||||||||
| | | | | | | | | | | | | | | | |
|
$ | 109,588 | $ | (162 | ) | $ | 109,588 | $ | (194 | ) | |||||
| | | | | | | | | | | | | | | | |
| | | | | | | | | | | | | | | | |
| | | | | | | | | | | | | | | | |
Amortization expense related to amortizable intangible assets for the years ended December 29, 2016, December 31, 2015 and December 25, 2014, was $32 thousand, $327 thousand and $356 thousand, respectively.
Estimated intangible asset amortization for the next four years is as follows (in thousands):
2017 |
$ | 32 | ||
2018 |
32 | |||
2019 |
32 | |||
2020 |
29 |
4. Income Taxes
The components of the provision for income taxes are as follows (in thousands):
| |
Year Ended December 25, 2014 |
Year Ended December 31, 2015 |
Year Ended December 29, 2016 |
|||||||
|---|---|---|---|---|---|---|---|---|---|---|
Current expense: |
||||||||||
Federal |
$ | 9,081 | $ | 13,183 | $ | 14,588 | ||||
State |
1,979 | 2,552 | 2,422 | |||||||
| | | | | | | | | | | |
Total current expense |
11,060 | 15,735 | 17,010 | |||||||
| | | | | | | | | | | |
Deferred (benefit)/expense: |
||||||||||
Federal |
(680 | ) | 553 | (4,765 | ) | |||||
State |
(746 | ) | (89 | ) | (771 | ) | ||||
| | | | | | | | | | | |
Total deferred (benefit)/expense |
(1,426 | ) | 464 | (5,536 | ) | |||||
| | | | | | | | | | | |
|
$ | 9,634 | $ | 16,199 | $ | 11,474 | ||||
| | | | | | | | | | | |
| | | | | | | | | | | |
| | | | | | | | | | | |
F-21
FDO Holdings, Inc. and Subsidiaries
Notes to Consolidated Financial Statements (Continued)
December 29, 2016
4. Income Taxes (Continued)
The following is a summary of the differences between the total provision for income taxes as shown on the financial statements and the provision for income taxes that would result from applying the federal statutory tax rate of 35% to income before income taxes (in thousands).
| |
Year Ended December 25, 2014 |
Year Ended December 31, 2015 |
Year Ended December 29, 2016 |
|||||||
|---|---|---|---|---|---|---|---|---|---|---|
Computed "expected" provision at statutory rate |
$ | 8,656 | $ | 15,052 | $ | 19,080 | ||||
State income taxes, net of federal income tax benefit |
801 | 1,594 | 1,073 | |||||||
Permanent differences: |
||||||||||
Non-qualified option holder dividend equivalent |
— | — | (7,877 | ) | ||||||
Other |
96 | 113 | (4 | ) | ||||||
| | | | | | | | | | | |
Total permanent differences |
96 | 113 | (7,881 | ) | ||||||
Other, net |
81 | (560 | ) | (798 | ) | |||||
| | | | | | | | | | | |
Provision for income taxes |
$ | 9,634 | $ | 16,199 | $ | 11,474 | ||||
| | | | | | | | | | | |
| | | | | | | | | | | |
| | | | | | | | | | | |
The permanent differences of $7,877 thousand in fiscal 2016 is the federal benefit related to a dividend equivalent payment to certain option holders. The state benefit related to this payment of $597 thousand is included in state income taxes, net of federal income tax benefit in the table above.
The tax effects of temporary differences that give rise to significant portions of the deferred income tax assets and (liabilities) are presented below (in thousands):
| |
Year Ended December 31, 2015 |
Year Ended December 29, 2016 |
|||||
|---|---|---|---|---|---|---|---|
Deferred tax assets: |
|||||||
Accruals not currently deductible for tax purposes |
$ | 10,314 | $ | 14,342 | |||
Tenant improvement allowances |
6,162 | 7,690 | |||||
Inventories |
3,459 | 4,050 | |||||
Stock based compensation |
2,997 | 4,179 | |||||
Other intangibles |
761 | 693 | |||||
Gift card liability |
820 | 858 | |||||
Litigation accrual |
— | 5,299 | |||||
Other |
89 | 47 | |||||
| | | | | | | | |
Total deferred tax assets |
24,602 | 37,158 | |||||
Deferred tax liabilities: |
|||||||
Intangible assets |
(41,095 | ) | (41,269 | ) | |||
Fixed assets |
(16,907 | ) | (23,650 | ) | |||
Other |
(324 | ) | (504 | ) | |||
| | | | | | | | |
Total deferred tax liabilities |
(58,326 | ) | (65,423 | ) | |||
| | | | | | | | |
Net deferred tax liabilities |
$ | (33,724 | ) | $ | (28,265 | ) | |
| | | | | | | | |
| | | | | | | | |
| | | | | | | | |
F-22
FDO Holdings, Inc. and Subsidiaries
Notes to Consolidated Financial Statements (Continued)
December 29, 2016
4. Income Taxes (Continued)
In assessing the realization of deferred tax assets, including net operating losses, management considered whether it is more likely than not that some portion or all of the deferred tax assets will not be realized. The ultimate realization of deferred tax assets is dependent upon the generation of future taxable income during the periods in which those temporary differences become deductible. Management considers the scheduled reversal of deferred tax liabilities, projected future taxable income and tax planning strategies in making this assessment, and accordingly, has concluded that no valuation allowance is necessary as of December 29, 2016 and December 31, 2015.
The Company files income tax returns with the U.S. Federal government and various state jurisdictions. In the normal course of business, the Company is subject to examination by taxing authorities. The Internal Revenue Service has completed audits of the Company's federal income tax returns for the years through 2011. As of December 29, 2016, December 31, 2015, and December 25, 2014 the Company had unrecognized tax benefits of $0, $0, and $189 thousand, respectively. The amounts of unrecognized tax benefits that, if recognized, would favorably impact the effective tax rate were $0, $0, and $136 thousand as of December 29, 2016, December 31, 2015, and December 25, 2014, respectively. During 2014, the Company recorded an immaterial amount of interest expense related to uncertain tax positions. The Company's policy is to classify interest and penalties related to unrecognized tax benefits in income tax expense.
5. Derivatives and Risk Management
Changes in interest rates impact our results of operations. In an effort to manage our exposure to this risk, we enter into derivative contracts and may adjust our derivative portfolio as market conditions change.
Interest Rate Risk
Our exposure to market risk from adverse changes in interest rates is primarily associated with our long-term debt obligations, which carry variable interest rates. Market risk associated with our variable interest rate long-term debt relates to the potential reduction in fair value and negative impact to future earnings, respectively, from an increase in interest rates.
In an effort to manage our exposure to the risk associated with our variable interest rate long-term debt, we periodically enter into interest rate contracts. We designate interest rate contracts used to convert the interest rate exposure on a portion of our debt portfolio from a floating rate to a fixed rate or capped rate as cash flow hedges.
Hedge Position as of December 29, 2016:
(in thousands)
|
Notional Balance | Final Maturity Date |
Other Assets |
Other Accrued Liabilities |
AOCI, Net of Tax |
||||||||||||
|---|---|---|---|---|---|---|---|---|---|---|---|---|---|---|---|---|---|
Interest rate caps (cash flow hedges) |
$ | 205,000 | U.S. dollars | December 2021 | $ | 2,473 | $ | — | $ | 176 | |||||||
Interest rate swaps (cash flow hedges) |
$ | 17,500 | U.S. dollars | January 2017 | $ | — | $ | — | $ | — | |||||||
F-23
FDO Holdings, Inc. and Subsidiaries
Notes to Consolidated Financial Statements (Continued)
December 29, 2016
5. Derivatives and Risk Management (Continued)
Hedge Position as of December 31, 2015:
(in thousands)
|
Notional Balance | Final Maturity Date |
Other Assets |
Other Accrued Liabilities |
AOCI, Net of Tax |
||||||||||||
|---|---|---|---|---|---|---|---|---|---|---|---|---|---|---|---|---|---|
Interest rate swaps (cash flow hedges) |
$ | 35,000 | U.S. dollars | January 2017 | $ | — | $ | (160 | ) | $ | (100 | ) | |||||
Designated Hedge Losses
Gains (losses) related to our designated hedge contracts are as follows (in thousands):
| |
Effective Portion Reclassified From AOCI to Earnings |
Effective Portion Recognized in Other Comprehensive Income |
|||||||||||||||||
|---|---|---|---|---|---|---|---|---|---|---|---|---|---|---|---|---|---|---|---|
| |
Fiscal Year Ended | ||||||||||||||||||
(in thousands)
|
2014 | 2015 | 2016 | 2014 | 2015 | 2016 | |||||||||||||
Interest rate caps (cash flow hedges) |
$ | — | $ | — | $ | — | $ | — | $ | — | $ | 176 | |||||||
Interest rate swaps (cash flow hedges) |
$ | — | $ | — | $ | — | $ | 14 | $ | 43 | $ | 100 | |||||||
Credit Risk
To manage credit risk associated with our interest rate hedging program, we select counterparties based on their credit ratings and limit our exposure to any one counterparty.
The counterparties to our derivative contracts are financial institutions with investment grade credit ratings. To manage our credit risk related to our derivative financial instruments, we periodically monitor the credit risk of our counterparties, limit our exposure in the aggregate and to any single counterparty, and adjust our hedging position, as appropriate. The impact of credit risk, as well as the ability of each party to fulfill its obligations under our derivative financial instruments, is considered in determining the fair value of the contracts. Credit risk has not had a significant effect on the fair value of our derivative contracts. We do not have any credit risk-related contingent features or collateral requirements with our derivative financial instruments.
6. Commitments and Contingencies
Lease Commitments
The Company leases its corporate office, retail locations, and distribution centers under long-term operating lease agreements that expire in various years through 2032. Additionally, certain equipment is leased under short-term operating leases.
Certain lease agreements include escalating rents over the lease terms. The Company expenses rent on a straight-line basis over the life of the lease, which commences on the date the Company has the right to control the property. The cumulative expense recognized on a straight-line basis in excess of the cumulative payments is included in deferred rent in the accompanying balance sheets. Future
F-24
FDO Holdings, Inc. and Subsidiaries
Notes to Consolidated Financial Statements (Continued)
December 29, 2016
6. Commitments and Contingencies (Continued)
minimum lease payments under non-cancelable operating leases (with initial or remaining lease terms in excess of one year) as of December 29, 2016, are (in thousands):
| |
Amount | |||
|---|---|---|---|---|
2017 |
$ | 63,340 | ||
2018 |
71,913 | |||
2019 |
73,580 | |||
2020 |
71,598 | |||
2021 |
67,875 | |||
Thereafter |
369,231 | |||
| | | | | |
Total minimum lease payments |
$ | 717,537 | ||
| | | | | |
| | | | | |
| | | | | |
Lease expense for the years ended December 29, 2016, December 31, 2015, and December 25, 2014, was $53,899 thousand, $41,756 thousand, and $29,774 thousand, respectively.
Litigation
The Company is subject to other various legal actions, claims and proceedings arising in the ordinary course of business, including claims related to breach of contracts, products liabilities, intellectual property matters and employment related matters resulting from its business activities. The Company establishes reserves for specific legal proceedings when it determines that the likelihood of an unfavorable outcome is probable and the amount of loss can be reasonably estimated. These proceedings are not expected to have a material impact on the Company's consolidated financial position, cash flows or results of operations.
On December 11, 2015, six plaintiffs filed a putative nationwide class action against the Company's subsidiary, Floor and Decor Outlets of America, Inc., ("F&D") in the United States District Court for the Northern District of Georgia, alleging that certain Chinese-manufactured laminate flooring products sold by F&D were falsely labeled as compliant with formaldehyde emissions standards established by California Air Resources Board ("CARB"). In June 2016, management believed a settlement of the case was both probable and estimable and accrued $14 million with respect to such case in the second quarter of fiscal 2016. During the third quarter of fiscal 2016, F&D reached an agreement with one of the manufacturers whose products were involved in the case to cover $3.5 million of the Company's losses related to this lawsuit. The Company recorded the $3.5 million receivable as an offset to litigation settlement expenses. In September 2016, F&D entered into a classwide settlement to resolve the lawsuit. The settlement class was defined as all end users of Chinese-manufactured laminate flooring sold by F&D nationwide between January 1, 2012 and August 1, 2015. As part of the settlement, all settlement class members who did not exclude themselves from the settlement granted F&D a release of all claims arising out of or relating to their purchase of Chinese-manufactured laminate flooring from F&D, with the exception of personal injury claims. Seven members of the settlement class excluded themselves from the settlement. The settlement was granted final approval by the court on January 10, 2017 and did not involve an admission of liability by F&D. The Company does not believe that claims by the members excluded from the settlement class or any
F-25
FDO Holdings, Inc. and Subsidiaries
Notes to Consolidated Financial Statements (Continued)
December 29, 2016
6. Commitments and Contingencies (Continued)
personal injury claims are probable to result in a material loss to the Company in excess of the amounts already accrued.
7. Debt
The following table summarizes our long-term debt as of December 29, 2016 and December 31, 2015 (dollars in thousands):
| |
Maturity Date |
Interest Rate Per Annum at December 29, 2016 |
December 31, 2015 |
December 29, 2016 |
|||||||
|---|---|---|---|---|---|---|---|---|---|---|---|
Credit Facilities: |
|||||||||||
Term Loan Facility |
September 30, 2023 | 5.25% Variable | $ | — | $ | 350,000 | |||||
ABL Facility |
September 30, 2021 | 2.08% Variable | 92,900 | 50,000 | |||||||
Prior Term Loan Facility |
July 2, 2019 | 3.30% Variable | 8,333 | — | |||||||
GCI Facility |
May 1, 2019 | 7.75% Variable | 78,000 | — | |||||||
| | | | | | | | | | | | |
Total secured debt |
$ | 179,233 | $ | 400,000 | |||||||
| | | | | | | | | | | | |
| | | | | | | | | | | | |
| | | | | | | | | | | | |
Less: current maturities |
1,267 | 3,500 | |||||||||
| | | | | | | | | | | | |
Long-term debt maturities |
177,966 | 396,500 | |||||||||
Less: unamortized discount and debt issuance costs |
1,643 | 9,257 | |||||||||
| | | | | | | | | | | | |
Total long-term debt |
$ | 176,323 | $ | 387,243 | |||||||
| | | | | | | | | | | | |
| | | | | | | | | | | | |
| | | | | | | | | | | | |
On September 30, 2016, the Board of Directors declared the Special Dividend and authorized the Option Payments. Payment of the Special Dividend and the Option Payments was made on September 30, 2016 to all shareholders and option holders of record at the close of business on September 30, 2016. In connection with the dividend, the Company refinanced its existing indebtedness by amending the Prior ABL Facility with an amended and restated $200.0 million asset based revolving credit facility maturing on September 30, 2021 (the "ABL Facility"), entering into a $350.0 million senior secured term loan facility maturing on September 30, 2023 (the "Term Loan Facility" and together with the ABL Facility, our "Credit Facilities") and repaying and terminating the Prior Term Loan Facility and the GCI Facility. As a result of the refinancing, the Company recorded $162 thousand of loss on extinguishment of debt related to unamortized deferred debt issuance cost for the Prior ABL Facility, as well as recorded $1,319 thousand of loss on extinguishment of debt related to unamortized original issue discount and unamortized deferred debt issuance cost for the Prior Term Loan Facility and GCI Facility. In addition, the Company recorded $10,347 thousand of original issue discount and deferred debt issuance cost related to new third-party fees associated with the refinancing.
Term Loan Facility
As of December 29, 2016, the Term Loan Facility had an outstanding balance of $350.0 million and requires quarterly repayments of $875 thousand, which commenced on December 31, 2016, with the remainder due and payable at maturity.
F-26
FDO Holdings, Inc. and Subsidiaries
Notes to Consolidated Financial Statements (Continued)
December 29, 2016
7. Debt (Continued)
As of December 29, 2016, the Term Loan Facility bore interest based on one of the following rates, at the Company's option:
The following table summarizes scheduled maturities of our debt, including current maturities, as of December 29, 2016 (in thousands):
| |
Amount | |||
|---|---|---|---|---|
2017 |
$ | 3,500 | ||
2018 |
3,500 | |||
2019 |
3,500 | |||
2020 |
4,375 | |||
2021 |
52,625 | |||
Thereafter |
332,500 | |||
| | | | | |
Total minimum debt payments |
$ | 400,000 | ||
| | | | | |
| | | | | |
| | | | | |
ABL Facility
As of December 29, 2016, the ABL Facility had a maximum availability of $200.0 million with actual available borrowings limited to the sum, at the time of calculation, of eligible credit card receivables, plus the cost of eligible inventory, net of inventory reserves, multiplied by the product of appraisal percentage multiplied by the appraised value of eligible inventory, plus 85% of eligible net trade receivables, plus all eligible cash on hand minus certain Availability Reserves as defined in the credit agreement governing the ABL Facility. The ABL Facility is available for issuance of letters of credit and contains $30.0 million for standby letters of credit and commercial letters of credit. Available borrowings under the facility are reduced by the face amount of outstanding letters of credit. As of December 29, 2016, the borrowings bear interest at a floating rate, which is based on one of the following rates at the option of the Company:
F-27
FDO Holdings, Inc. and Subsidiaries
Notes to Consolidated Financial Statements (Continued)
December 29, 2016
7. Debt (Continued)
As of December 29, 2016, the Company had net availability under the ABL Facility of $121,719 thousand, including outstanding letters of credit of $10,119 thousand.
Covenants
The credit agreements governing our Credit Facilities contain customary restrictive covenants that, among other things and with certain exceptions, limit the ability of the Company to (i) incur additional indebtedness and liens in connection therewith; (ii) pay dividends and make certain other restricted payments; (iii) effect mergers or consolidations; (iv) enter into transactions with affiliates; (v) sell or dispose of property or assets and (vi) engage in unrelated lines of business. In addition, these credit agreements subject us to certain reporting obligations and require that we satisfy certain financial covenants, including, among other things:
The Term Loan Facility has no financial maintenance covenants. As of December 29, 2016, the Company was in compliance with its debt covenants.
Deferred Debt Issuance Cost and Original Issue Discount
Deferred debt issuance cost related to our ABL Facility and our Prior ABL Facility of $1,274 thousand and $930 thousand as of December 29, 2016 and December 31, 2015, respectively, are included in Other assets on our Consolidated Balance Sheets. Deferred debt issuance cost and original issue discount related to our Term Loan Facility of $9,257 thousand as of December 29, 2016 and Prior Term Loan Facility and GCI Facility of $1,644 thousand as of December 31, 2015 are included in Term loans on our Consolidated Balance Sheets. Amortization expense was $954 thousand, $692 thousand, and $656 thousand for the years ended December 29, 2016, December 31, 2015, and December 25, 2014.
Fair Value of Debt
Market risk associated with our fixed and variable rate long-term debt relates to the potential change in fair value and negative impact to future earnings, respectively, from a change in interest rates. The aggregate fair value of debt was based primarily on discounted cash flows utilizing estimated interest rates, maturities, credit risk, and underlying collateral and is classified primarily as Level 3
F-28
FDO Holdings, Inc. and Subsidiaries
Notes to Consolidated Financial Statements (Continued)
December 29, 2016
7. Debt (Continued)
within the fair value hierarchy. At December 29, 2016 and December 31, 2015, the fair values of the Company's debt are as follows (in thousands):
| |
December 31, 2015 |
December 29, 2016 |
|||||
|---|---|---|---|---|---|---|---|
Total debt at par value |
$ | 179,233 | $ | 400,000 | |||
Less: unamortized discount and debt issuance costs |
1,643 | 9,257 | |||||
| | | | | | | | |
Net carry amount |
$ | 177,590 | $ | 390,743 | |||
Fair value |
$ | 179,413 | $ | 400,000 | |||
8. Stockholders' Equity
Common Stock
The Company has three classes of common stock: Class A, Class B, and Class C. The holders of Class A common stock, Class B common stock and Class C common stock are entitled to share equally, on a per share basis, in dividends or other distributions. Class A common stockholders are entitled to one vote per share held. Class B and Class C common stockholders have no voting rights, except as otherwise provided by law. In the event of the voluntary liquidation or dissolution of the Company, each class of stock will share equally, on a per share basis, in all the assets of the Company that are available for distribution to stockholders. A shareholders agreement restricts the terms and conditions under which the shares held by the parties to the shareholders agreement may be sold or transferred.
Conversion Features
In the event of an initial public offering that yields gross proceeds of at least $75.0 million and has a public offering price per share of at least $1,000 per share, as adjusted by dividends or other distributions (which has been adjusted to $916 as a result of the dividend paid in connection with the 2013 Refinancing), all of the shares of Class B common stock will convert to the same number of Class A common stock, without any action of the holder. The shares of Class C common stock held by individuals other than FS Equity Partners VI, L. P., FS Affiliates VI, L.P. or their affiliated persons shall convert automatically to shares of Class A common stock, without any action on their part. Shares of Class C common stock may be converted, upon the election of holders of such shares of Class C common stock, into the same number of shares of Class A common stock under certain circumstances as provided in the Company's certificate of incorporation.
Stock Options
The Company accounts for stock-based compensation pursuant to relevant authoritative guidance, which requires measurement of compensation cost for all stock awards at fair value on the date of grant and recognition of compensation, net of estimated forfeitures, over the requisite service period for awards expected to vest.
On January 13, 2011, the Company adopted the 2011 Stock Option Plan (as amended, restated, supplemented or otherwise modified from time to time, the "2011 Plan") to provide for the grant of
F-29
FDO Holdings, Inc. and Subsidiaries
Notes to Consolidated Financial Statements (Continued)
December 29, 2016
8. Stockholders' Equity (Continued)
stock options to employees (including officers), consultants and non-employee directors of the Company and its subsidiaries. Pursuant to the terms of the 2011 Plan, which was approved by the Company's Board of Directors, the Company was authorized to grant options for the purchase of up to 38,905 shares as of December 29, 2016 and 33,500 shares as of December 31, 2015. As of December 29, 2016 and December 31, 2015, there were 558 and 324 options available for grant under the 2011 Plan, respectively.
Stock options are granted with an exercise price estimated to be greater than or equal to the fair market value on the date of grant. Options granted have vesting provisions ranging from three to five years, and contractual terms of ten years. Stock option grants are generally subject to forfeiture if employment terminates prior to vesting. All options were granted at or above estimated fair market value as authorized by the Company's Board of Directors.
The fair value of stock option awards granted was estimated using the Black-Scholes pricing model with the following weighted-average assumptions:
| |
Year Ended December 25, 2014 |
Year Ended December 31, 2015 |
Year Ended December 29, 2016 |
|||||||
|---|---|---|---|---|---|---|---|---|---|---|
Risk-free interest rate |
2.09 | % | 1.93 | % | 1.43 | % | ||||
Expected volatility |
46 | % | 49 | % | 40 | % | ||||
Expected life (in years) |
6.49 | 6.92 | 6.50 | |||||||
Dividend yield |
0 | % | 0 | % | 0 | % | ||||
The Company estimates the volatility of the share price of its common stock by considering the historical volatility of the stock of similar public entities. In determining the appropriateness of the public entities included in the volatility assumption the Company considered a number of factors, including the entity's life cycle stage, growth profile, size, financial leverage and products offered.
F-30
FDO Holdings, Inc. and Subsidiaries
Notes to Consolidated Financial Statements (Continued)
December 29, 2016
8. Stockholders' Equity (Continued)
The following summarizes the changes in the number of shares of common stock under option for the following periods:
| |
Options | Weighted Average Exercise Price |
Options Exercisable at End of Year |
Weighted Average Exercise Price of Exercisable Options |
Weighted Average Fair Value/Share of Options Granted During the Year |
|||||||||||
|---|---|---|---|---|---|---|---|---|---|---|---|---|---|---|---|---|
Outstanding at December 26, 2013 |
33,294 | $ | 1,316 | 10,786 | $ | 1,171 | — | |||||||||
Granted |
2,326 | $ | 2,472 | — | — | $ | 1,194 | |||||||||
Exercised |
(625 | ) | $ | 1,053 | — | — | — | |||||||||
Forfeited or expired |
(5,399 | ) | $ | 1,306 | — | — | — | |||||||||
| | | | | | | | | | | | | | | | | |
Outstanding at December 25, 2014 |
29,596 | $ | 1,415 | 14,320 | $ | 1,238 | — | |||||||||
Granted |
4,283 | $ | 2,597 | — | — | $ | 1,325 | |||||||||
Exercised |
(16 | ) | $ | 2,473 | — | — | — | |||||||||
Forfeited or expired |
(1,359 | ) | $ | 2,304 | — | — | — | |||||||||
| | | | | | | | | | | | | | | | | |
Outstanding at December 31, 2015 |
32,504 | $ | 1,533 | 20,684 | $ | 1,285 | $ | — | ||||||||
Granted |
6,294 | $ | 3,197 | — | — | 1,328 | ||||||||||
Exercised |
(451 | ) | $ | 1,118 | — | — | — | |||||||||
Forfeited or expired |
(1,123 | ) | $ | 2,140 | — | — | — | |||||||||
| | | | | | | | | | | | | | | | | |
Outstanding at December 29, 2016 |
37,224 | $ | 1,716 | 25,328 | $ | 1,349 | $ | — | ||||||||
| | | | | | | | | | | | | | | | | |
| | | | | | | | | | | | | | | | | |
| | | | | | | | | | | | | | | | | |
The intrinsic value for stock options is defined as the difference between the exercise price and the value of the Company's common stock (on a minority, non-marketable basis). The per share value of the Company's common stock as of December 29, 2016, was $3,214. The intrinsic value of stock options exercised was $942 thousand and $11 thousand for the years ended December 29, 2016 and December 31, 2015, respectively. The aggregate intrinsic value of stock options outstanding as of December 29, 2016, was $55,759 thousand with a weighted-average remaining contractual life of 6.2 years. The aggregate intrinsic value of stock options exercisable as of December 29, 2016, was $47,218 thousand with a weighted-average remaining contractual life of 5.1 years. The Company's total unrecognized compensation cost related to stock-based compensation as of December 29, 2016, was $12,577 thousand, which is expected to be recognized over a weighted average period of 3.9 years.
On September 30, 2016, in connection with the Special Dividend, the Company declared the Option Payments for certain option holders. A portion of the Option Payments were for unvested options, and option holders are required to repay any amounts related to options that do not vest prior to such option holder's termination of employment. In the event an option holder defaults on such repayment, we will record the amount as additional stock based compensation expense in that reporting period.
F-31
FDO Holdings, Inc. and Subsidiaries
Notes to Consolidated Financial Statements (Continued)
December 29, 2016
9. Earnings Per Share
Net Income per Common Share
We calculate basic earnings per share by dividing net income by the weighted average number of common shares outstanding during the period. Diluted earnings per share is computed by dividing net income by the weighted average number of common shares outstanding adjusted for the dilutive effect of stock options. The following table shows the computation of basic and diluted earnings per share:
| |
Year Ended December 25, 2014 |
Year Ended December 31, 2015 |
Year Ended December 29, 2016 |
|||||||
|---|---|---|---|---|---|---|---|---|---|---|
Net income (in thousands) |
$ | 15,098 | $ | 26,807 | $ | 43,039 | ||||
| | | | | | | | | | | |
| | | | | | | | | | | |
| | | | | | | | | | | |
Basic weighted average shares outstanding |
258,599 | 259,043 | 259,251 | |||||||
Dilutive effect of share based awards |
7,549 | 9,060 | 15,533 | |||||||
| | | | | | | | | | | |
Diluted weighted average shares outstanding |
266,148 | 268,103 | 274,784 | |||||||
| | | | | | | | | | | |
| | | | | | | | | | | |
| | | | | | | | | | | |
Basic earnings per share |
$ | 58.38 | $ | 103.48 | $ | 166.01 | ||||
Diluted earnings per share |
$ | 56.73 | $ | 99.99 | $ | 156.63 | ||||
The following have been excluded from the computation of dilutive effect of share based awards because the effect would be anti-dilutive:
| |
Year Ended December 25, 2014 |
Year Ended December 31, 2015 |
Year Ended December 29, 2016 |
|||||||
|---|---|---|---|---|---|---|---|---|---|---|
Stock Options |
4,775 | 5,769 | 6,226 | |||||||
10. Unaudited Earnings Per Share Pro Forma for Dividend
On February 10, 2017 the Company filed a registration statement with the Securities and Exchange Commission ("SEC") in anticipation of the initial public offering of its common stock.
Under certain SEC interpretations, dividends declared in the year preceding an initial public offering are deemed to be in contemplation of the offering with the intention of repayment out of offering proceeds to the extent that the dividends exceeded earnings during such period. As such, the earnings per share pro forma for dividend for fiscal 2016 gives effect to the pro forma adjustment discussed, as well as the number of shares that would be required to generate proceeds necessary to pay the amount of the Special Dividend and Option Payments paid in September 2016 in excess of fiscal 2016 earnings, up to the amount of shares assumed to be issued in the offering. The following table sets forth the computation of pro forma basic and diluted earnings per share pro forma for
F-32
FDO Holdings, Inc. and Subsidiaries
Notes to Consolidated Financial Statements (Continued)
December 29, 2016
10. Unaudited Earnings Per Share Pro Forma for Dividend (Continued)
dividend for fiscal 2016 based on an offering price of $ per share, the midpoint of the estimated range of the price set forth on the cover page of this prospectus:
| |
Year Ended December 29, 2016 |
|||
|---|---|---|---|---|
Net income (in thousands) |
$ | |||
| | | | | |
| | | | | |
| | | | | |
Amount of dividends |
||||
Excess of dividends over net income |
||||
Number of shares required to be issued at $ per share to pay excess of dividends over net income |
||||
Basic weighted average shares outstanding |
||||
Pro forma basic weighted average shares outstanding |
||||
Pro forma basic earnings per share |
||||
Dilutive weighted average shares outstanding |
||||
| | | | | |
Pro forma dilutive weighted average shares outstanding |
||||
| | | | | |
| | | | | |
| | | | | |
Pro forma dilutive earnings per share |
$ | |||
| | | | | |
| | | | | |
| | | | | |
11. Accrued Expenses
Accrued expenses consist of the following (in thousands):
| |
Year Ended December 31, 2015 |
Year Ended December 29, 2016 |
|||||
|---|---|---|---|---|---|---|---|
Accrued incentive compensation |
$ | 9,236 | $ | 14,799 | |||
Accrued legal fees |
183 | 13,642 | |||||
Other |
26,422 | 33,064 | |||||
Accrued expenses |
$ | 35,841 | $ | 61,505 | |||
F-33
Schedule I—FDO Holdings, Inc.
(parent company only)
Condensed Balance Sheets
(In Thousands, Except Share and Per Share Data)
| |
As of December 31, 2015 |
As of December 29, 2016 |
|||||
|---|---|---|---|---|---|---|---|
Assets |
|||||||
Current assets: |
|||||||
Accounts receivable from subsidiaries |
$ | — | $ | — | |||
| | | | | | | | |
Total current assets |
— | — | |||||
Long-term assets: |
|||||||
Investment in subsidiaries |
312,365 | 134,283 | |||||
| | | | | | | | |
Total long-term assets |
312,365 | 134,283 | |||||
| | | | | | | | |
Total assets |
$ | 312,365 | $ | 134,283 | |||
| | | | | | | | |
| | | | | | | | |
| | | | | | | | |
Liabilities and stockholders' equity |
|||||||
Current liabilities: |
|||||||
Notes payable |
$ | — | $ | — | |||
Accrued interest payable |
— | — | |||||
| | | | | | | | |
Total current liabilities |
— | — | |||||
| | | | | | | | |
Total liabilities |
— | — | |||||
| | | | | | | | |
Commitments and contingencies |
|||||||
Stockholders' equity |
|||||||
Capital stock: |
|||||||
Preferred stock, $0.001 par value; 100,000 shares authorized; 0 shares issued and outstanding at December 29, 2016 and December 31, 2015 |
— | — | |||||
Common stock Class A, $0.001 par value; 500,000 shares authorized; 238,789 shares issued and outstanding at December 29, 2016 and December 31, 2015 |
— | — | |||||
Common stock Class B, $0.001 par value; 100,000 shares authorized; 1,230 shares issued and outstanding at December 29, 2016; 779 shares issued and outstanding at December 31, 2015 |
— | — | |||||
Common stock Class C, $0.001 par value; 500,000 shares authorized; 19,500 shares issued and outstanding at December 29, 2016 and December 31, 2015 |
— | — | |||||
Additional paid-in capital |
264,371 | 117,353 | |||||
Accumulated other comprehensive loss, net |
(100 | ) | 176 | ||||
Retained earnings |
48,094 | 16,754 | |||||
| | | | | | | | |
Total stockholders' equity |
312,365 | 134,283 | |||||
| | | | | | | | |
Total liabilities and stockholders' equity |
$ | 312,365 | $ | 134,283 | |||
| | | | | | | | |
| | | | | | | | |
| | | | | | | | |
See accompanying notes to condensed financial statements.
F-34
Schedule I—FDO Holdings, Inc.
(parent company only)
Condensed Statements of Income
(In Thousands)
| |
Year Ended December 25, 2014 |
Year Ended December 31, 2015 |
Year Ended December 29, 2016 |
|||||||
|---|---|---|---|---|---|---|---|---|---|---|
Net income of subsidiaries |
$ | 15,098 | $ | 26,807 | $ | 43,039 | ||||
| | | | | | | | | | | |
Income before income taxes |
15,098 | 26,807 | 43,039 | |||||||
Benefit for income taxes |
— | — | — | |||||||
| | | | | | | | | | | |
Net income |
$ | 15,098 | $ | 26,807 | $ | 43,039 | ||||
| | | | | | | | | | | |
| | | | | | | | | | | |
| | | | | | | | | | | |
See accompanying notes to condensed financial statements.
F-35
Schedule I—FDO Holdings, Inc.
(parent company only)
Condensed Statements of Comprehensive Income
(In Thousands)
| |
Year Ended December 25, 2014 |
Year Ended December 31, 2015 |
Year Ended December 29, 2016 |
|||||||
|---|---|---|---|---|---|---|---|---|---|---|
Net income |
$ | 15,098 | $ | 26,807 | $ | 43,039 | ||||
Unrealized gain on fair value hedge instruments of subsidiaries, net of tax |
14 | 43 | 276 | |||||||
| | | | | | | | | | | |
Total comprehensive income |
$ | 15,112 | $ | 26,850 | $ | 43,315 | ||||
| | | | | | | | | | | |
| | | | | | | | | | | |
| | | | | | | | | | | |
See accompanying notes to condensed financial statements.
F-36
Schedule I—FDO Holdings, Inc.
(parent company only)
Consolidated Statements of Cash Flows
(In Thousands)
| |
Year Ended December 25, 2014 |
Year Ended December 31, 2015 |
Year Ended December 29, 2016 |
|||||||
|---|---|---|---|---|---|---|---|---|---|---|
Operating activities |
||||||||||
Net income |
$ | 15,098 | $ | 26,807 | $ | 43,039 | ||||
Adjustments to reconcile net income to net cash used in operating activities: |
||||||||||
Net income of subsidiaries |
(15,098 | ) | (26,807 | ) | (43,039 | ) | ||||
Net cash used in operating activities |
— | — | — | |||||||
Investing activities |
||||||||||
Investment in subsidiary |
(954 | ) | (40 | ) | (284 | ) | ||||
Distribution from subsidiary |
— | — | 225,000 | |||||||
| | | | | | | | | | | |
Net cash (used in) provided by investing activities |
(954 | ) | (40 | ) | 224,716 | |||||
Financing activities |
||||||||||
Proceeds from exercise of stock options |
954 | 40 | 284 | |||||||
Cash dividends |
— | — | (225,000 | ) | ||||||
| | | | | | | | | | | |
Net cash provided by (used in) financing activities |
954 | 40 | (244,716 | ) | ||||||
| | | | | | | | | | | |
Net change in cash and cash equivalents |
— | — | — | |||||||
Cash and cash equivalents, beginning of the year |
— | — | — | |||||||
| | | | | | | | | | | |
Cash and cash equivalents, end of the year |
$ | — | $ | — | $ | — | ||||
| | | | | | | | | | | |
| | | | | | | | | | | |
| | | | | | | | | | | |
See accompanying notes to consolidated financial statements.
F-37
Schedule I—FDO Holdings, Inc.
(parent company only)
Notes to Condensed Financial Statements
December 29, 2016
1. Basis of Presentation
In the parent-company-only financial statements, the Company's investment in subsidiaries is stated at cost plus equity in undistributed earnings of subsidiaries. The parent-company-only financial statements should be read in conjunction with the Company's consolidated financial statements.
2. Guarantees and Restrictions
As of December 29, 2016, Floor and Decor Outlets of America, Inc., a subsidiary of the Company, had $350,000 thousand of debt outstanding under the Term Loan Facility. As of December 29, 2016, Floor and Decor Outlets of America, Inc. also had $50,000 thousand outstanding under the ABL Facility, excluding outstanding letters of credit of $10,119 thousand. Under the terms of the credit agreements governing our Credit Facilities, the Company's subsidiaries have guaranteed the payment of all principal and interest. In the event of a default under our Credit Facilities, certain of the Company's subsidiaries will be directly liable to the debt holders. As of December 29, 2016, the Term Loan Facility had a maturity date of September 30, 2023, and the ABL Facility had a maturity date of September 30, 2021. The credit agreements governing our Credit Facilities also include restrictions on the ability of the Company's subsidiaries to (i) incur additional indebtedness and liens in connection therewith; (ii) pay dividends and make certain other restricted payments; (iii) effect mergers or consolidations; (iv) enter into transactions with affiliates; (v) sell or dispose of property or assets; and (vi) engage in unrelated lines of business.
F-38
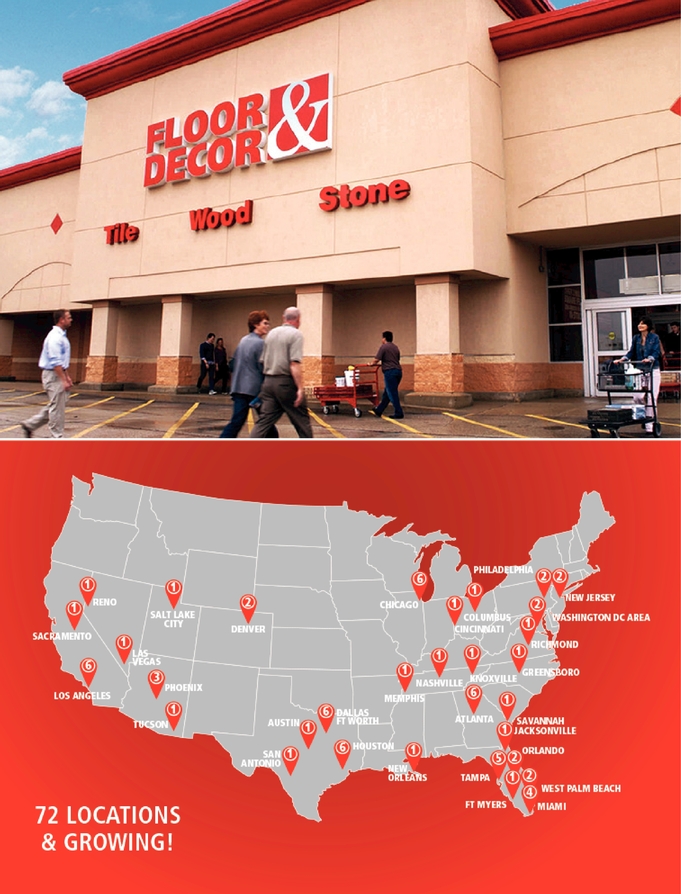

PART II
INFORMATION NOT REQUIRED IN PROSPECTUS
Item 13. Other Expenses of Issuance and Distribution
The following table sets forth the costs and expenses, other than underwriting discounts and commissions, payable by us in connection with the sale and distribution of the Class A common stock being registered. All amounts are estimates except for the SEC registration fee, the FINRA filing fee and the New York Stock Exchange listing fee.
SEC registration fee |
$ | 17,385 | (1) | |
FINRA filing fee |
23,000 | |||
New York Stock Exchange listing fee |
||||
Legal fees and expenses |
||||
Accounting fees and expenses |
||||
Printing and engraving expenses |
||||
Transfer agent and registrar fees and expenses |
||||
Blue sky fees and expenses |
||||
Miscellaneous fees and expenses |
||||
| | | | | |
Total |
$ | |||
| | | | | |
| | | | | |
| | | | | |
Item 14. Indemnification of Directors and Officers
Section 145 of the DGCL authorizes a court to award, or a corporation's board of directors to grant, indemnity to directors and officers in terms sufficiently broad to permit such indemnification under certain circumstances for liabilities, including reimbursement for expenses incurred, arising under the Securities Act.
Our certificate of incorporation and bylaws provide for indemnification of our directors, officers, employees, and other agents to the maximum extent permitted by the DGCL.
In addition, we have entered into indemnification agreements with our directors and officers containing provisions that are in some respects broader than the specific indemnification provisions contained in the DGCL. The indemnification agreements require us, among other things, to indemnify our directors against certain liabilities that may arise by reason of their status or service as directors and to advance their expenses incurred as a result of any proceeding against them as to which they could be indemnified.
We maintain insurance policies that indemnify our directors and officers against various liabilities arising under the Securities Act and the Exchange Act that might be incurred by any director or officer in his capacity as such.
The underwriters are obligated, under certain circumstances, pursuant to the underwriting agreement filed as Exhibit 1.1 hereto, to indemnify us and our officers and directors against liabilities under the Securities Act.
Item 15. Recent Sales of Unregistered Securities
The following sets forth information regarding all unregistered securities sold during the three years preceding the date of this registration statement and does not give effect to the conversion of each share of Floor & Decor Holdings, Inc. into shares of the corresponding class of common stock of
II-1
Floor & Decor Holdings, Inc. upon the effectiveness of the -for-one stock split of our common stock to be effected prior to the consummation of this offering:
II-2
Unless otherwise stated and except for the -for-one stock split of our common stock to be effected prior to the consummation of this offering, the sales of the above securities were deemed to be exempt from registration under the Securities Act in reliance upon Section 4(2) of the Securities Act (or Regulation D promulgated thereunder) or Rule 701 promulgated under Section 3(b) of the Securities Act as transactions by an issuer not involving any public offering or pursuant to benefit plans and contracts relating to compensation as provided under Rule 701. We did not pay or give, directly or indirectly, any commission or other remuneration, including underwriting discounts or commissions, in connection with any of the issuances of securities listed above. The recipients of the securities in each of these transactions represented their intentions to acquire the securities for investment only and not with a view to or for sale in connection with any distribution thereof, and appropriate legends were placed upon the stock certificates issued in these transactions. All recipients had adequate access, through their employment or other relationship with us or through other access to information provided by us, to information about us. The sales of these securities were made without any general solicitation or advertising.
Item 16. Exhibits and Financial Statement Schedules
| Exhibit No. |
Description of Exhibit | ||
|---|---|---|---|
| 1.1* | Form of Underwriting Agreement | ||
3.1* |
Form of Restated Certificate of Incorporation of Floor & Decor Holdings, Inc. |
||
3.2* |
Form of Second Amended and Restated Bylaws of Floor & Decor Holdings, Inc. |
||
4.1* |
Specimen Class A Common Stock Certificate |
||
4.2* |
Form of Registration Rights Agreement, to be effective upon the closing of this offering |
||
4.3* |
Form of Investor Rights Agreement, to be effective upon the closing of this offering |
||
5.1* |
Opinion of Proskauer Rose LLP |
||
10.1* |
FDO Holdings, Inc. Amended and Restated 2011 Stock Incentive Plan |
||
10.2* |
First Amendment to FDO Holdings, Inc. Amended and Restated 2011 Stock Incentive Plan |
||
10.3* |
Second Amendment to FDO Holdings, Inc. Amended and Restated 2011 Stock Incentive Plan |
||
10.4* |
Third Amendment to FDO Holdings, Inc. Amended and Restated 2011 Stock Incentive Plan |
||
10.5* |
Form of Stock Option Agreement under the FDO Holdings, Inc. Amended and Restated 2011 Stock Incentive Plan |
||
10.6* |
Form of Floor & Decor Holdings, Inc. 2017 Stock Incentive Plan |
||
II-3
| Exhibit No. |
Description of Exhibit | ||
|---|---|---|---|
| 10.7* | Form of Stock Option Agreement under the Floor & Decor Holdings, Inc. 2017 Stock Incentive Plan | ||
10.8* |
Form of Indemnification Agreement by and between Floor & Decor Holdings, Inc. and its directors and officers |
||
10.9* |
Amended and Restated Employment Agreement, dated July 29, 2015, between FDO Holdings, Inc., Floor and Decor Outlets of America, Inc. and Thomas V. Taylor |
||
10.10* |
Consulting Agreement, dated December 3, 2012, by and between Floor and Decor Outlets of America, Inc., FDO Holdings, Inc. and George Vincent West |
||
10.11* |
Amended and Restated Employment Agreement, dated July 29, 2015, between FDO Holdings, Inc., Floor and Decor Outlets of America, Inc. and Lisa G. Laube |
||
10.12* |
Amended and Restated Employment Agreement, dated July 29, 2015, between FDO Holdings, Inc., Floor and Decor Outlets of America, Inc. and Trevor S. Lang |
||
10.13* |
Amended and Restated Employment Agreement, dated July 29, 2015, between FDO Holdings, Inc., Floor and Decor Outlets of America, Inc. and David V. Christopherson |
||
10.14* |
Amended and Restated Employment Agreement, dated July 29, 2015, between FDO Holdings, Inc., Floor and Decor Outlets of America, Inc. and Brian K. Robbins |
||
10.15* |
Amended and Restated Credit Agreement, dated as of September 30, 2016, by and among Floor and Decor Outlets of America, Inc., FDO Acquisition Corp., Wells Fargo Bank, National Association, as Administrative Agent, Collateral Agent and Swing Line Lender, Wells Fargo Bank, National Association, as Term Loan Agent, the lenders from time to time party thereto, Bank of America, N.A., as Syndication Agent, and Wells Fargo Bank, National Association and Merrill Lynch, Pierce and Fenner & Smith Incorporated, as Joint Lead Arrangers and Joint Bookrunners |
||
10.16* |
Amended and Restated Security Agreement, dated as of September 30, 2016, by and among Floor and Decor Outlets of America, Inc., the other borrowers and guarantors party thereto from time to time, Wells Fargo Bank, National Association, as Collateral Agent, and Wells Fargo Bank, National Association, as Administrative Agent |
||
10.17* |
Credit Agreement, dated as of September 30, 2016, by and among Floor and Decor Outlets of America, Inc., FDO Acquisition Corp., the lenders from time to time parties thereto, UBS AG, Stamford Branch, as Administrative Agent and Collateral Agent, and UBS Securities LLC, Merrill Lynch, Pierce, Fenner & Smith Incorporated, Barclays Bank PLC, Goldman Sachs Bank USA and Wells Fargo Securities LLC, as Joint Lead Arrangers and Joint Bookrunners |
||
10.18* |
Security Agreement, dated as of September 30, 2016, by and among Floor and Decor Outlets of America, Inc., FDO Acquisition Corp., the other loan parties from time to time party thereto and UBS AG, Stamford Branch, as Collateral Agent and Administrative Agent and the lenders party thereto |
||
10.19* |
Guaranty Agreement, dated as of September 30, 2016, by FDO Acquisition Corp. in favor of UBS AG, Stamford Branch, as Collateral Agent, and UBS AG, Stamford Branch, as Administrative Agent and the lenders party thereto |
||
21.1* |
List of subsidiaries |
||
23.1* |
Consent of Proskauer Rose LLP (included in Exhibit 5.1) |
||
II-4
| Exhibit No. |
Description of Exhibit | ||
|---|---|---|---|
| 23.2 | Consent of Ernst & Young LLP, independent registered public accounting firm | ||
24.1** |
Power of Attorney (included on the signature page of this Registration Statement) |
||
Schedules have been omitted because the information required to be set forth therein is not applicable or is included in the consolidated financial statements or related notes.
The undersigned Registrant hereby undertakes to provide to the underwriters at the closing specified in the underwriting agreement, certificates in such denominations and registered in such names as required by the underwriters to permit prompt delivery to each purchaser.
Insofar as indemnification for liabilities arising under the Securities Act may be permitted to directors, officers and controlling persons of the Registrant pursuant to the foregoing provisions, or otherwise, the Registrant has been advised that in the opinion of the Securities and Exchange Commission such indemnification is against public policy as expressed in the Securities Act and is, therefore, unenforceable. In the event that a claim for indemnification against such liabilities (other than the payment by the Registrant of expenses incurred or paid by a director, officer or controlling person of the Registrant in the successful defense of any action, suit or proceeding) is asserted by such director, officer or controlling person in connection with the securities being registered, the Registrant will, unless in the opinion of its counsel the matter has been settled by controlling precedent, submit to a court of appropriate jurisdiction the question whether such indemnification by it is against public policy as expressed in the Securities Act and will be governed by the final adjudication of such issue.
The undersigned Registrant hereby undertakes that:
(1) For purposes of determining any liability under the Securities Act of 1933, the information omitted from the form of prospectus filed as part of this registration statement in reliance upon Rule 430A and contained in a form of prospectus filed by the Registrant pursuant to Rule 424(b)(1) or (4) or 497(h) under the Securities Act shall be deemed to be part of this registration statement as of the time it was declared effective.
(2) For the purpose of determining any liability under the Securities Act of 1933, each post-effective amendment that contains a form of prospectus shall be deemed to be a new registration statement relating to the securities offered therein, and the offering of such securities at that time shall be deemed to be the initial bona fide offering thereof.
II-5
Pursuant to the requirements of the Securities Act of 1933, the registrant has duly caused this registration statement to be signed on its behalf by the undersigned, thereunto duly authorized, in the City of Smyrna, Georgia, on March 20, 2017.
| FDO HOLDINGS, INC. | ||||
By: |
/s/ THOMAS V. TAYLOR Thomas V. Taylor Chief Executive Officer |
|||
Pursuant to the requirements of the Securities Act of 1933, this registration statement has been signed by the following persons in the capacities and on the dates indicated.
Signature
|
Title
|
Date
|
||
|---|---|---|---|---|
| /s/ THOMAS V. TAYLOR Thomas V. Taylor |
Chief Executive Officer (Principal Executive Officer) and Director | March 20, 2017 | ||
/s/ TREVOR S. LANG Trevor S. Lang |
Executive Vice President and Chief Financial Officer (Principal Financial and Accounting Officer) |
March 20, 2017 |
||
* Norman H. Axelrod |
Chairman of the Board |
March 20, 2017 |
||
* George Vincent West |
Vice Chairman of the Board |
March 20, 2017 |
||
* Brad J. Brutocao |
Director |
March 20, 2017 |
||
* David B. Kaplan |
Director |
March 20, 2017 |
||
* Rachel H. Lee |
Director |
March 20, 2017 |
II-6
Signature
|
Title
|
Date
|
||
|---|---|---|---|---|
| * John M. Roth |
Director | March 20, 2017 | ||
* Peter M. Starrett |
Director |
March 20, 2017 |
| *By: | /s/ DAVID V. CHRISTOPHERSON David V. Christopherson Attorney-in-fact |
II-7
| Exhibit No. |
Description of Exhibit | ||
|---|---|---|---|
| 1.1 | * | Form of Underwriting Agreement | |
| 3.1 | * | Form of Restated Certificate of Incorporation of Floor & Decor Holdings, Inc. | |
| 3.2 | * | Form of Second Amended and Restated Bylaws of Floor & Decor Holdings, Inc. | |
| 4.1 | * | Specimen Class A Common Stock Certificate | |
| 4.2 | * | Form of Registration Rights Agreement, to be effective upon the closing of this offering | |
| 4.3 | * | Form of Investor Rights Agreement, to be effective upon the closing of this offering | |
| 5.1 | * | Opinion of Proskauer Rose LLP | |
| 10.1 | * | FDO Holdings, Inc. Amended and Restated 2011 Stock Incentive Plan | |
| 10.2 | * | First Amendment to FDO Holdings, Inc. Amended and Restated 2011 Stock Incentive Plan | |
| 10.3 | * | Second Amendment to FDO Holdings, Inc. Amended and Restated 2011 Stock Incentive Plan | |
| 10.4 | * | Third Amendment to FDO Holdings, Inc. Amended and Restated 2011 Stock Incentive Plan | |
| 10.5 | * | Form of Stock Option Agreement under the FDO Holdings, Inc. Amended and Restated 2011 Stock Incentive Plan | |
| 10.6 | * | Form of Floor & Decor Holdings, Inc. 2017 Stock Incentive Plan | |
| 10.7 | * | Form of Stock Option Agreement under the Floor & Decor Holdings, Inc. 2017 Stock Incentive Plan | |
| 10.8 | * | Form of Indemnification Agreement by and between Floor & Decor Holdings, Inc. and its directors and officers | |
| 10.9 | * | Amended and Restated Employment Agreement, dated July 29, 2015, between FDO Holdings, Inc., Floor and Decor Outlets of America, Inc. and Thomas V. Taylor | |
| 10.10 | * | Consulting Agreement, dated December 3, 2012, by and between Floor and Decor Outlets of America, Inc., FDO Holdings, Inc. and George Vincent West | |
| 10.11 | * | Amended and Restated Employment Agreement, dated July 29, 2015, between FDO Holdings, Inc., Floor and Decor Outlets of America, Inc. and Lisa G. Laube | |
| 10.12 | * | Amended and Restated Employment Agreement, dated July 29, 2015, between FDO Holdings, Inc., Floor and Decor Outlets of America, Inc. and Trevor S. Lang | |
| 10.13 | * | Amended and Restated Employment Agreement, dated July 29, 2015, between FDO Holdings, Inc., Floor and Decor Outlets of America, Inc. and David V. Christopherson | |
| 10.14 | * | Amended and Restated Employment Agreement, dated July 29, 2015, between FDO Holdings, Inc., Floor and Decor Outlets of America, Inc. and Brian K. Robbins | |
| 10.15 | * | Amended and Restated Credit Agreement, dated as of September 30, 2016, by and among Floor and Decor Outlets of America, Inc., FDO Acquisition Corp., Wells Fargo Bank, National Association, as Administrative Agent, Collateral Agent and Swing Line Lender, Wells Fargo Bank, National Association, as Term Loan Agent, the lenders from time to time party thereto, Bank of America, N.A., as Syndication Agent, and Wells Fargo Bank, National Association and Merrill Lynch, Pierce and Fenner & Smith Incorporated, as Joint Lead Arrangers and Joint Bookrunners | |
II-8
| Exhibit No. |
Description of Exhibit | ||
|---|---|---|---|
| 10.16 | * | Amended and Restated Security Agreement, dated as of September 30, 2016, by and among Floor and Decor Outlets of America, Inc., the other borrowers and guarantors party thereto from time to time, Wells Fargo Bank, National Association, as Collateral Agent, and Wells Fargo Bank, National Association, as Administrative Agent | |
| 10.17 | * | Credit Agreement, dated as of September 30, 2016, by and among Floor and Decor Outlets of America, Inc., FDO Acquisition Corp., the lenders from time to time parties thereto, UBS AG, Stamford Branch, as Administrative Agent and Collateral Agent, and UBS Securities LLC, Merrill Lynch, Pierce, Fenner & Smith Incorporated, Barclays Bank PLC, Goldman Sachs Bank USA and Wells Fargo Securities LLC, as Joint Lead Arrangers and Joint Bookrunners | |
| 10.18 | * | Security Agreement, dated as of September 30, 2016, by and among Floor and Decor Outlets of America, Inc., FDO Acquisition Corp., the other loan parties from time to time party thereto and UBS AG, Stamford Branch, as Collateral Agent and Administrative Agent and the lenders party thereto | |
| 10.19 | * | Guaranty Agreement, dated as of September 30, 2016, by FDO Acquisition Corp. in favor of UBS AG, Stamford Branch, as Collateral Agent, and UBS AG, Stamford Branch, as Administrative Agent and the lenders party thereto | |
| 21.1 | * | List of subsidiaries | |
| 23.1 | * | Consent of Proskauer Rose LLP (included in Exhibit 5.1) | |
| 23.2 | Consent of Ernst & Young LLP, independent registered public accounting firm | ||
| 24.1 | ** | Power of Attorney (included on the signature page of this Registration Statement) | |
II-9